Strategic Business Decision Making for Kitchen Designs Ltd Growth
VerifiedAdded on 2024/05/16
|32
|5631
|251
Report
AI Summary
This report provides a comprehensive analysis of business decision-making for Kitchen Designs Ltd, focusing on the company's potential diversification into the bathroom market. It details a plan for collecting primary and secondary data, including survey methodology and questionnaire design. The report summarizes and analyzes 12 months of sales data using Excel, employing measures of central tendency and dispersion to draw conclusions for management. It includes graphical representations of sales trends, forecasts for the following year, and a discussion of information processing tools for inventory management. Furthermore, the report evaluates investment alternatives using NPV and IRR, culminating in a formal report and presentation suitable for the board of directors. This document is available on Desklib, where students can find a wealth of study resources, including solved assignments and past papers.

BUSINESS DECISION MAKING
Paraphrase This Document
Need a fresh take? Get an instant paraphrase of this document with our AI Paraphraser
TABLE OF CONTENTS
INTRODUCTION................................................................................................................................1
TASK 1.................................................................................................................................................2
1.1 Create plan for collection of primary and secondary data specifying the type of primary and
secondary data that can help Kitchen Design Ltd diversify into the Bathroom market category....2
2 Present the survey methodology and sampling frame you will use to carry out the research.......3
1.3 design the questionnaire for collecting the information.............................................................4
TASK 2.................................................................................................................................................7
2.1 Summarize 12 months data with excel using representative value and explain in general terms
what these values measure...............................................................................................................7
2.2 Analyze the results of Task 2.1 and draw valid conclusions for the management of Kitchen
Designs Ltd.......................................................................................................................................7
2.3 Using MS excel analyze the data in Table 1 above with measures of dispersion (Range, Inter-
quartile range, and Standard Deviation) to inform the management of Kitchen Designs Ltd.........8
2.4 Explain how you can use quartiles, percentiles and the correlation coefficient to draw useful
conclusions.......................................................................................................................................9
TASK 3...............................................................................................................................................10
3.1 Produce graphs as appropriate and draw conclusions to aid decision making.........................10
3.2 Using MS excel, for each of the 4 product classes in Table 2 above, create a scatter graph
with trend lines; use these four trend lines forecast sales for the following year...........................12
3.3 prepare a PowerPoint business presentation to disseminate information relevant to the board
of Kitchen Designs Ltd...................................................................................................................15
3.4 Produce the formal report.........................................................................................................16
TASK 4...............................................................................................................................................18
4.1 Explain how information processing tools can be used to manage the inventory effectively. 18
4.2 Prepare a project plan for the given project activity and determine the critical path...............18
4.3 using the investment appraisal tools of NPV & IRR, propose better MIS investment
alternative to Kitchen design Ltd...................................................................................................21
CONCLUSION..................................................................................................................................25

REFERENCES...................................................................................................................................26
⊘ This is a preview!⊘
Do you want full access?
Subscribe today to unlock all pages.
Trusted by 1+ million students worldwide
LIST OF FIGURES
Figure 1: Calculation of quartiles, percentiles and the correlation coefficient....................................9
Figure 2: Sales of Victorian................................................................................................................10
Figure 3: Sales of Budget...................................................................................................................11
Figure 4: Sales of Wet room...............................................................................................................11
Figure 5: Sales of Sauna.....................................................................................................................12
Figure 6: Scatter diagram for the Victorian product..........................................................................12
Figure 7: Scatter diagram for Wet-room............................................................................................13
Figure 8: Scatter diagram for Budget.................................................................................................13
Figure 9: Scatter diagram for Sauna...................................................................................................14
Figure 10: Scatter diagram for overall products.................................................................................14
Figure 11: Network diagram..............................................................................................................20
Figure 12: Formula for IRR................................................................................................................24
Paraphrase This Document
Need a fresh take? Get an instant paraphrase of this document with our AI Paraphraser

LIST OF TABLES
Table 1: Action plan.............................................................................................................................2
Table 2: Gantt chart..............................................................................................................................3
Table 3: Critical path calculation.......................................................................................................20
Table 4: NPV calculation for project A..............................................................................................21
Table 5: Calculation for NPV for Project B.......................................................................................22
INTRODUCTION
Business decision making is the important function in management operations. It is generally said
that a good decision making power can make the organization successful at new heights and one
wrong decision puts the organization is difficult circumstances. An effective decision making is
necessary and must be based on relevant information. In the current study, the business decision
making relates to the exploration or diversification to the newer business from kitchen design
products to bathroom designs for Kitchen Designs Ltd. Therefore to make decision in this regard a
study will be carried out covering practical aspects as well.
In the current study, the report will cover the variety of sources for collection of data from both
primary and secondary sources along with preparing the questionnaire set for customers. It will also
assess the range of techniques for analyzing the data effectively for business purpose with using
statistical calculations. The report will formulate the information in appropriate formats for decision
making of Kitchen Designs Ltd with using suitable presentation and graphs. At last the study will
cover the software generated information to make the decision for managing inventory a long with
reflecting financial tools and critical path analysis for both the projects.
1
⊘ This is a preview!⊘
Do you want full access?
Subscribe today to unlock all pages.
Trusted by 1+ million students worldwide
TASK 1
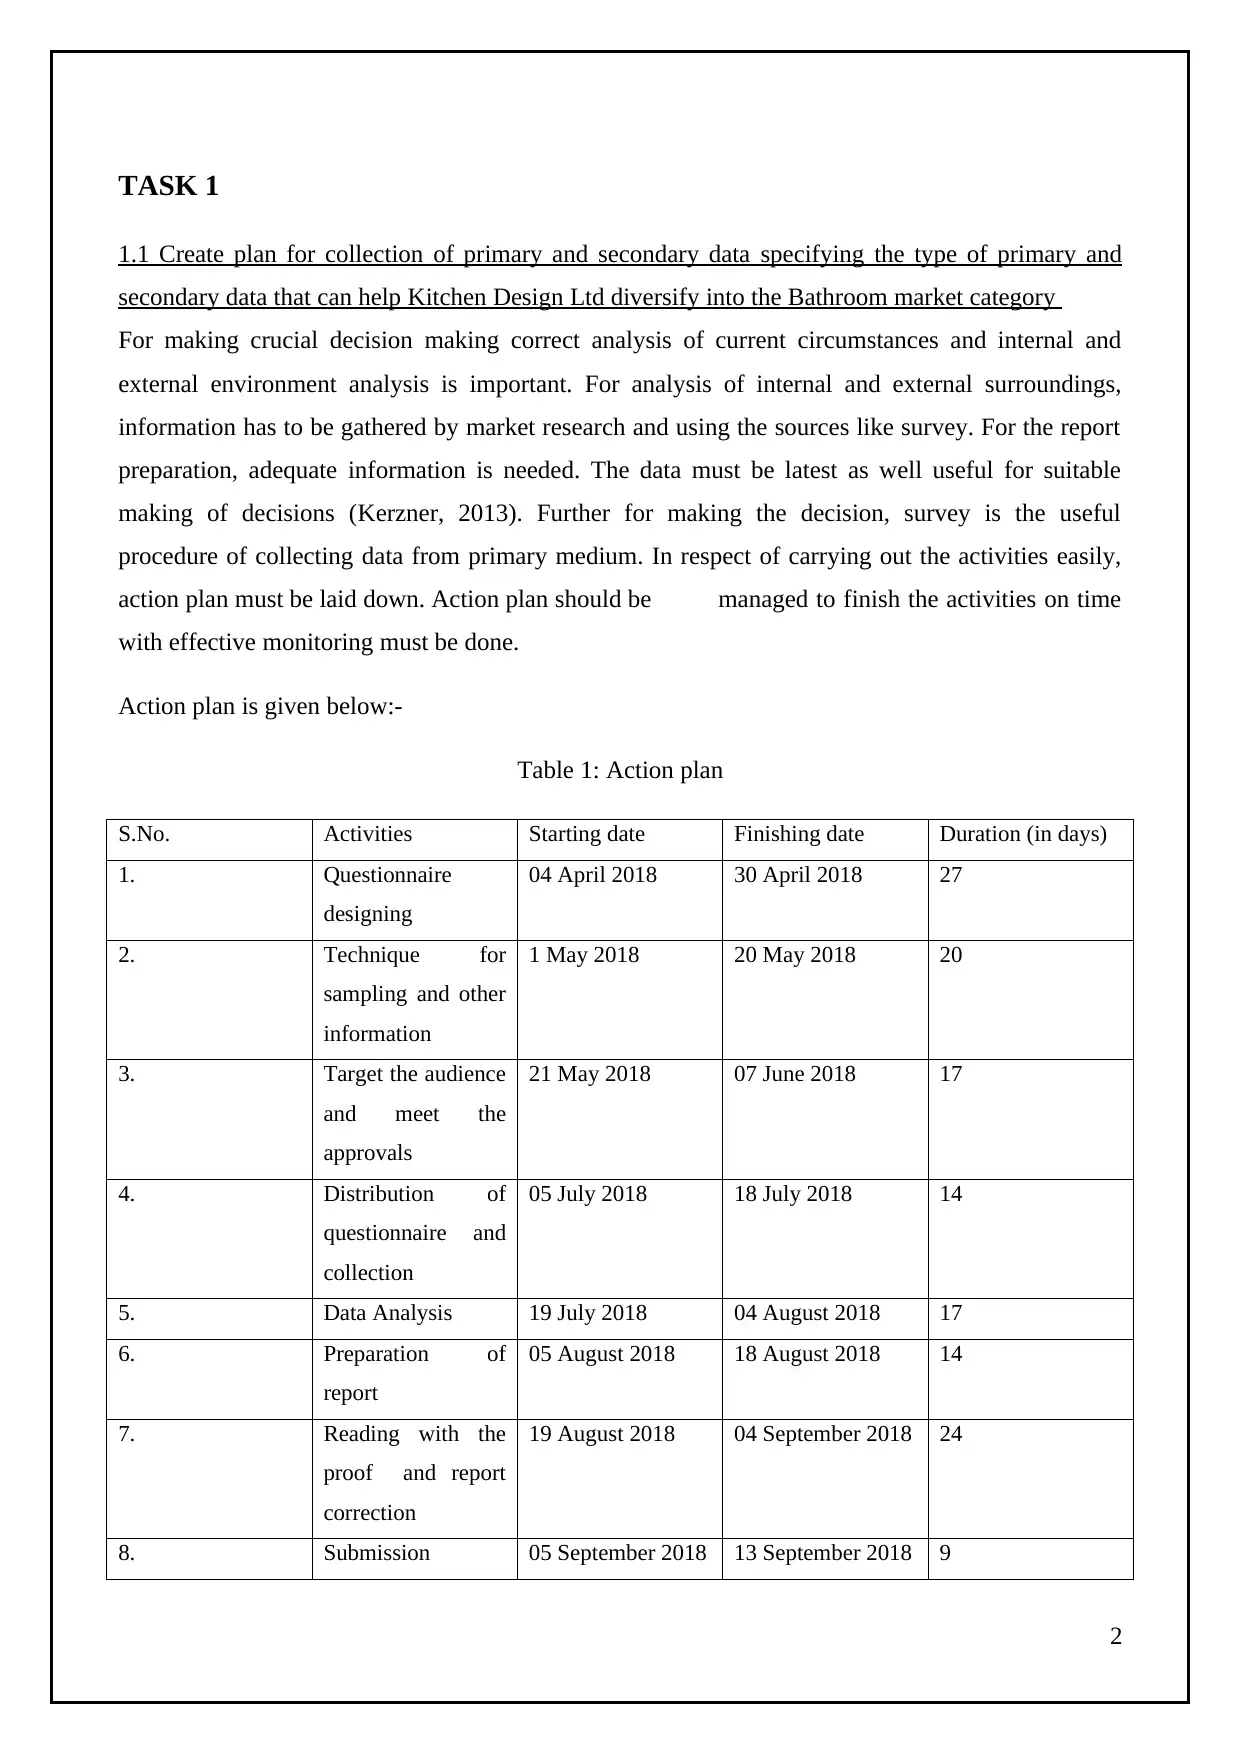
1.1 Create plan for collection of primary and secondary data specifying the type of primary and
secondary data that can help Kitchen Design Ltd diversify into the Bathroom market category
For making crucial decision making correct analysis of current circumstances and internal and
external environment analysis is important. For analysis of internal and external surroundings,
information has to be gathered by market research and using the sources like survey. For the report
preparation, adequate information is needed. The data must be latest as well useful for suitable
making of decisions (Kerzner, 2013). Further for making the decision, survey is the useful
procedure of collecting data from primary medium. In respect of carrying out the activities easily,
action plan must be laid down. Action plan should be managed to finish the activities on time
with effective monitoring must be done.
Action plan is given below:-
Table 1: Action plan
S.No. Activities Starting date Finishing date Duration (in days)
1. Questionnaire
designing
04 April 2018 30 April 2018 27
2. Technique for
sampling and other
information
1 May 2018 20 May 2018 20
3. Target the audience
and meet the
approvals
21 May 2018 07 June 2018 17
4. Distribution of
questionnaire and
collection
05 July 2018 18 July 2018 14
5. Data Analysis 19 July 2018 04 August 2018 17
6. Preparation of
report
05 August 2018 18 August 2018 14
7. Reading with the
proof and report
correction
19 August 2018 04 September 2018 24
8. Submission 05 September 2018 13 September 2018 9
2
Paraphrase This Document
Need a fresh take? Get an instant paraphrase of this document with our AI Paraphraser
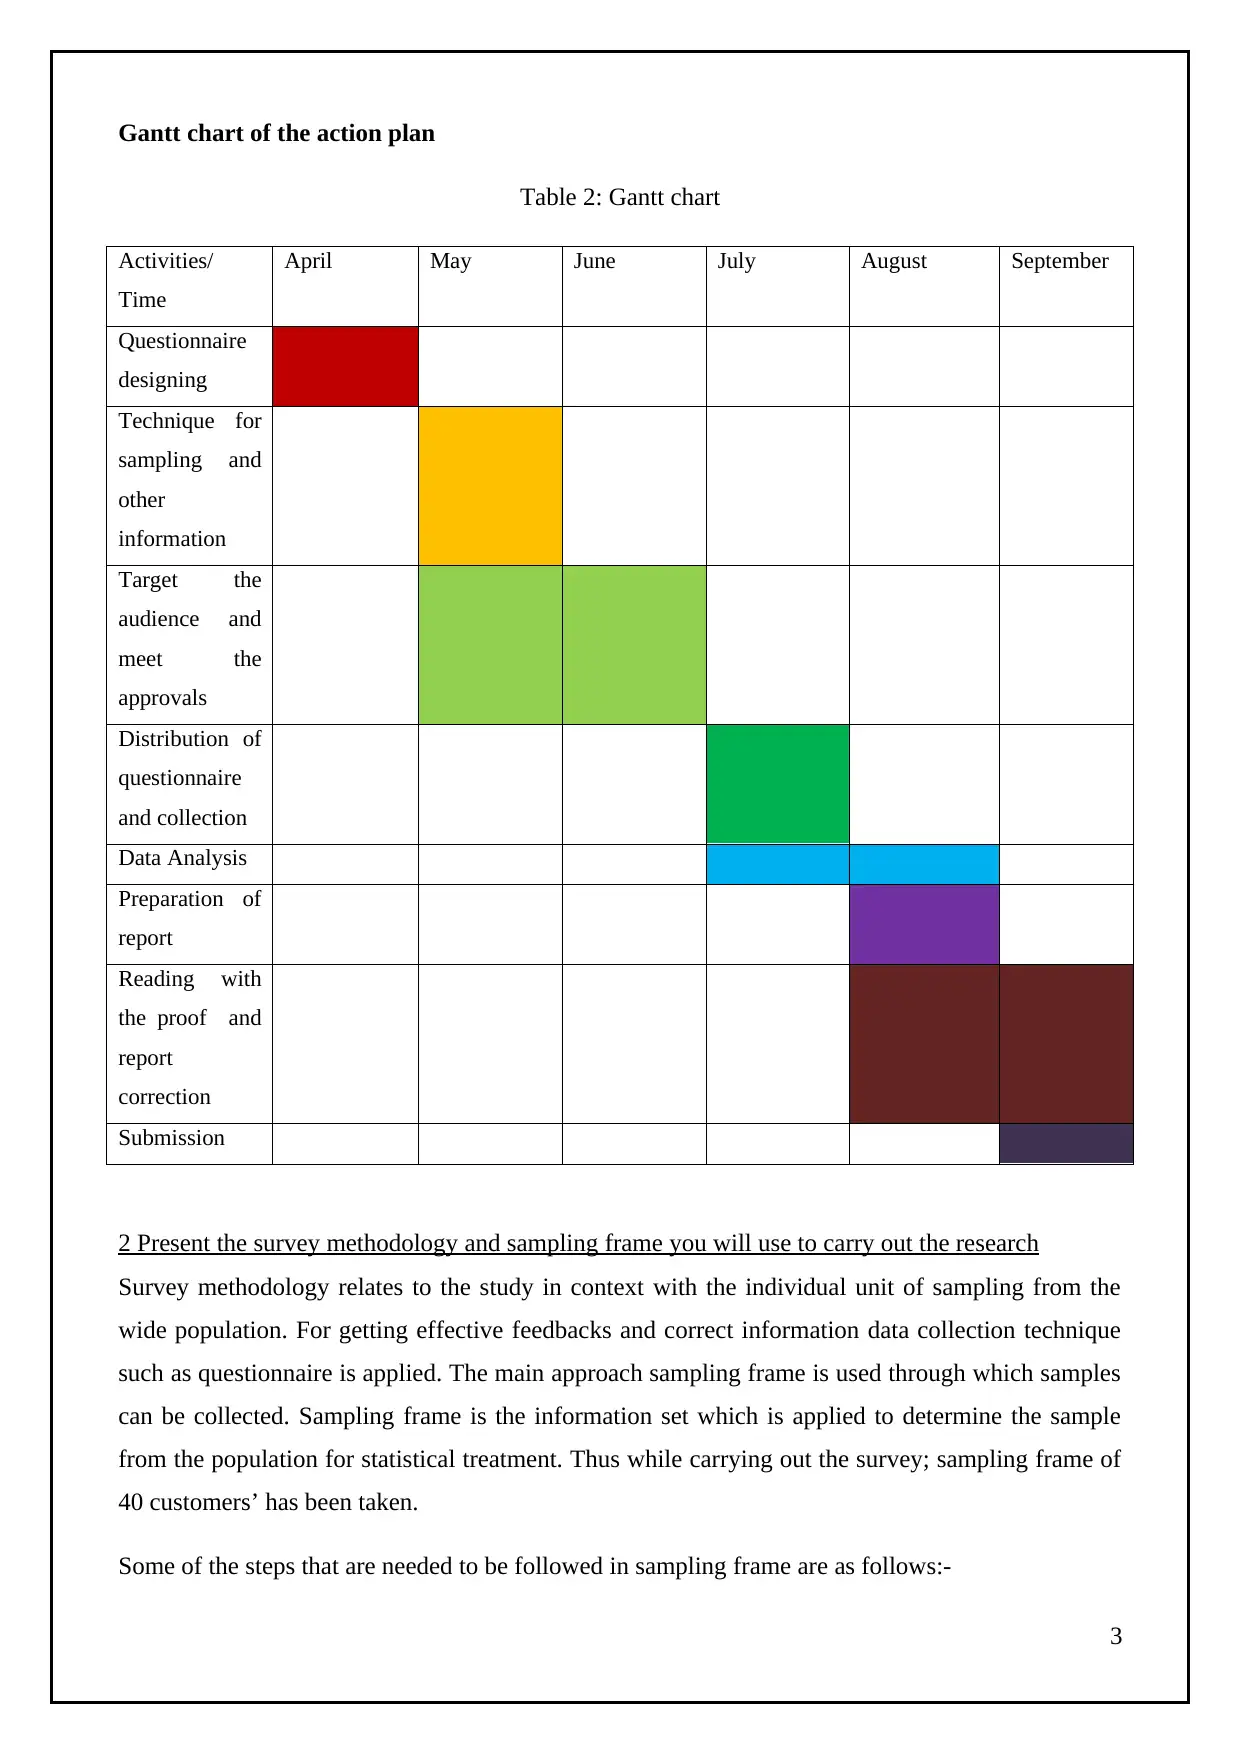
Gantt chart of the action plan
Table 2: Gantt chart
Activities/
Time
April May June July August September
Questionnaire
designing
Technique for
sampling and
other
information
Target the
audience and
meet the
approvals
Distribution of
questionnaire
and collection
Data Analysis
Preparation of
report
Reading with
the proof and
report
correction
Submission
2 Present the survey methodology and sampling frame you will use to carry out the research
Survey methodology relates to the study in context with the individual unit of sampling from the
wide population. For getting effective feedbacks and correct information data collection technique
such as questionnaire is applied. The main approach sampling frame is used through which samples
can be collected. Sampling frame is the information set which is applied to determine the sample
from the population for statistical treatment. Thus while carrying out the survey; sampling frame of
40 customers’ has been taken.
Some of the steps that are needed to be followed in sampling frame are as follows:-
3
Collection of data or information: for decision making for diversifying the business into the
bathroom market information is needed to be gathered. For gathering information through primary
medium survey method and sampling frame is been applied.
Target the audience: in order to get the data and information, the customers from every segment is
collected.
Sampling approach: for getting the sample, random sampling is to be used as it is less time
consuming and simple to use.
Sample size: it is the size of the sample from which questionnaire are filled. In the current scenario,
the sample size is 40 customers that means 40 are the targeted from different segments in respect of
collecting the information.
Sampling: after collection of data random sampling is applied to have the analysis on the collected
information.
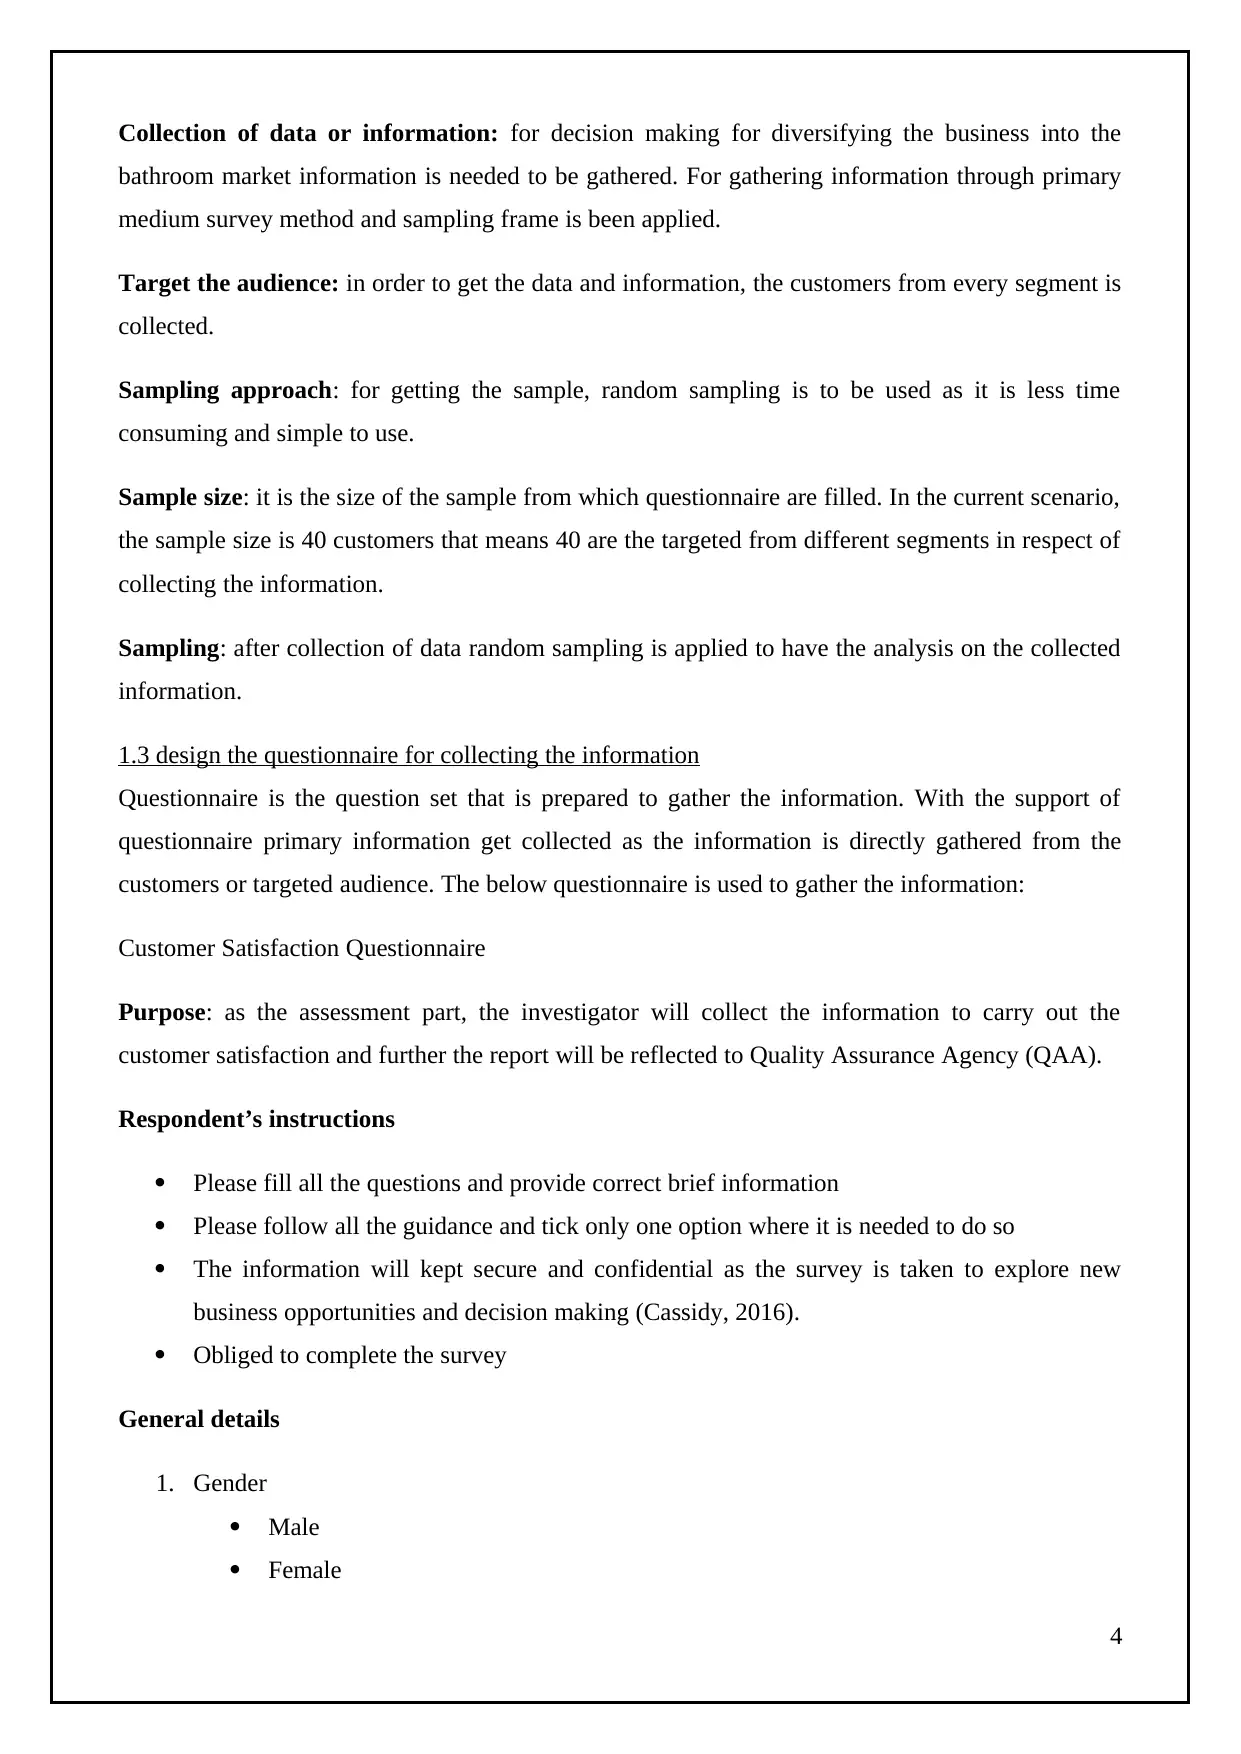
1.3 design the questionnaire for collecting the information
Questionnaire is the question set that is prepared to gather the information. With the support of
questionnaire primary information get collected as the information is directly gathered from the
customers or targeted audience. The below questionnaire is used to gather the information:
Customer Satisfaction Questionnaire
Purpose: as the assessment part, the investigator will collect the information to carry out the
customer satisfaction and further the report will be reflected to Quality Assurance Agency (QAA).
Respondent’s instructions
Please fill all the questions and provide correct brief information
Please follow all the guidance and tick only one option where it is needed to do so
The information will kept secure and confidential as the survey is taken to explore new
business opportunities and decision making (Cassidy, 2016).
Obliged to complete the survey
General details
1. Gender
Male
Female
4
bathroom market information is needed to be gathered. For gathering information through primary
medium survey method and sampling frame is been applied.
Target the audience: in order to get the data and information, the customers from every segment is
collected.
Sampling approach: for getting the sample, random sampling is to be used as it is less time
consuming and simple to use.
Sample size: it is the size of the sample from which questionnaire are filled. In the current scenario,
the sample size is 40 customers that means 40 are the targeted from different segments in respect of
collecting the information.
Sampling: after collection of data random sampling is applied to have the analysis on the collected
information.
1.3 design the questionnaire for collecting the information
Questionnaire is the question set that is prepared to gather the information. With the support of
questionnaire primary information get collected as the information is directly gathered from the
customers or targeted audience. The below questionnaire is used to gather the information:
Customer Satisfaction Questionnaire
Purpose: as the assessment part, the investigator will collect the information to carry out the
customer satisfaction and further the report will be reflected to Quality Assurance Agency (QAA).
Respondent’s instructions
Please fill all the questions and provide correct brief information
Please follow all the guidance and tick only one option where it is needed to do so
The information will kept secure and confidential as the survey is taken to explore new
business opportunities and decision making (Cassidy, 2016).
Obliged to complete the survey
General details
1. Gender
Male
Female
4
⊘ This is a preview!⊘
Do you want full access?
Subscribe today to unlock all pages.
Trusted by 1+ million students worldwide
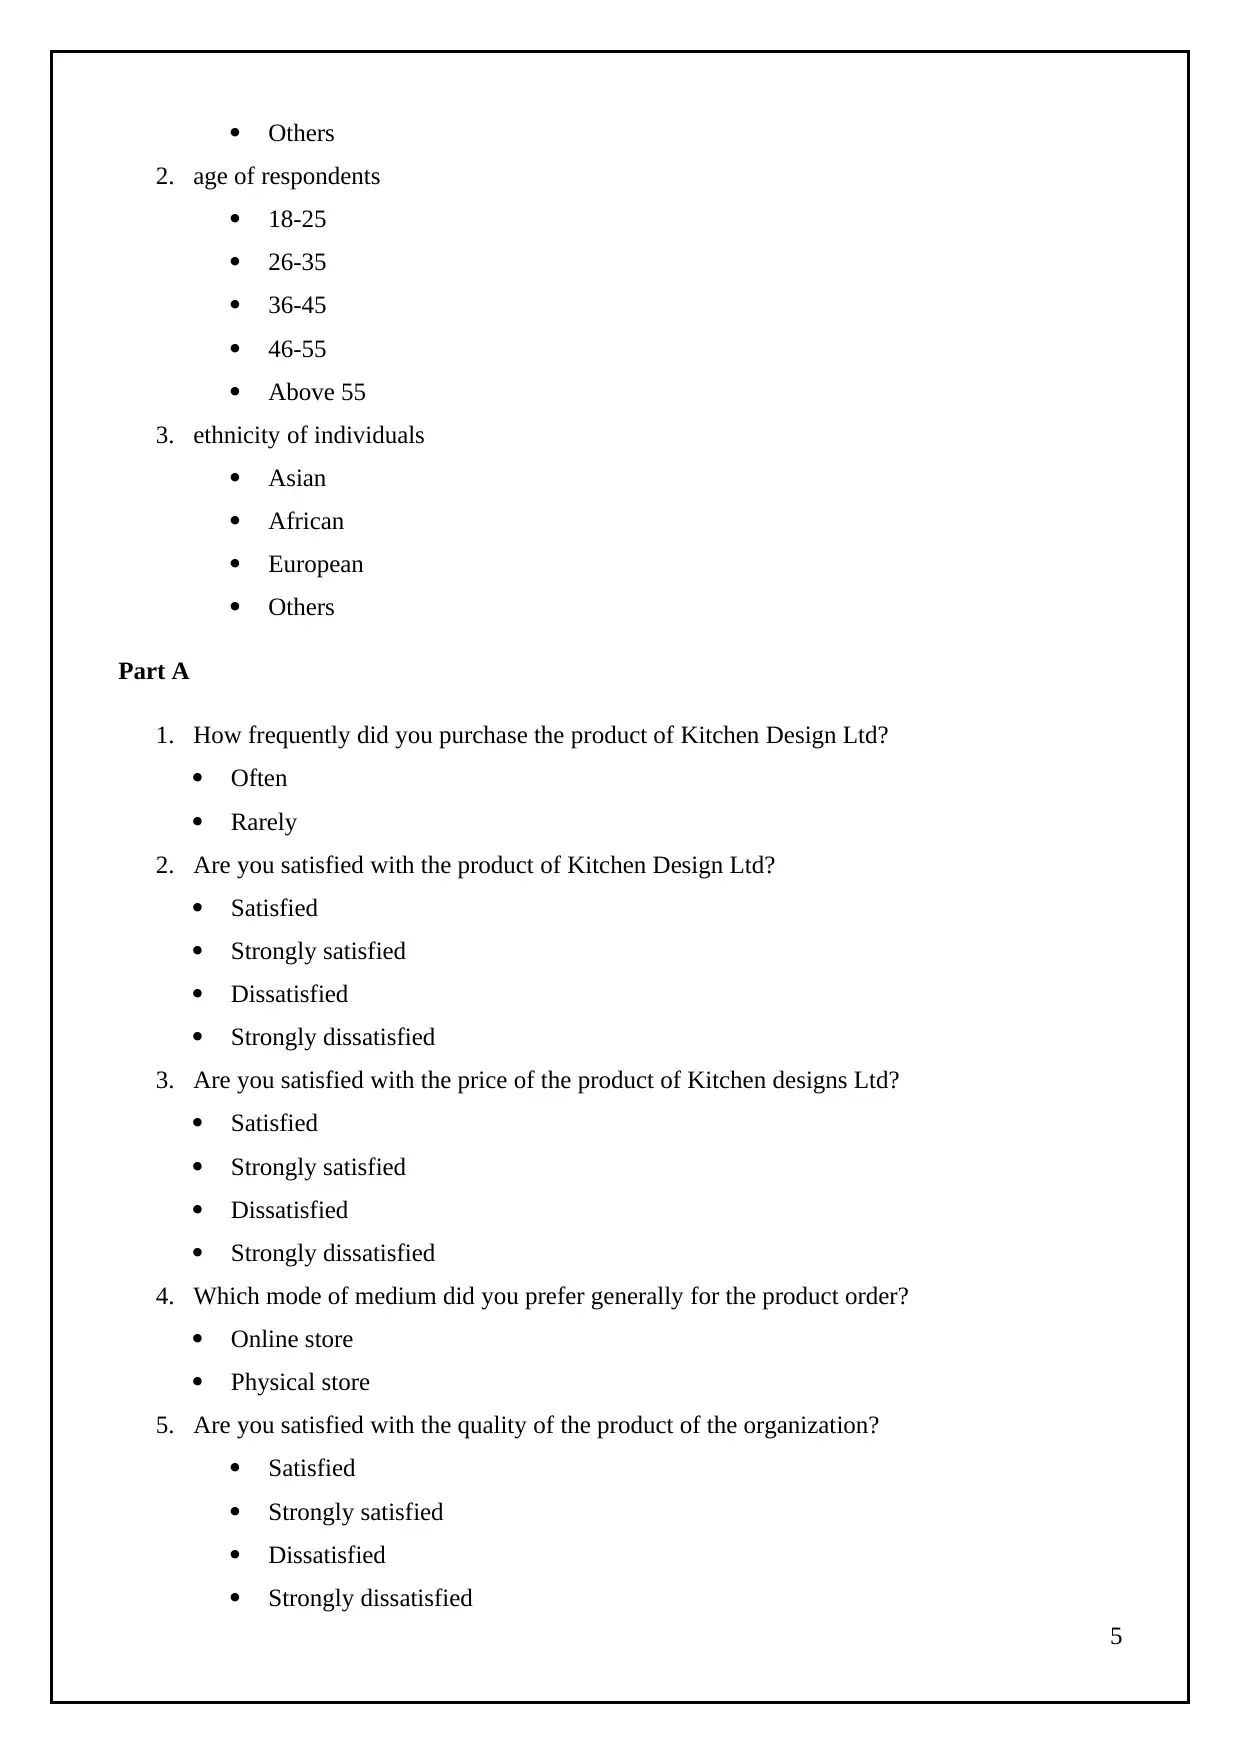
Others
2. age of respondents
18-25
26-35
36-45
46-55
Above 55
3. ethnicity of individuals
Asian
African
European
Others
Part A
1. How frequently did you purchase the product of Kitchen Design Ltd?
Often
Rarely
2. Are you satisfied with the product of Kitchen Design Ltd?
Satisfied
Strongly satisfied
Dissatisfied
Strongly dissatisfied
3. Are you satisfied with the price of the product of Kitchen designs Ltd?
Satisfied
Strongly satisfied
Dissatisfied
Strongly dissatisfied
4. Which mode of medium did you prefer generally for the product order?
Online store
Physical store
5. Are you satisfied with the quality of the product of the organization?
Satisfied
Strongly satisfied
Dissatisfied
Strongly dissatisfied
5
Paraphrase This Document
Need a fresh take? Get an instant paraphrase of this document with our AI Paraphraser
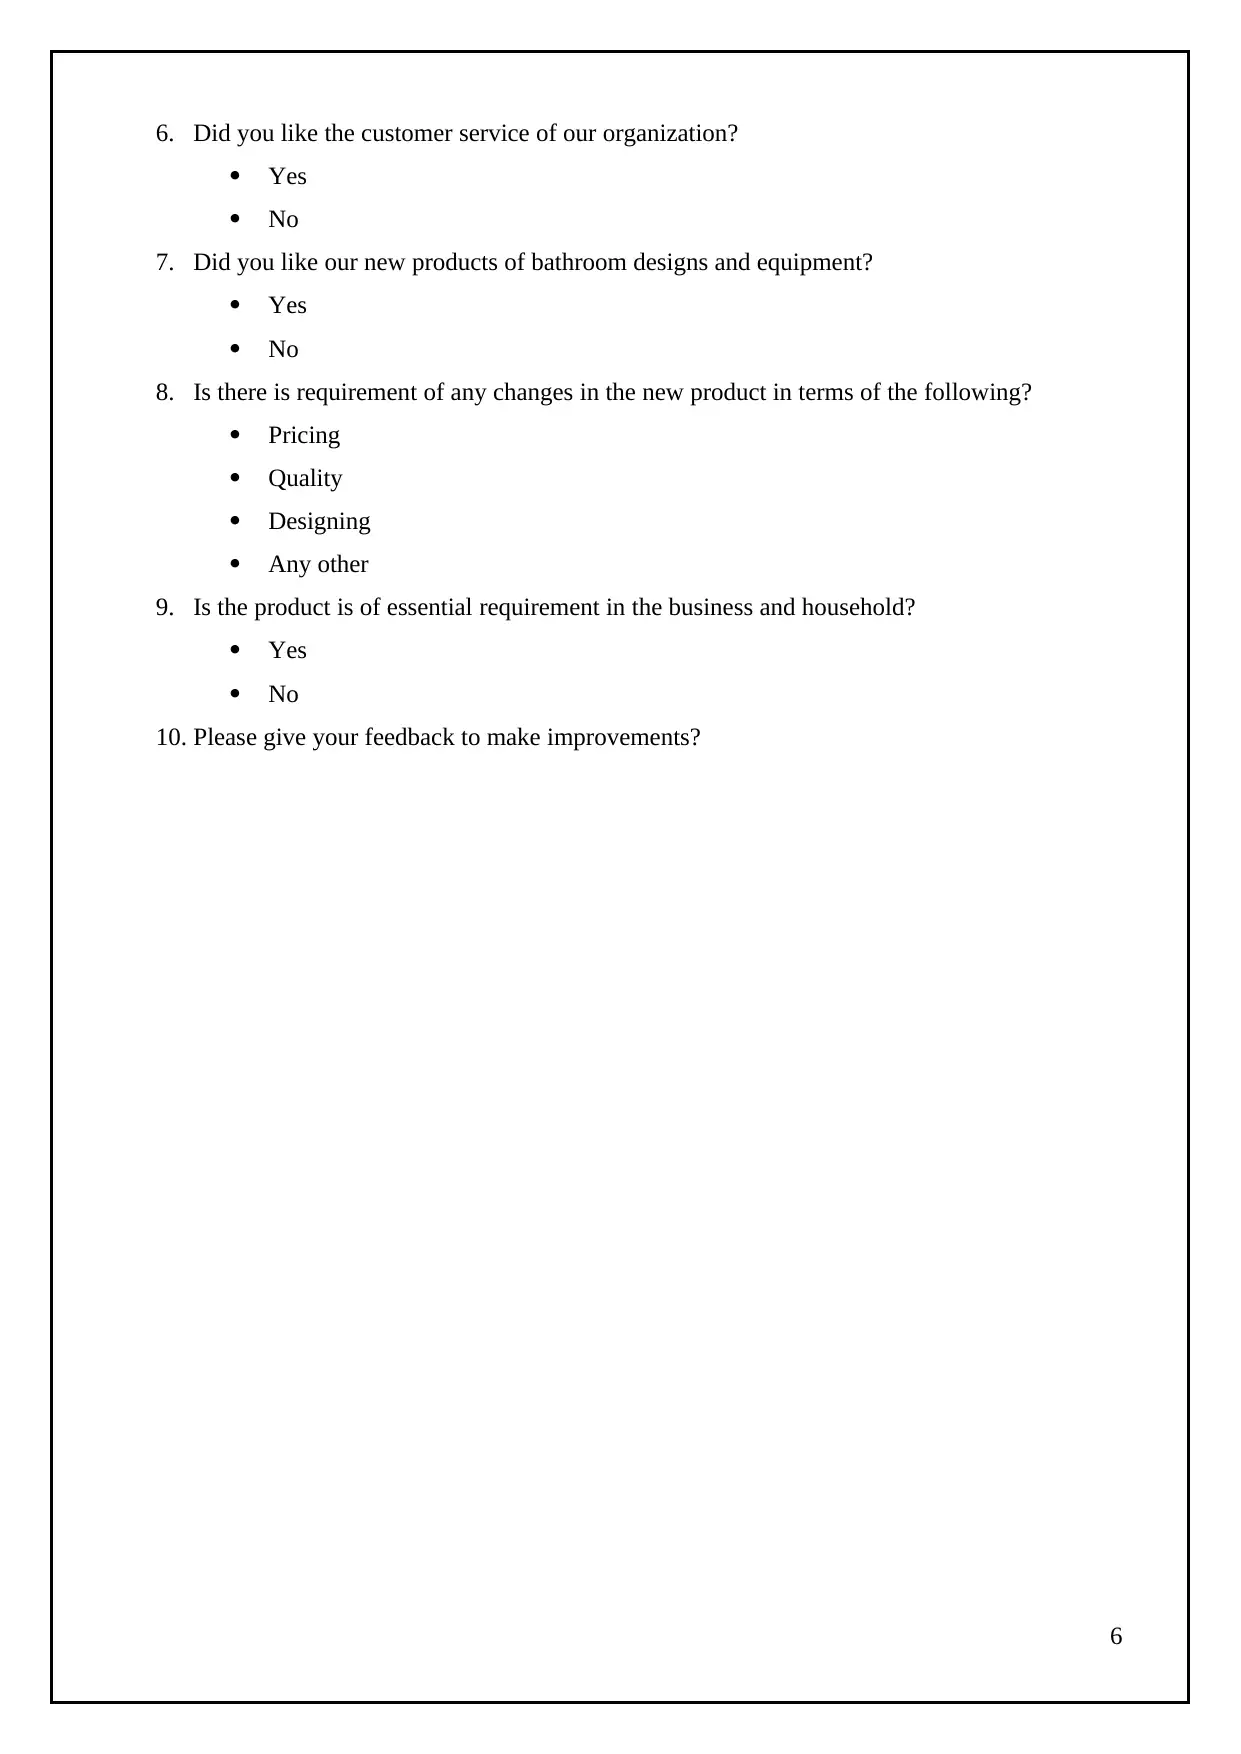
6. Did you like the customer service of our organization?
Yes
No
7. Did you like our new products of bathroom designs and equipment?
Yes
No
8. Is there is requirement of any changes in the new product in terms of the following?
Pricing
Quality
Designing
Any other
9. Is the product is of essential requirement in the business and household?
Yes
No
10. Please give your feedback to make improvements?
6
Yes
No
7. Did you like our new products of bathroom designs and equipment?
Yes
No
8. Is there is requirement of any changes in the new product in terms of the following?
Pricing
Quality
Designing
Any other
9. Is the product is of essential requirement in the business and household?
Yes
No
10. Please give your feedback to make improvements?
6
TASK 2
2.1 Summarize 12 months data with excel using representative value and explain in general terms
what these values measure?
Data gathered through survey and investigation related to the customer experience for the Kitchen
Design Limited will be shown in the systematic manner by application of central tendency. Central
tendency measure includes mean, median and mode. These measures are supportive in getting the
results related to the entire experience from the kitchen and bathroom products from the
organization.
The survey is carried out on 40 customers and their answers are gathered in both form percentage
and number that will take place in use of mean, mode and median. The information so measured is
given below:
Mean: Mean is the average calculation and the summarize form of the data so collected. The result
reflect that the organization offer both the products to every types of customers and help them to
fulfill their demands (Smith and Firth, 2011). Customers are satisfied from the product of the
organization. Thus greater value of mean reflects higher positive experience towards the product of
Kitchen Design Limited but regular revision must be done timely.
Median: Median is applied to measure the mid value of the frequency given in the information.
Sometimes median is also functioned as mean and after median analysis, it is determined that the
customers are satisfied with the products offered by the organization. Organization has the potential
to provide all types of products to the customers on the basis of the age and source of income.
Mode: Mode is applied to measure the greater frequency in the data. It has been assessed that many
customers are influenced and used the products of the organization for longer period of time
(García-Peñalvo and Conde, 2014). And the same is offered by the Kitchen Design Ltd so the
customers did not have problems related to the same.
2.2 Analyze the results of Task 2.1 and draw valid conclusions for the management of Kitchen
Designs Ltd
From the excel tables and charts, it is clear that the organization has not achieved a good number of
sales in the starting months of the year and same impact was seen at the end of the year in term of
the country. However, there was a good sale in between the year which has helped the organization
7
⊘ This is a preview!⊘
Do you want full access?
Subscribe today to unlock all pages.
Trusted by 1+ million students worldwide
1 out of 32
Related Documents


Your All-in-One AI-Powered Toolkit for Academic Success.
+13062052269
info@desklib.com
Available 24*7 on WhatsApp / Email
![[object Object]](/_next/static/media/star-bottom.7253800d.svg)
Unlock your academic potential
Copyright © 2020–2026 A2Z Services. All Rights Reserved. Developed and managed by ZUCOL.