Project Report: Strategic Financial Analysis for Business Decisions
VerifiedAdded on 2020/04/21
|29
|11329
|215
Project
AI Summary
This project report provides a comprehensive overview of strategic financial analysis, evaluating various techniques and tools to assess a company's position and performance. The report delves into both traditional methods, such as horizontal, vertical, and ratio analysis, and contemporary methods, including the Capital Asset Pricing Model (CAPM), the Dividend Growth Model, and the Effective Market Hypothesis. The report examines how these methods aid in making informed business decisions, comparing the performance of companies like Admiral plc and Amec plc using real-world examples and financial data. The analysis includes detailed discussions of each method's strengths, weaknesses, and practical applications, providing valuable insights for financial analysts, investors, and company management. The report also includes an appendix with financial data and visual aids to support the analysis.
Running Head: Strategic Financial Analysis 1
Project Report: Strategic Financial Analysis
Project Report: Strategic Financial Analysis
Paraphrase This Document
Need a fresh take? Get an instant paraphrase of this document with our AI Paraphraser
Strategic Financial Analysis 2
Contents
Introduction.......................................................................................................................3
Critical review of traditional methods of financial analysis.............................................3
Horizontal analysis.......................................................................................................3
Vertical analysis............................................................................................................5
Traditional ratio analysis..............................................................................................7
Contemporary methods of financial analysis.................................................................10
Capital asset pricing model.........................................................................................10
Dividend growth model..............................................................................................12
Effective market hypothesis.......................................................................................13
Conclusion......................................................................................................................14
References.......................................................................................................................15
Appendix.........................................................................................................................20
Strategic Financial Analysis 3
Introduction:
The strategic financial analysis report has been prepared t investigate over the various
techniques and tools which are useful for the company to make a better decision about the
position and the performance of the company in concern of the competitors and the last year
performance. Financial analysis is a study which is performed by the analysis, investors and
the management of the company to analyze the stability position, profitability position, and
financial position etc of a company.
Various tools and methods are variable to evaluate the financial analysis of a
company such as ratio analysis, vertical analysis, horizontal analysis etc. In this report, the
main concern has been shown over the traditional methods and contemporary method of
financial analysis and it has been evaluated that how both of these methods work and how
does it assist the comapny to make a better decision about the position and the performance
of the company.
For traditional methods, ratio analysis, vertical analysis and horizontal analysis has
been evaluated and for the contemporary methods, CAPM model, Dividend growth model
and effective market hypothesise has been taken into the concern. These report briefs that
how effective these analyses could be in evaluating the performance of a company.
Critical review of traditional methods of financial analysis:
The review over the traditional methods of the financial analysis is as follows:
Horizontal analysis:
Horizontal analysis is a form of analyzing the financial statement of the company on
the basis of last year or month’s performance. In this analysis, an analyst could compare the
performance of a month with the last month’s performance or a fiscal year. For instance, an
organization has generated different revenues in different year than it could be compared
through the horizontal analysis and it could be found that whether the revenues have been
enhanced or it has been reduced from the last year (Jiashu, 2009).
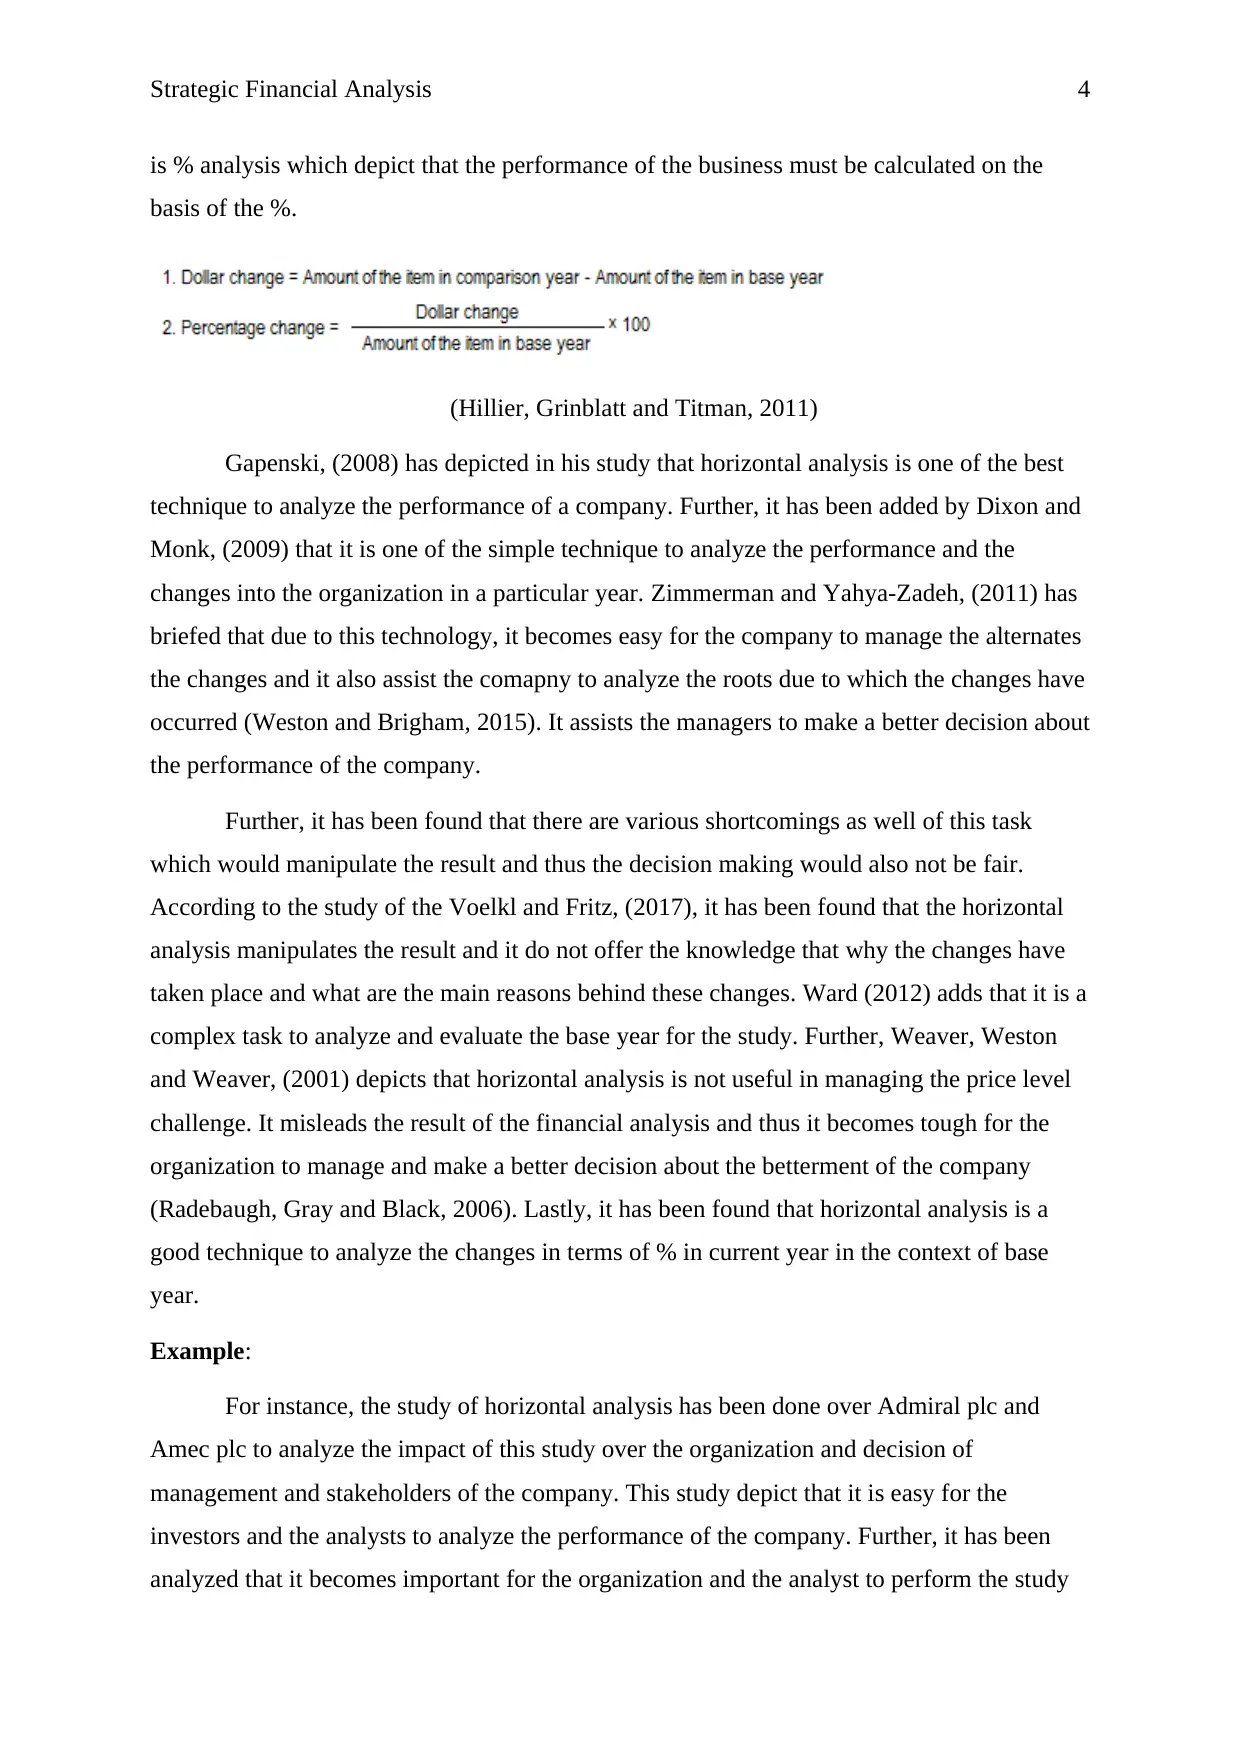
There are two methods to analyze the horizontal analysis of a company. First one is
dollar analysis, in which the amounts of two different periods are compared. This statement
helps a company to reach over a conclusion o reduce the level of the expenditure, second one
Introduction:
The strategic financial analysis report has been prepared t investigate over the various
techniques and tools which are useful for the company to make a better decision about the
position and the performance of the company in concern of the competitors and the last year
performance. Financial analysis is a study which is performed by the analysis, investors and
the management of the company to analyze the stability position, profitability position, and
financial position etc of a company.
Various tools and methods are variable to evaluate the financial analysis of a
company such as ratio analysis, vertical analysis, horizontal analysis etc. In this report, the
main concern has been shown over the traditional methods and contemporary method of
financial analysis and it has been evaluated that how both of these methods work and how
does it assist the comapny to make a better decision about the position and the performance
of the company.
For traditional methods, ratio analysis, vertical analysis and horizontal analysis has
been evaluated and for the contemporary methods, CAPM model, Dividend growth model
and effective market hypothesise has been taken into the concern. These report briefs that
how effective these analyses could be in evaluating the performance of a company.
Critical review of traditional methods of financial analysis:
The review over the traditional methods of the financial analysis is as follows:
Horizontal analysis:
Horizontal analysis is a form of analyzing the financial statement of the company on
the basis of last year or month’s performance. In this analysis, an analyst could compare the
performance of a month with the last month’s performance or a fiscal year. For instance, an
organization has generated different revenues in different year than it could be compared
through the horizontal analysis and it could be found that whether the revenues have been
enhanced or it has been reduced from the last year (Jiashu, 2009).
There are two methods to analyze the horizontal analysis of a company. First one is
dollar analysis, in which the amounts of two different periods are compared. This statement
helps a company to reach over a conclusion o reduce the level of the expenditure, second one
⊘ This is a preview!⊘
Do you want full access?
Subscribe today to unlock all pages.
Trusted by 1+ million students worldwide
Strategic Financial Analysis 4
is % analysis which depict that the performance of the business must be calculated on the
basis of the %.
(Hillier, Grinblatt and Titman, 2011)
Gapenski, (2008) has depicted in his study that horizontal analysis is one of the best
technique to analyze the performance of a company. Further, it has been added by Dixon and
Monk, (2009) that it is one of the simple technique to analyze the performance and the
changes into the organization in a particular year. Zimmerman and Yahya-Zadeh, (2011) has
briefed that due to this technology, it becomes easy for the company to manage the alternates
the changes and it also assist the comapny to analyze the roots due to which the changes have
occurred (Weston and Brigham, 2015). It assists the managers to make a better decision about
the performance of the company.
Further, it has been found that there are various shortcomings as well of this task
which would manipulate the result and thus the decision making would also not be fair.
According to the study of the Voelkl and Fritz, (2017), it has been found that the horizontal
analysis manipulates the result and it do not offer the knowledge that why the changes have
taken place and what are the main reasons behind these changes. Ward (2012) adds that it is a
complex task to analyze and evaluate the base year for the study. Further, Weaver, Weston
and Weaver, (2001) depicts that horizontal analysis is not useful in managing the price level
challenge. It misleads the result of the financial analysis and thus it becomes tough for the
organization to manage and make a better decision about the betterment of the company
(Radebaugh, Gray and Black, 2006). Lastly, it has been found that horizontal analysis is a
good technique to analyze the changes in terms of % in current year in the context of base
year.
Example:
For instance, the study of horizontal analysis has been done over Admiral plc and
Amec plc to analyze the impact of this study over the organization and decision of
management and stakeholders of the company. This study depict that it is easy for the
investors and the analysts to analyze the performance of the company. Further, it has been
analyzed that it becomes important for the organization and the analyst to perform the study
Paraphrase This Document
Need a fresh take? Get an instant paraphrase of this document with our AI Paraphraser
Strategic Financial Analysis 5
according to the rules and the norms to manage the performance of the company. From the
study of horizontal analysis over both the companies, it became easy for the stakeholders and
the management of the company to analyze the performance of the company and analyze the
changes in current year according to the past year (Kinsky, 2011). Further, it has been found
that the comparison study could also be easier.
Form the study of Admiral Plc, it has been found that the performance of company in
context of the figures of 2011 has been changed on a huge level. Currently the gross profit of
the company is 33.92% of gross profit of 2011 which is quite higher than any other year.
More, it has been found that the net profit of the company has also been 23.27% which is
highest in last 5 years (Appendix). Through this study, it has been found that the performance
of the company has also been enhanced.
Further, the study has been done over the balance sheet of the company to analyze the
performance of the company and changes in the financial figures of the company in last 5
years. From the study, it has been found that the level of total assets has been enhanced in
2015. Further, the total liabilities and total stakeholder’s equity depict that the various
positive changes have taken place into the financial figures of the company which depict
about the good performance of the company (Appendix).
Form the study of Amec Plc, it has been found that the performance of company in
context of the figures of 2011 has been changed on a huge level. Currently the gross profit of
the company is 38.59% of gross profit of 2011 which is quite higher than any other year.
More, it has been found that the net profit of the company has been -210.76% which is lowest
in last 5 years (Appendix). Through this study, it has been found that various changes have
taken place into the figures of the company in last 5 years.
Further, the study has been done over the balance sheet of the company to analyze the
performance of the company and changes in the financial figures of the company in last 5
years. From the study, it has been found that the level of total assets has been enhanced in
2015 (Appendix). Further, the total liabilities and total stakeholder’s equity depict that the
various positive changes have taken place into the financial figures of the company which
depict about the good performance of the company.
Vertical analysis:
Vertical analysis is a form of analyzing the financial statement of the company on the
basis of various categories such as sales, assets, liabilities, cash flow etc. In this analysis, an
Strategic Financial Analysis 6
analyst could compare the performance of a category according to the base category such as
in balance sheet, the figures must be compared according to their base figure i.e. assets,
liabilities and the total equity of the company. For instance, two or more companies of the
same industry have been analyzed and the analysis has been done according to their net profit
on the basis of their sales (Oliver and Schoff, 2017).
Variance analysis works on assumptions that the analyzed companies would be of the
same industry and all the data only bases over the basic figures. There is only one method to
analyze the vertical analysis of a company. That is dollar analysis, in which the amounts of
net profit would be compared to the sales of the company. This statement helps a company to
reach over a conclusion to reduce the level of the expenditure and make a better analysis
report about the performance of the company in comparison of the other company.
(lord, 2007)
Madhura (2011) has depicted in his study that vertical analysis is one of the best
technique to analyze the performance of a company and compare the company with other
companies in the same industry. Further, it has been added by Lacalle (2017) that it is one of
the simple technique to analyze the comparative study and the performance of the company.
Kaplan and Atkinson, (2015) has briefed that due to this technology, it becomes easy for the
investors to analyze the different companies and make a better decision about the
performance and the position of a company (Horngren, 2009). This analysis study helps the
analyst and financial managers to identify the position and reach over a good decision.
Further, it has been found that there are various shortcomings of the vertical analysis.
Schlichting, (2013) depicted that the people who are at the bottom level feel demotivated due
to vertical analysis in comparison of the upper chain. According to the study of the Phillips
and Stawarski, (2016), it has been found that the vertical analysis takes a lot of time to reach
over a final conclusion and it also makes the financial figures complex. Palicka, (2011) adds
that it is a complex task to analyze and evaluate the performance and the position of the
company in comparison of the competitive company (Madhura, 2014). Lastly, it has been
found that vertical analysis is a good technique to analyze the changes in the financial figures
of the company in comparison of the main base figure of the company.
Example:
⊘ This is a preview!⊘
Do you want full access?
Subscribe today to unlock all pages.
Trusted by 1+ million students worldwide
Strategic Financial Analysis 7
For instance, the study of vertical analysis has been done over Admiral plc and Amec
plc to analyze the importance and shortcomings of the vertical analysis in an organization.
Further, it has been analyzed that it becomes important for the organization and the analyst to
perform the study according to the rules and the norms to manage the performance of the
company (Borio, 2016). From the study of vertical analysis over both the companies, it
became easy for the stakeholders and the management of the company to analyze the
performance of the company and analyze the changes in current year according to the past
year. Further, it has been found that the comparison study could also be easier.
Form the study of Admiral Plc, it has been found that the performance of company in
context of gross profit has been better from last 5 years. Currently the gross profit of the
company is 74.97% of total sales. More, it has been found that the net profit of the company
has also been better in last 5 years. Through this study, it has been found that the performance
of the company has also been enhanced.
Further, the study has been done over the balance sheet of the company to analyze the
performance of the company. From the study, it has been found that the total current assets of
the company have been lowered in context of total assets in current year. Further, the study
over liabilities and stakeholder’s equity depict that the various changes have taken place into
the capital structure of the company.
Form the study of Amec Plc, it has been found that the performance of company in
context of gross profit has been bad from last 5 years. Currently the gross profit of the
company is 12.25% of total sales which has been very less from last 5 years. More, it has
been found that the net profit of the company has also been worst in last 5 years (Appendix).
Through this study, it has been found that the performance of the company has been worst in
last 5 years and company is supposed to make few changes into the performance.
Further, the study has been done over the balance sheet of the company to analyze the
performance of the company. From the study, it has been found that the total current assets of
the company have been lowered in context of total assets in current year (Appendix). Further,
the study over liabilities and stakeholder’s equity depict that the various changes have taken
place into the capital structure of the company.
Traditional ratio analysis:
Traditional ratio analysis is a form of analyzing the financial statement of the company on the
basis of various categories such as liquidity position, solvency position, profitability position,
Paraphrase This Document
Need a fresh take? Get an instant paraphrase of this document with our AI Paraphraser
Strategic Financial Analysis 8
efficiency position etc. In this analysis, an analyst could compare the performance of a
company according to the various categories such as in profitability position, the net profit of
the company could be compared with the total sales of the company. For instance, two or
more periods of a company have been analyzed and the analysis has been done according to
their various financial figures (krantz, 2016).
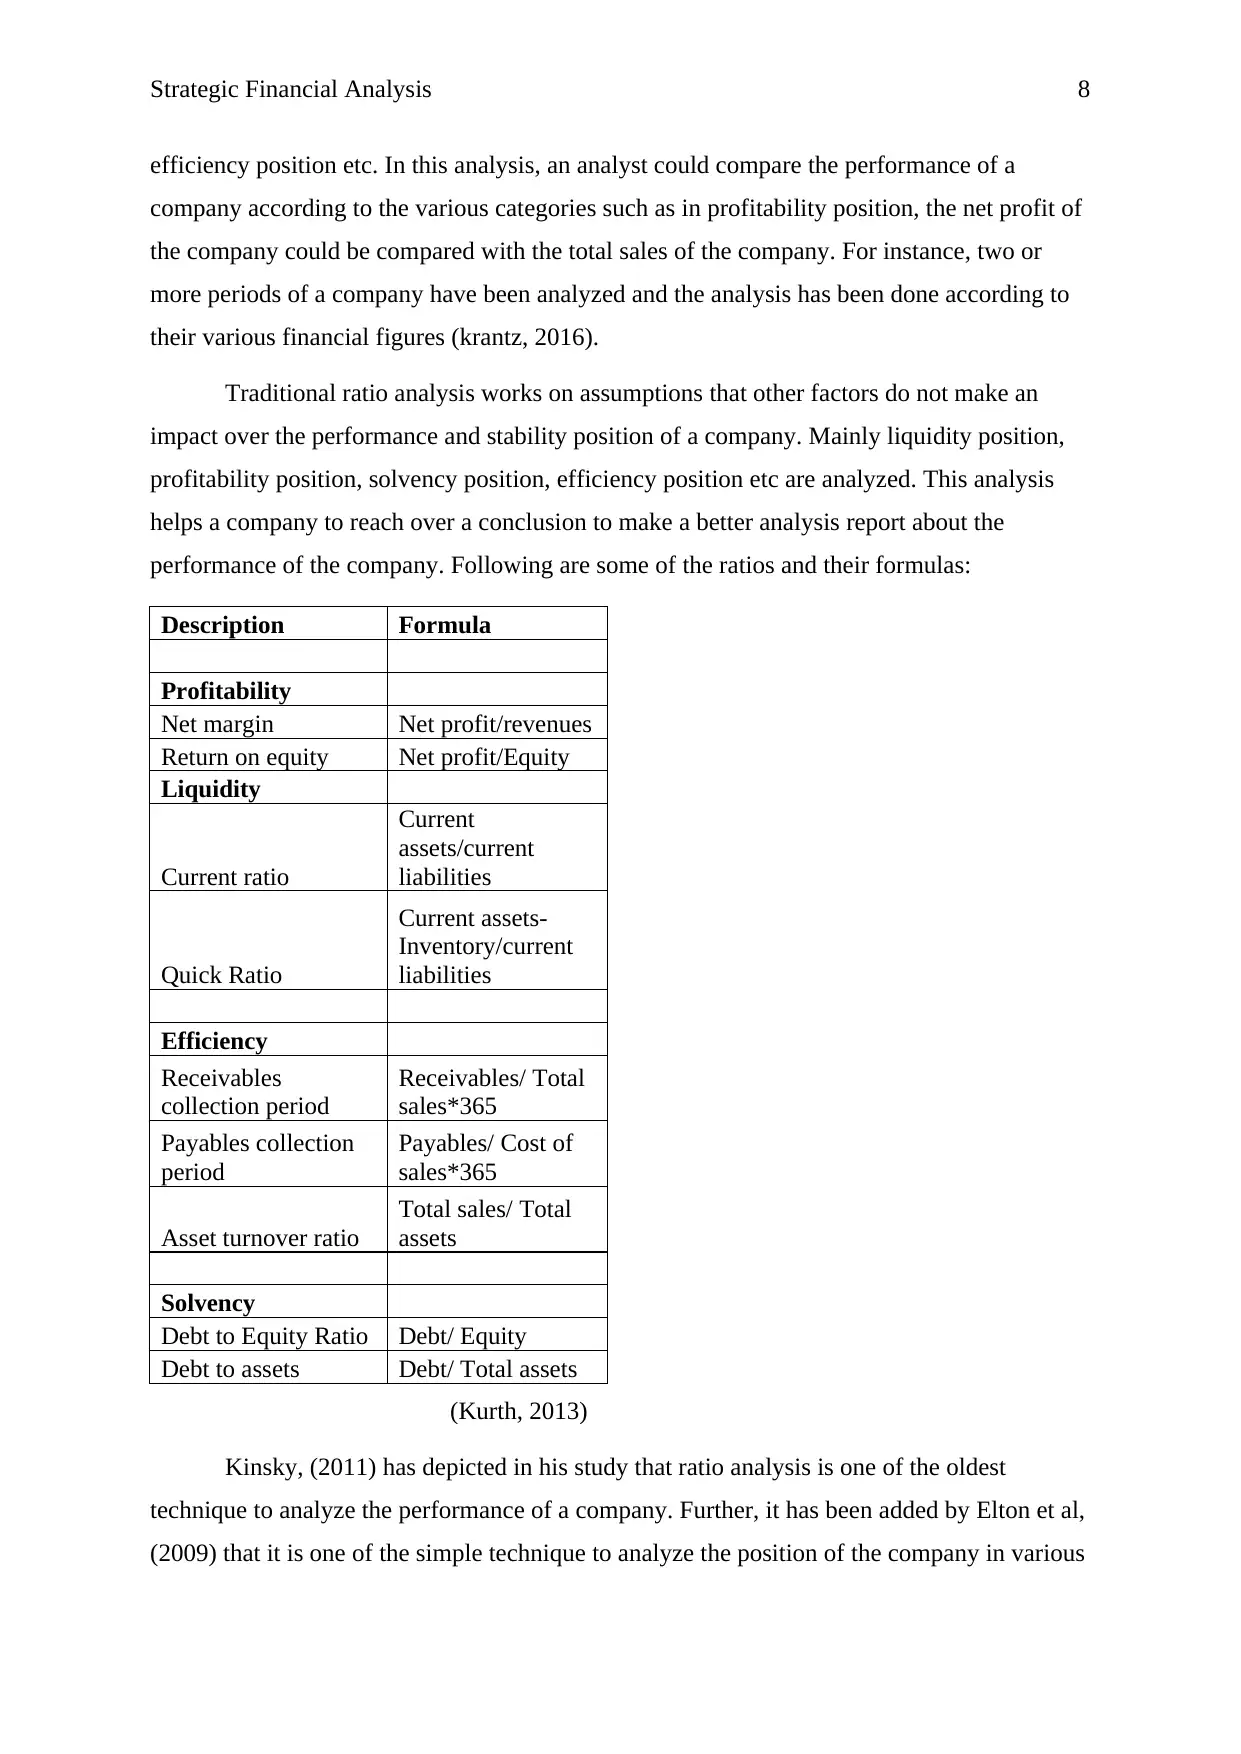
Traditional ratio analysis works on assumptions that other factors do not make an
impact over the performance and stability position of a company. Mainly liquidity position,
profitability position, solvency position, efficiency position etc are analyzed. This analysis
helps a company to reach over a conclusion to make a better analysis report about the
performance of the company. Following are some of the ratios and their formulas:
Description Formula
Profitability
Net margin Net profit/revenues
Return on equity Net profit/Equity
Liquidity
Current ratio
Current
assets/current
liabilities
Quick Ratio
Current assets-
Inventory/current
liabilities
Efficiency
Receivables
collection period
Receivables/ Total
sales*365
Payables collection
period
Payables/ Cost of
sales*365
Asset turnover ratio
Total sales/ Total
assets
Solvency
Debt to Equity Ratio Debt/ Equity
Debt to assets Debt/ Total assets
(Kurth, 2013)
Kinsky, (2011) has depicted in his study that ratio analysis is one of the oldest
technique to analyze the performance of a company. Further, it has been added by Elton et al,
(2009) that it is one of the simple technique to analyze the position of the company in various
efficiency position etc. In this analysis, an analyst could compare the performance of a
company according to the various categories such as in profitability position, the net profit of
the company could be compared with the total sales of the company. For instance, two or
more periods of a company have been analyzed and the analysis has been done according to
their various financial figures (krantz, 2016).
Traditional ratio analysis works on assumptions that other factors do not make an
impact over the performance and stability position of a company. Mainly liquidity position,
profitability position, solvency position, efficiency position etc are analyzed. This analysis
helps a company to reach over a conclusion to make a better analysis report about the
performance of the company. Following are some of the ratios and their formulas:
Description Formula
Profitability
Net margin Net profit/revenues
Return on equity Net profit/Equity
Liquidity
Current ratio
Current
assets/current
liabilities
Quick Ratio
Current assets-
Inventory/current
liabilities
Efficiency
Receivables
collection period
Receivables/ Total
sales*365
Payables collection
period
Payables/ Cost of
sales*365
Asset turnover ratio
Total sales/ Total
assets
Solvency
Debt to Equity Ratio Debt/ Equity
Debt to assets Debt/ Total assets
(Kurth, 2013)
Kinsky, (2011) has depicted in his study that ratio analysis is one of the oldest
technique to analyze the performance of a company. Further, it has been added by Elton et al,
(2009) that it is one of the simple technique to analyze the position of the company in various
Strategic Financial Analysis 9
terms. Baker and Nofsinger, (2010) has briefed that due to this analysis method, it becomes
easy for the investors to analyze the position of the company and make an investment
decision (Ackert and Deaves, 2009). This analysis study helps the analyst and financial
managers to identify the position and reach over a good decision.
Further, it has been found that there are various shortcomings of the ratio analysis.
Higgins, (2012) depicted that this analysis does not take a concern about the historical data.
According to the study of the Glajnaric, (2016), it has been found that the ratio analysis study
do not take a concern about various economical condition such as inflation rate to make a
decision about the performance and changes into the company. Gitman and Zutter, (2012)
adds that it is a complex task to analyze and evaluate the operational changes in the company.
Further, Borio, (2013) depicts that accounting policies of a company also make an impact
over the ratio analysis study. It misleads the result of the financial analysis and thus it
becomes tough for the organization to manage and make a better decision about the
betterment of the company.
Example:
For instance, the study of ratio analysis has also been done over Admiral plc and
Amec plc to analyze the impact of this study over the organization and decision of
management and stakeholders of the company. This study depict that it is easy for the
investors and the analysts to analyze the performance of the company. Further, it has been
analyzed that it becomes important for the organization and the analyst to perform the study
on various basis to make better decision (Glajnaric, 2016). From the study of ratio analysis
over both the companies, it became easy for the stakeholders and the management of the
company to analyze the performance of both the companies and make a better decision about
the performance of the company. Further, it has been found that the comparison study could
also be easier.
Firstly, the study of ratio analysis has been done over Admiral plc to analyze the
changes and the performance of the company in last 5 years. The study has been done over
working capital ratio and return on assets to analyze the changes which has taken place into
the position of the company in last 5 years (Appendix). From the study, it has been found that
the working capital ratio of the company has been 0.7638 in 2015 which was 0.3120 in 2011.
It depict that the current situation of the liquidity of the company is better and it depicts that
⊘ This is a preview!⊘
Do you want full access?
Subscribe today to unlock all pages.
Trusted by 1+ million students worldwide
Strategic Financial Analysis 10
the level of current assets have been enhanced by the company to manage the level of the
working capital.
Further, the study has been done over the ratio “return on assets” to analyze the
performance and the changes of the company. From this study, it has been found that the
return on assets position of the company has been lowered from 2011 in 2015. Currently, the
company is offering 21.53% return which is quite lesser than 33.28% in 2011 (Appendix).
Further, the study has been done over the balance sheet of the company to analyze the
performance of the company and changes in the financial figures of the company in last 5
years. From the study, it has been found that the level of total assets has been enhanced in
2015. Further, the total liabilities and total stakeholder’s equity depict that the various
positive changes have taken place into the financial figures of the company which depict
about the good performance of the company (Appendix). This depict that company is
required to make some changes to enhance the level of return on assets.
Lastly, the study of ratio analysis has been done over Amec plc to analyze the changes
and the performance of the company in last 5 years. The study has been done over working
capital ratio and return on assets to analyze the changes which has taken place into the
position of the company in last 5 years. From the study, it has been found that the working
capital ratio of the company has been 0.8279 in 2015 which was 1.6998 in 2011 (Appendix).
It depict that the current situation of the liquidity of the company is better and it depicts that
the level of current assets have been reduced by the company to manage the level of risk and
cost of the company.
Further, the study has been done over the ratio “return on assets” to analyze the
performance and the changes of the company. From this study, it has been found that the
return on assets position of the company has been lowered from 2011 in 2015. Currently, the
company is offering 97.90% return which is quite lesser than 132.83% in 2011. This depict
that still the position of return on assets of the company is better in market.
Contemporary methods of financial analysis:
Capital asset pricing model:
Capital asset pricing model is the modern technology to identify and analyze the
financial condition of a company. According to this study, it has been found that this model
assist the investors to analyze the total return which is required while investing into the
Paraphrase This Document
Need a fresh take? Get an instant paraphrase of this document with our AI Paraphraser
Strategic Financial Analysis 11
company. This technology mainly focuses over the risk factor and the return factor. This
model depict that the return from an investment must be equal or more than the cost of capital
of the company than only it would be profitable for the company (Zabarankin, Pavlikov and
Uryasev, 2014). Investors could take the help of capital asset pricing method in evaluating
and analyzing the attractiveness of the projected investments. This method is mainly used by
the investors to make a well diversified portfolio so that the risk and return of the financial
securities could be maintained.
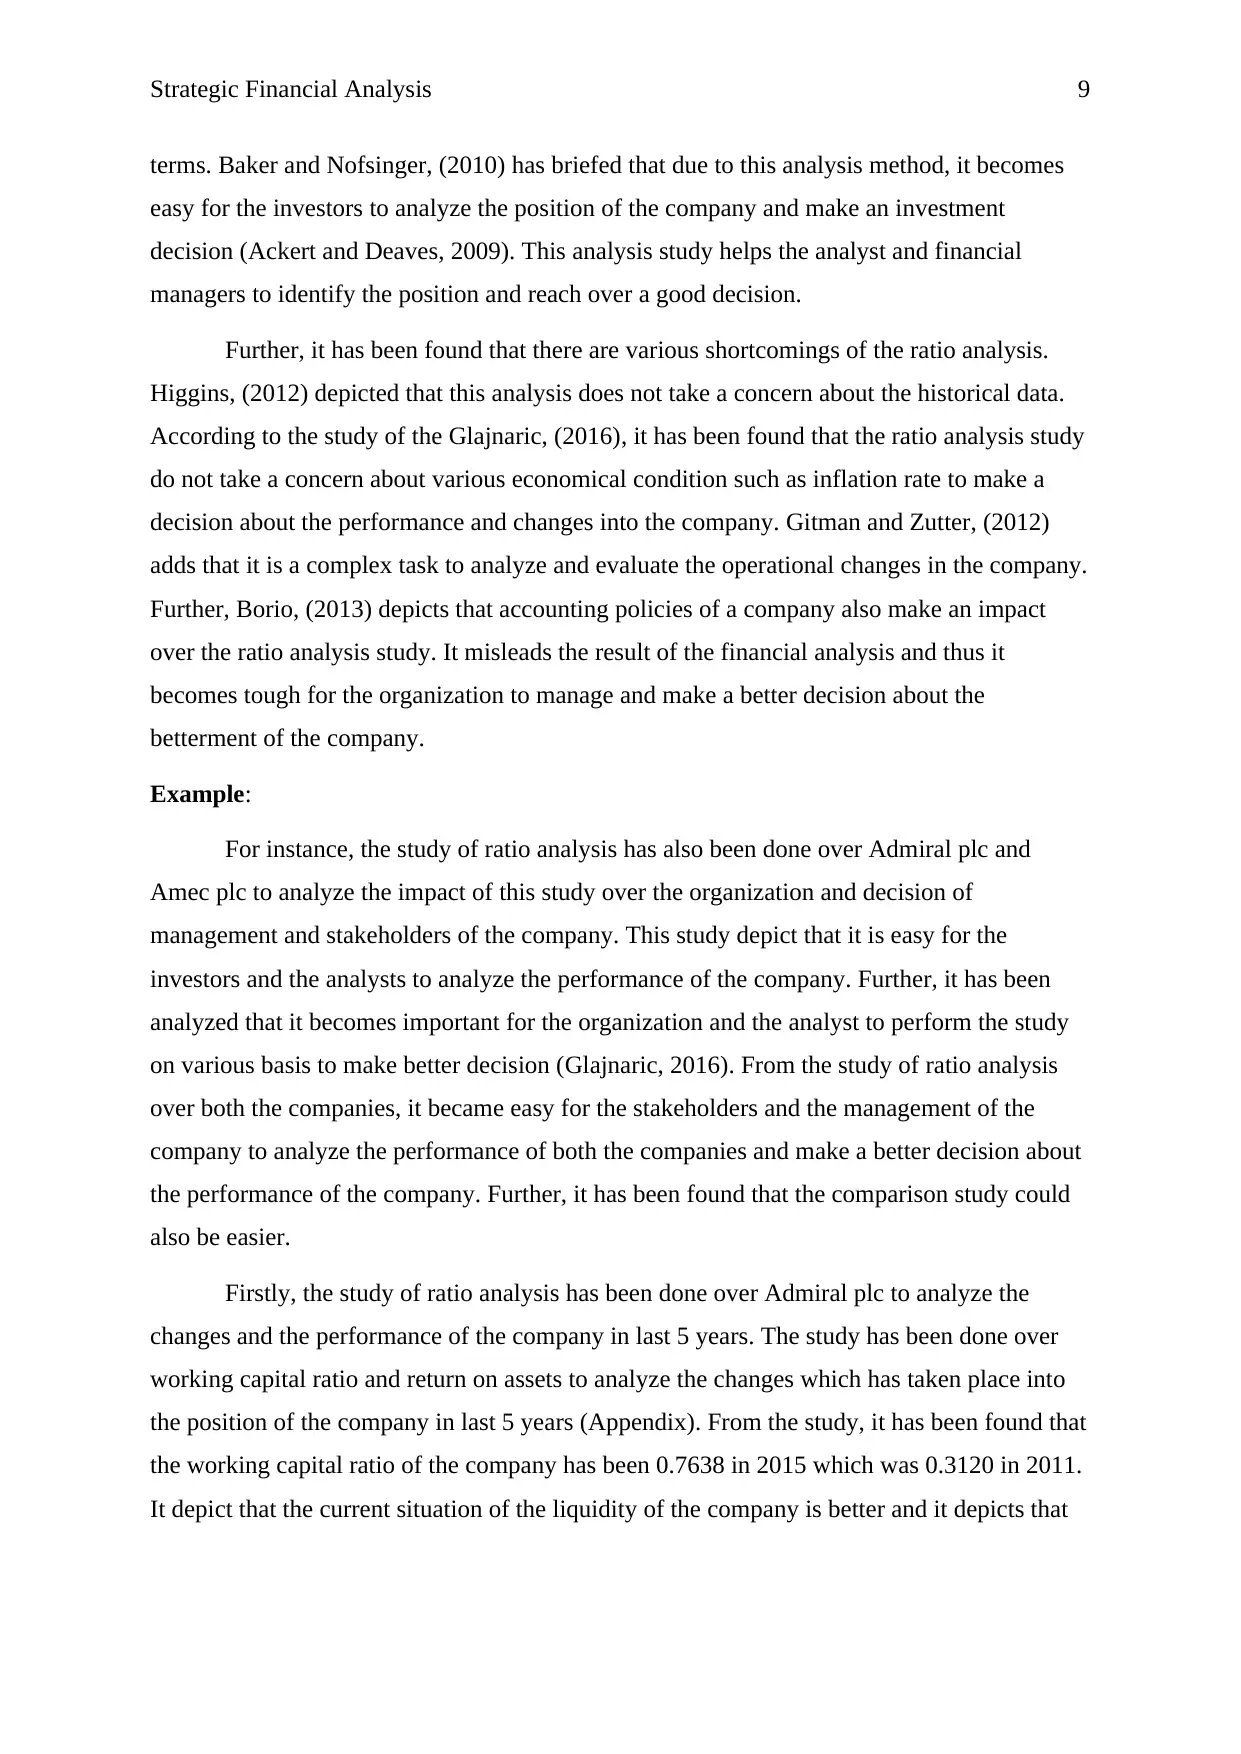
(Tsanakas and Millossovich, 2016)
The above is the formula of the capital asset pricing method which evaluates about the
total expected return from the securities. This formula depict that for analyzing the expected
return, it is required for the investor to analyze the risk free rate of the country, market return
of the industry, consumption beta etc.
Tian & Jiang, (2015) has depicted in his study that capital asset pricing method is one
of the best technique to analyze the performance of the stock of a company. Further, it has
been added by Seitzinger et al, (2010) that this study do not only take the concern of the
internal figures such as ratio analysis do rather it takes a concern of the economy and market
condition and make a better decision on the basis of that. Ross, Westerfield and Jaffe, (2007)
has briefed that this modern analysis has made it very easy for the investors to analyze the
total return which must be expected from a company while investing into the shares and debt
of the company (Reilly and Brown, 2011). This analysis study helps the analyst and financial
managers to identify the position and reach over a good decision.
Further, it has been found that still few changes are required to done in the capital
asset pricing model to make it better. Peterson and Fabozzi, (2002) depicted that the CAPM
model takes a concern of the risk free rate. Risk free rate is the yield over the government
securities which changes on the daily basis. According to the study of the Moles, Parrino and
Kidwekk, (2011), it has been found that the CAPM has built over four assumptions which
also include an unrealistic world picture. Lumby & Jones, (2007) adds that it is a complex
company. This technology mainly focuses over the risk factor and the return factor. This
model depict that the return from an investment must be equal or more than the cost of capital
of the company than only it would be profitable for the company (Zabarankin, Pavlikov and
Uryasev, 2014). Investors could take the help of capital asset pricing method in evaluating
and analyzing the attractiveness of the projected investments. This method is mainly used by
the investors to make a well diversified portfolio so that the risk and return of the financial
securities could be maintained.
(Tsanakas and Millossovich, 2016)
The above is the formula of the capital asset pricing method which evaluates about the
total expected return from the securities. This formula depict that for analyzing the expected
return, it is required for the investor to analyze the risk free rate of the country, market return
of the industry, consumption beta etc.
Tian & Jiang, (2015) has depicted in his study that capital asset pricing method is one
of the best technique to analyze the performance of the stock of a company. Further, it has
been added by Seitzinger et al, (2010) that this study do not only take the concern of the
internal figures such as ratio analysis do rather it takes a concern of the economy and market
condition and make a better decision on the basis of that. Ross, Westerfield and Jaffe, (2007)
has briefed that this modern analysis has made it very easy for the investors to analyze the
total return which must be expected from a company while investing into the shares and debt
of the company (Reilly and Brown, 2011). This analysis study helps the analyst and financial
managers to identify the position and reach over a good decision.
Further, it has been found that still few changes are required to done in the capital
asset pricing model to make it better. Peterson and Fabozzi, (2002) depicted that the CAPM
model takes a concern of the risk free rate. Risk free rate is the yield over the government
securities which changes on the daily basis. According to the study of the Moles, Parrino and
Kidwekk, (2011), it has been found that the CAPM has built over four assumptions which
also include an unrealistic world picture. Lumby & Jones, (2007) adds that it is a complex
Strategic Financial Analysis 12
task to analyze and evaluate the beta of the company. Mainly, this model concerns about a
proxy data and thus the outcome is unrealistic (Lee and Lee, 2006). Thus it becomes tough
for the investors and the analyst to make a better decision about the investment and
divestment from the company. Lastly, it has been found that capital asset pricing model
analysis is a good technique to analyze the changes in the company and thus it becomes easy
for the investors to invest into the company.
Dividend growth model:
Dividend growth model is also known as Gordon growth model. This model is the
modern technology to identify and analyze the financial condition of a company. According
to this study, it has been found that this model assist the investors to analyze the value of the
expected dividends in the future. This technology mainly focuses over the time value of
money (Damodaran, 2011). This model analyzes the current market price and future dividend
of a company and makes a decision about the investment in the company according to that.
Investors could take the help of dividend growth model in evaluating and analyzing the
intrinsic value of a company’s stock. This method is mainly used by the investors to analyze
the worth of a security so that the best decision could be made. Dividend growth model could
be calculated by using the below formula:
Gordon Growth Model: stock price = (dividend payment in the next
period) / (cost of equity - dividend growth rate)
(Bornholt, 2013)
The above is the formula of the dividend growth model which evaluates about the
total worth of a company’s stock. This formula depict that for analyzing the price of a stock
of a company, it is required for the investor to analyze the last dividend payment, current
growth rate of the dividend and equity cost of the company.
Batra and verma (2004) has depicted in his study that dividend growth method is one
of the new and modern technique to analyze the performance and the worth of the stock of a
company. Further, it has been added by Barlow, (2006) that this study evaluates the worth of
the stock price of a company which also takes the concern of the market condition so that the
comparison of the company could be easy with the competitors and industry. Fulin (2011)
has briefed that this modern analysis has made it very easy for the investors to analyze the
total worth of the equity of the company so that the best value could be recognized and the
⊘ This is a preview!⊘
Do you want full access?
Subscribe today to unlock all pages.
Trusted by 1+ million students worldwide
1 out of 29
Related Documents


Your All-in-One AI-Powered Toolkit for Academic Success.
+13062052269
info@desklib.com
Available 24*7 on WhatsApp / Email
![[object Object]](/_next/static/media/star-bottom.7253800d.svg)
Unlock your academic potential
Copyright © 2020–2026 A2Z Services. All Rights Reserved. Developed and managed by ZUCOL.