Tesco vs. Sainsbury: A Financial Ratio Analysis and Company Report
VerifiedAdded on 2022/10/17
|19
|3036
|11
Report
AI Summary
This report undertakes a comparative financial analysis of Tesco and Sainsbury, two prominent players in the retail industry. It begins with an introduction to the companies and the retail sector, followed by an in-depth analysis of their financial ratios, including liquidity, asset management, leverage, and profitability ratios. The analysis spans several years, enabling a comparison of their financial performance. The report identifies operational issues faced by both companies and provides recommendations for improvement. The findings highlight the financial strengths and weaknesses of each company, offering insights into their market positions and potential strategies for growth and addresses recommendations to the company. The report is designed to provide a comprehensive understanding of the financial health and competitive landscape of Tesco and Sainsbury.
Running head: FINANCE
FINANCE
Name of the Student
Name of the University
Author Note
FINANCE
Name of the Student
Name of the University
Author Note
Paraphrase This Document
Need a fresh take? Get an instant paraphrase of this document with our AI Paraphraser
1
FINANCE
Table of Contents
Task 1.........................................................................................................................................2
Introduction............................................................................................................................2
Overview of the Company.....................................................................................................2
Industry of Company..............................................................................................................3
Ratio Analysis of Company...................................................................................................3
Operational Issue in Company...............................................................................................8
Recommendation to Company...............................................................................................8
Assumption............................................................................................................................9
Conclusion............................................................................................................................16
Reference..................................................................................................................................17
2
FINANCE
Task 1
Introduction
Finance is one of the most important part for any organization as the organization can
have a proper finance than only it will can carry its business operation smoothly. The concer
want to expand its business than it should has proper amount of resource which can help it to
expand its business smoothly (Arcand, Berkes and Panizza 2015). Company can manage its
finance by providing focus upon many aspects of the company as its should know about the
debt, equity and financial ratio. Company should able to know where it should able to invest
properly so that it can able to get proper return form the investment. The report is based upon
the different issue which the company is facing in carrying its business activities. This show
the management of company towards its operation and who the management is done by
company in order to get more market from competitor.
Overview of the Company
The report show about two company that are dealing in same industry, the company
are Tesco and Sainsbury. Tesco is a multinational company which is based in United
Kingdom, the concern is having its headquarter in Welwyn Garden City, Hertfordshire. The
company carry its in limited places and it is one of the largest retailer in the world.
Sainsbury is one of largest retailer in world and it is the biggest competitor of Tesco,
the company is based in United Kingdom which is having its headquarter in Holborn,
London, EC1 United Kingdom (About.sainsburys.co.uk 2019). The company can carry its
business operation worldwide and become one of the biggest retailer in its industry.
Industry of Company
The industry which is chosen for the report is retailer industry as both the company is
having departmental store, the report show about the performance of company with its
⊘ This is a preview!⊘
Do you want full access?
Subscribe today to unlock all pages.
Trusted by 1+ million students worldwide
3
FINANCE
competitors so it can know the preformation of company in the market (Baker 2014). It show
various aspects of company financial ratio and help to know about the company performance
more easily and effectively.
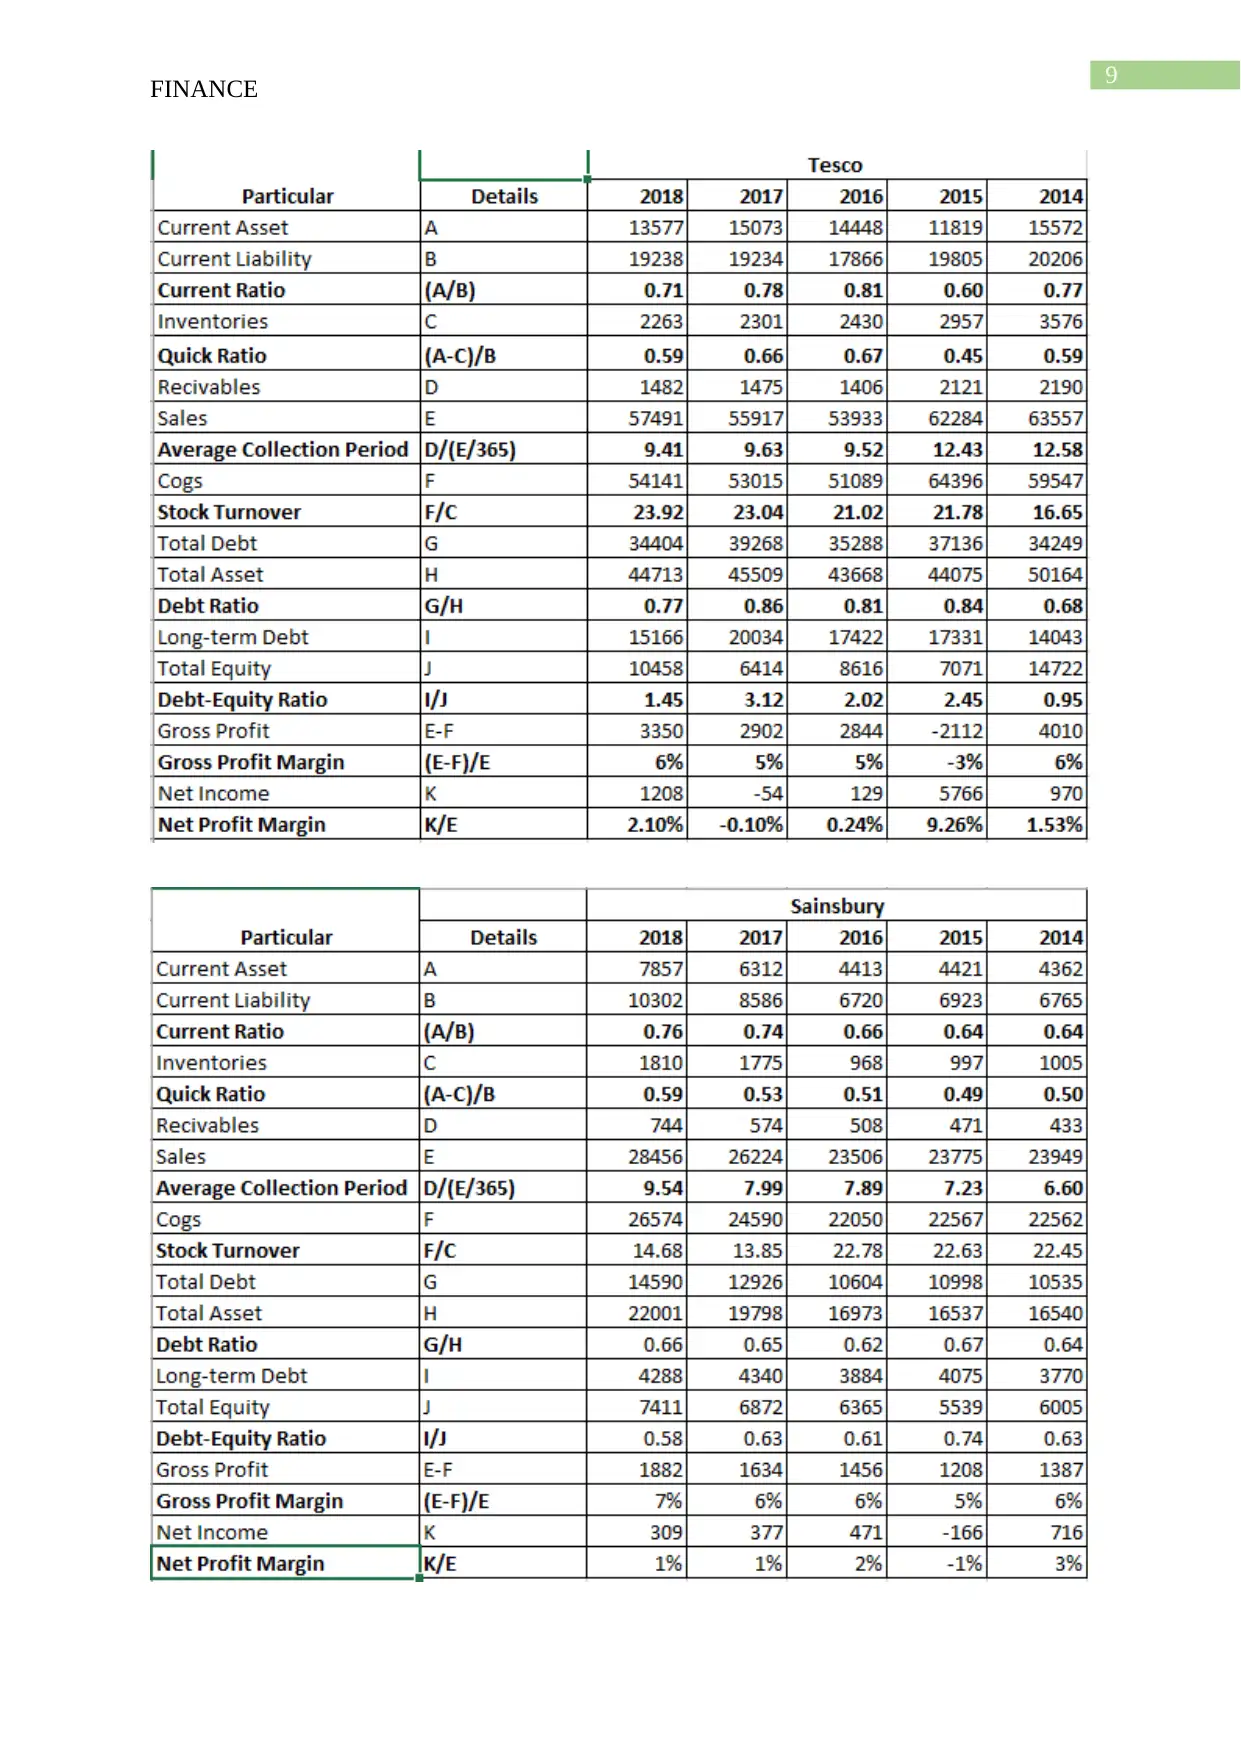
Ratio Analysis of Company
Financial ratio is the process of analysing concern performance on different aspects of
concern financial statement. This show various aspects of concern so the user will able to
know how the concern can perform in the market (Boyas and Teeter 2017). The report show
about the two concern who are competitors of each, so it shows about the various aspects of
concern so that the financial user will able to take proper decision in regards of concern
financial statement. The ratio of concern is explained below:
Liquidity Ratio – It shows about the concern liquidity position as how the concern can pay
its current liability with regards of its current asset of company. It shows how easily the
concern can clear its short term liability by carrying its business activities. The liquidity ratio
can be classified into two parts as Current Ratio and Quick Ratio
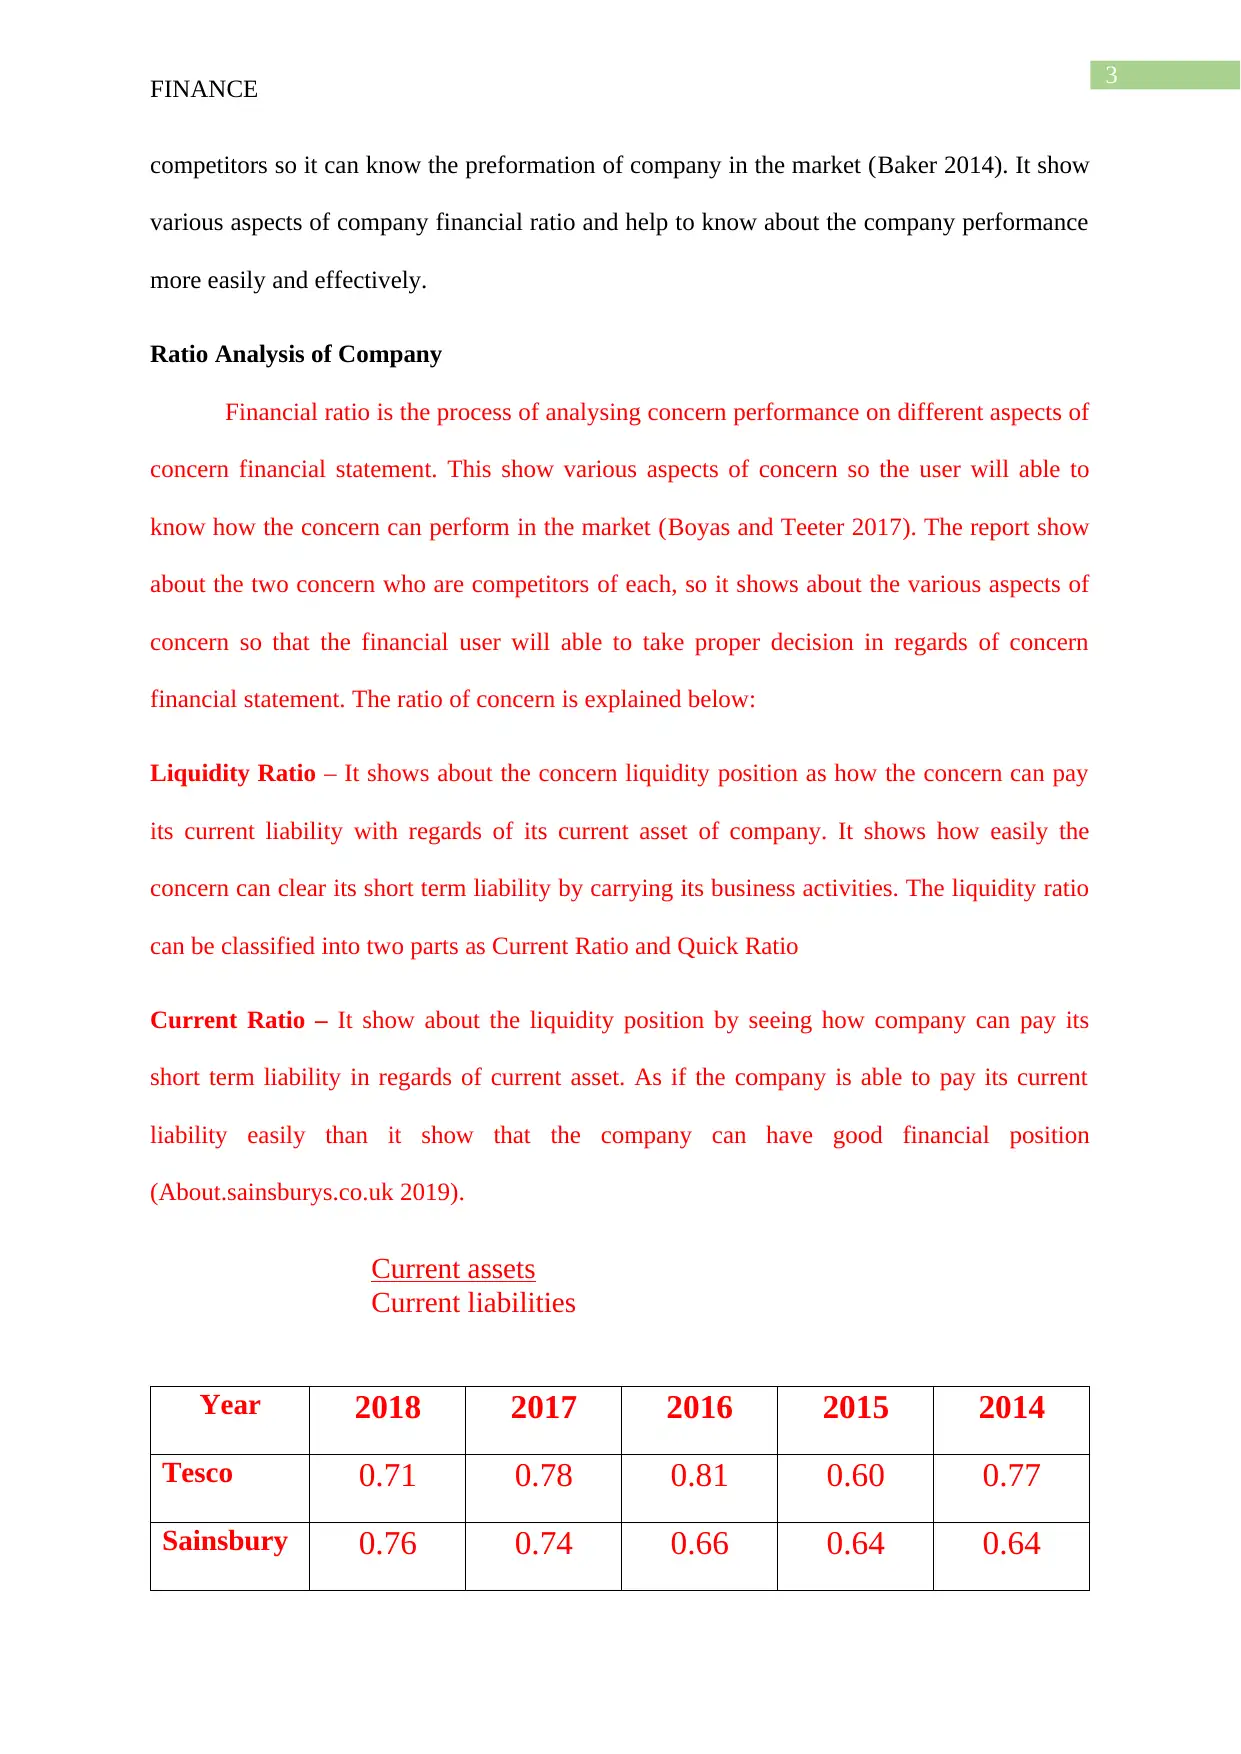
Current Ratio – It show about the liquidity position by seeing how company can pay its
short term liability in regards of current asset. As if the company is able to pay its current
liability easily than it show that the company can have good financial position
(About.sainsburys.co.uk 2019).
Current assets
Current liabilities
Year 2018 2017 2016 2015 2014
Tesco 0.71 0.78 0.81 0.60 0.77
Sainsbury 0.76 0.74 0.66 0.64 0.64
FINANCE
competitors so it can know the preformation of company in the market (Baker 2014). It show
various aspects of company financial ratio and help to know about the company performance
more easily and effectively.
Ratio Analysis of Company
Financial ratio is the process of analysing concern performance on different aspects of
concern financial statement. This show various aspects of concern so the user will able to
know how the concern can perform in the market (Boyas and Teeter 2017). The report show
about the two concern who are competitors of each, so it shows about the various aspects of
concern so that the financial user will able to take proper decision in regards of concern
financial statement. The ratio of concern is explained below:
Liquidity Ratio – It shows about the concern liquidity position as how the concern can pay
its current liability with regards of its current asset of company. It shows how easily the
concern can clear its short term liability by carrying its business activities. The liquidity ratio
can be classified into two parts as Current Ratio and Quick Ratio
Current Ratio – It show about the liquidity position by seeing how company can pay its
short term liability in regards of current asset. As if the company is able to pay its current
liability easily than it show that the company can have good financial position
(About.sainsburys.co.uk 2019).
Current assets
Current liabilities
Year 2018 2017 2016 2015 2014
Tesco 0.71 0.78 0.81 0.60 0.77
Sainsbury 0.76 0.74 0.66 0.64 0.64
Paraphrase This Document
Need a fresh take? Get an instant paraphrase of this document with our AI Paraphraser
4
FINANCE
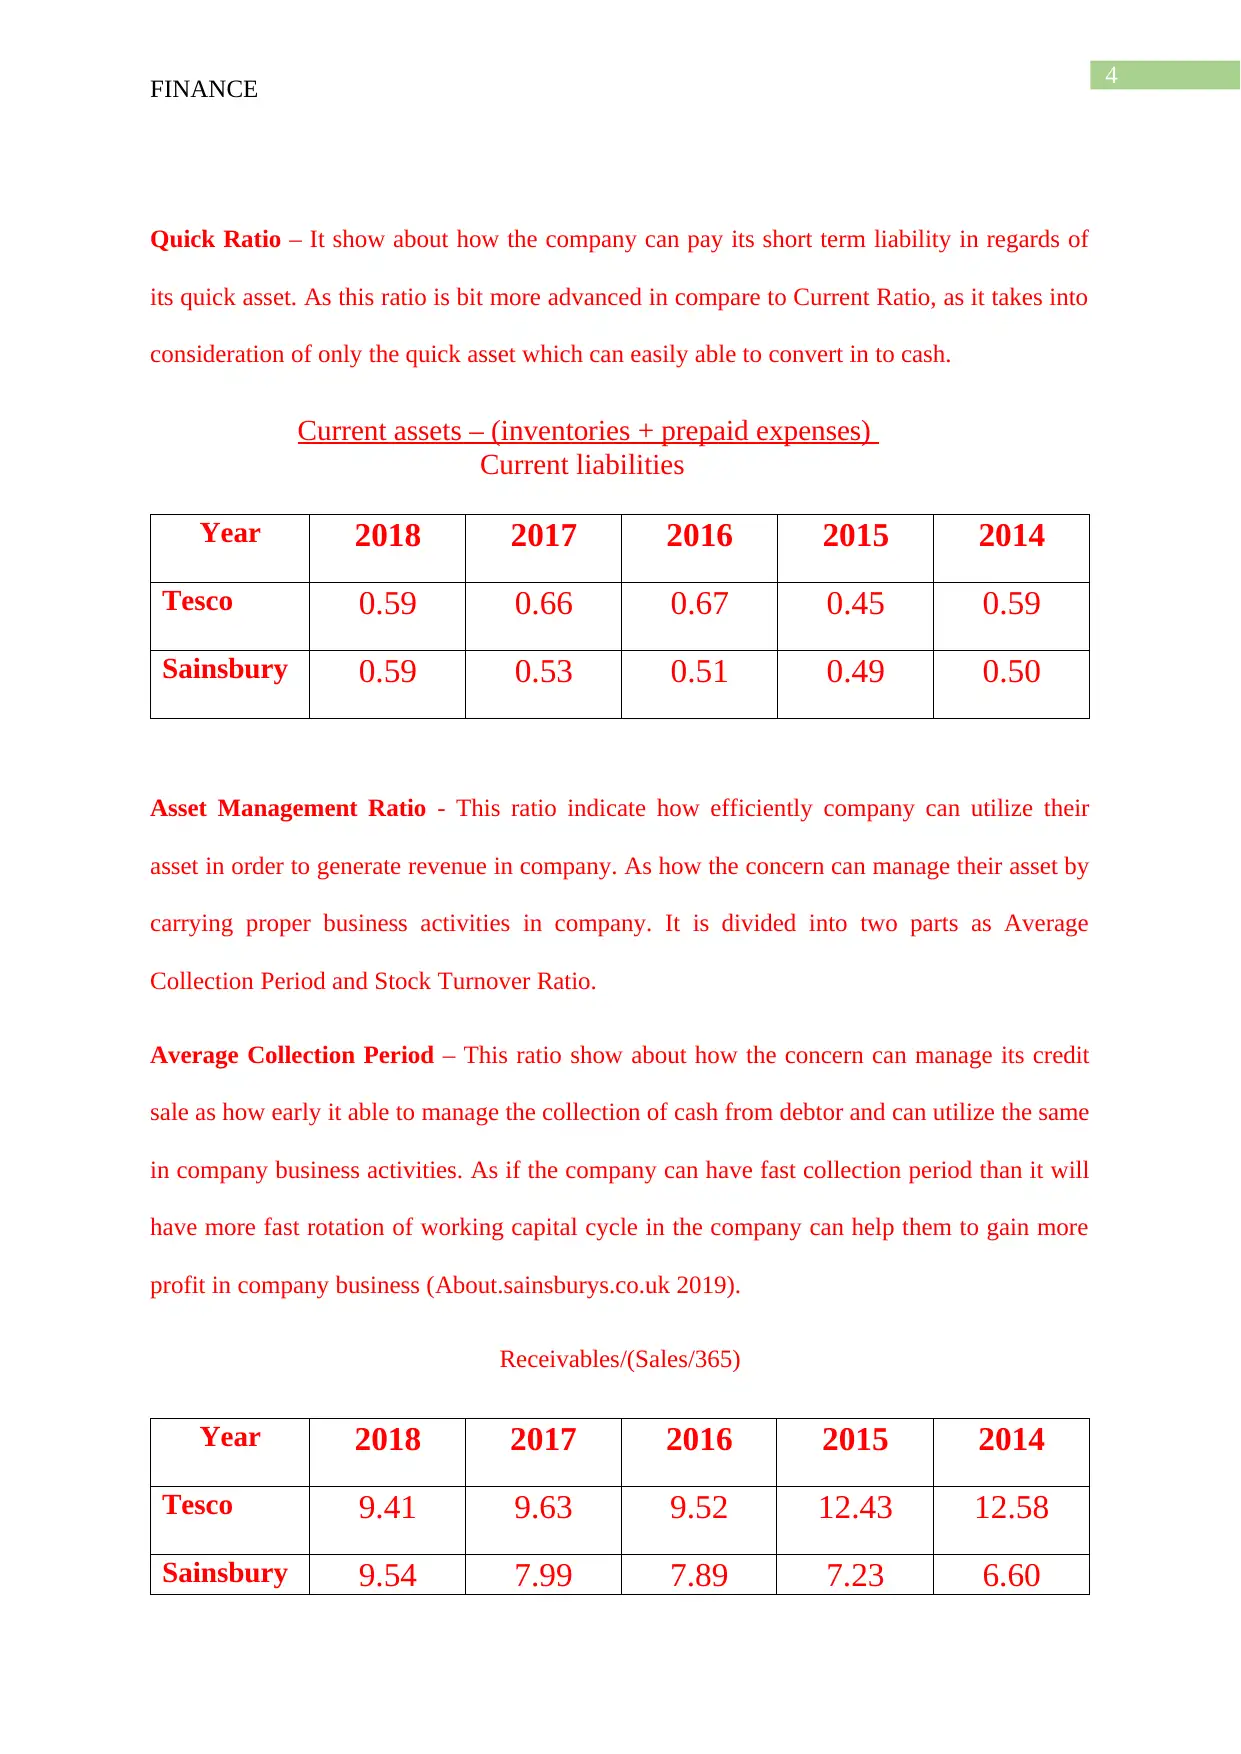
Quick Ratio – It show about how the company can pay its short term liability in regards of
its quick asset. As this ratio is bit more advanced in compare to Current Ratio, as it takes into
consideration of only the quick asset which can easily able to convert in to cash.
Current assets – (inventories + prepaid expenses)
Current liabilities
Year 2018 2017 2016 2015 2014
Tesco 0.59 0.66 0.67 0.45 0.59
Sainsbury 0.59 0.53 0.51 0.49 0.50
Asset Management Ratio - This ratio indicate how efficiently company can utilize their
asset in order to generate revenue in company. As how the concern can manage their asset by
carrying proper business activities in company. It is divided into two parts as Average
Collection Period and Stock Turnover Ratio.
Average Collection Period – This ratio show about how the concern can manage its credit
sale as how early it able to manage the collection of cash from debtor and can utilize the same
in company business activities. As if the company can have fast collection period than it will
have more fast rotation of working capital cycle in the company can help them to gain more
profit in company business (About.sainsburys.co.uk 2019).
Receivables/(Sales/365)
Year 2018 2017 2016 2015 2014
Tesco 9.41 9.63 9.52 12.43 12.58
Sainsbury 9.54 7.99 7.89 7.23 6.60
FINANCE
Quick Ratio – It show about how the company can pay its short term liability in regards of
its quick asset. As this ratio is bit more advanced in compare to Current Ratio, as it takes into
consideration of only the quick asset which can easily able to convert in to cash.
Current assets – (inventories + prepaid expenses)
Current liabilities
Year 2018 2017 2016 2015 2014
Tesco 0.59 0.66 0.67 0.45 0.59
Sainsbury 0.59 0.53 0.51 0.49 0.50
Asset Management Ratio - This ratio indicate how efficiently company can utilize their
asset in order to generate revenue in company. As how the concern can manage their asset by
carrying proper business activities in company. It is divided into two parts as Average
Collection Period and Stock Turnover Ratio.
Average Collection Period – This ratio show about how the concern can manage its credit
sale as how early it able to manage the collection of cash from debtor and can utilize the same
in company business activities. As if the company can have fast collection period than it will
have more fast rotation of working capital cycle in the company can help them to gain more
profit in company business (About.sainsburys.co.uk 2019).
Receivables/(Sales/365)
Year 2018 2017 2016 2015 2014
Tesco 9.41 9.63 9.52 12.43 12.58
Sainsbury 9.54 7.99 7.89 7.23 6.60
5
FINANCE
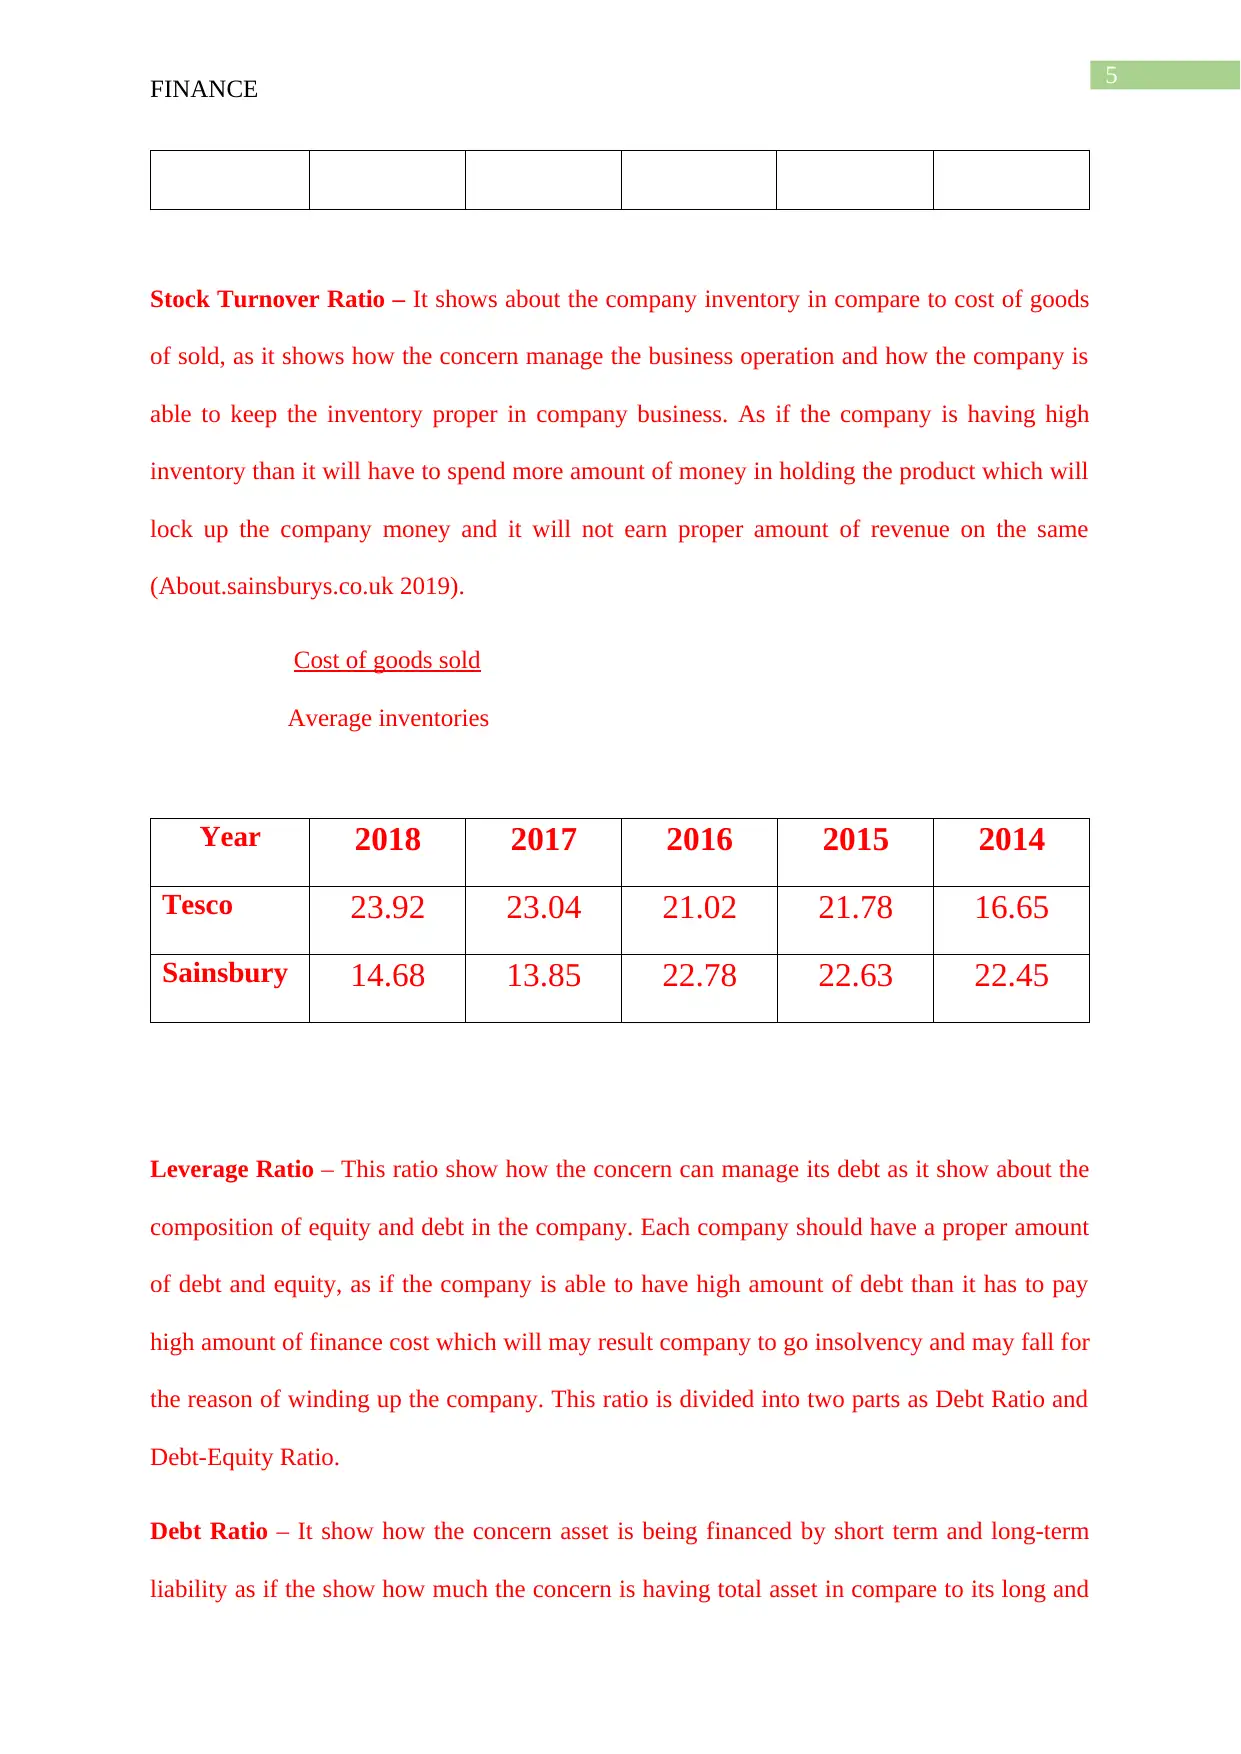
Stock Turnover Ratio – It shows about the company inventory in compare to cost of goods
of sold, as it shows how the concern manage the business operation and how the company is
able to keep the inventory proper in company business. As if the company is having high
inventory than it will have to spend more amount of money in holding the product which will
lock up the company money and it will not earn proper amount of revenue on the same
(About.sainsburys.co.uk 2019).
Cost of goods sold
Average inventories
Year 2018 2017 2016 2015 2014
Tesco 23.92 23.04 21.02 21.78 16.65
Sainsbury 14.68 13.85 22.78 22.63 22.45
Leverage Ratio – This ratio show how the concern can manage its debt as it show about the
composition of equity and debt in the company. Each company should have a proper amount
of debt and equity, as if the company is able to have high amount of debt than it has to pay
high amount of finance cost which will may result company to go insolvency and may fall for
the reason of winding up the company. This ratio is divided into two parts as Debt Ratio and
Debt-Equity Ratio.
Debt Ratio – It show how the concern asset is being financed by short term and long-term
liability as if the show how much the concern is having total asset in compare to its long and
FINANCE
Stock Turnover Ratio – It shows about the company inventory in compare to cost of goods
of sold, as it shows how the concern manage the business operation and how the company is
able to keep the inventory proper in company business. As if the company is having high
inventory than it will have to spend more amount of money in holding the product which will
lock up the company money and it will not earn proper amount of revenue on the same
(About.sainsburys.co.uk 2019).
Cost of goods sold
Average inventories
Year 2018 2017 2016 2015 2014
Tesco 23.92 23.04 21.02 21.78 16.65
Sainsbury 14.68 13.85 22.78 22.63 22.45
Leverage Ratio – This ratio show how the concern can manage its debt as it show about the
composition of equity and debt in the company. Each company should have a proper amount
of debt and equity, as if the company is able to have high amount of debt than it has to pay
high amount of finance cost which will may result company to go insolvency and may fall for
the reason of winding up the company. This ratio is divided into two parts as Debt Ratio and
Debt-Equity Ratio.
Debt Ratio – It show how the concern asset is being financed by short term and long-term
liability as if the show how much the concern is having total asset in compare to its long and
⊘ This is a preview!⊘
Do you want full access?
Subscribe today to unlock all pages.
Trusted by 1+ million students worldwide
6
FINANCE
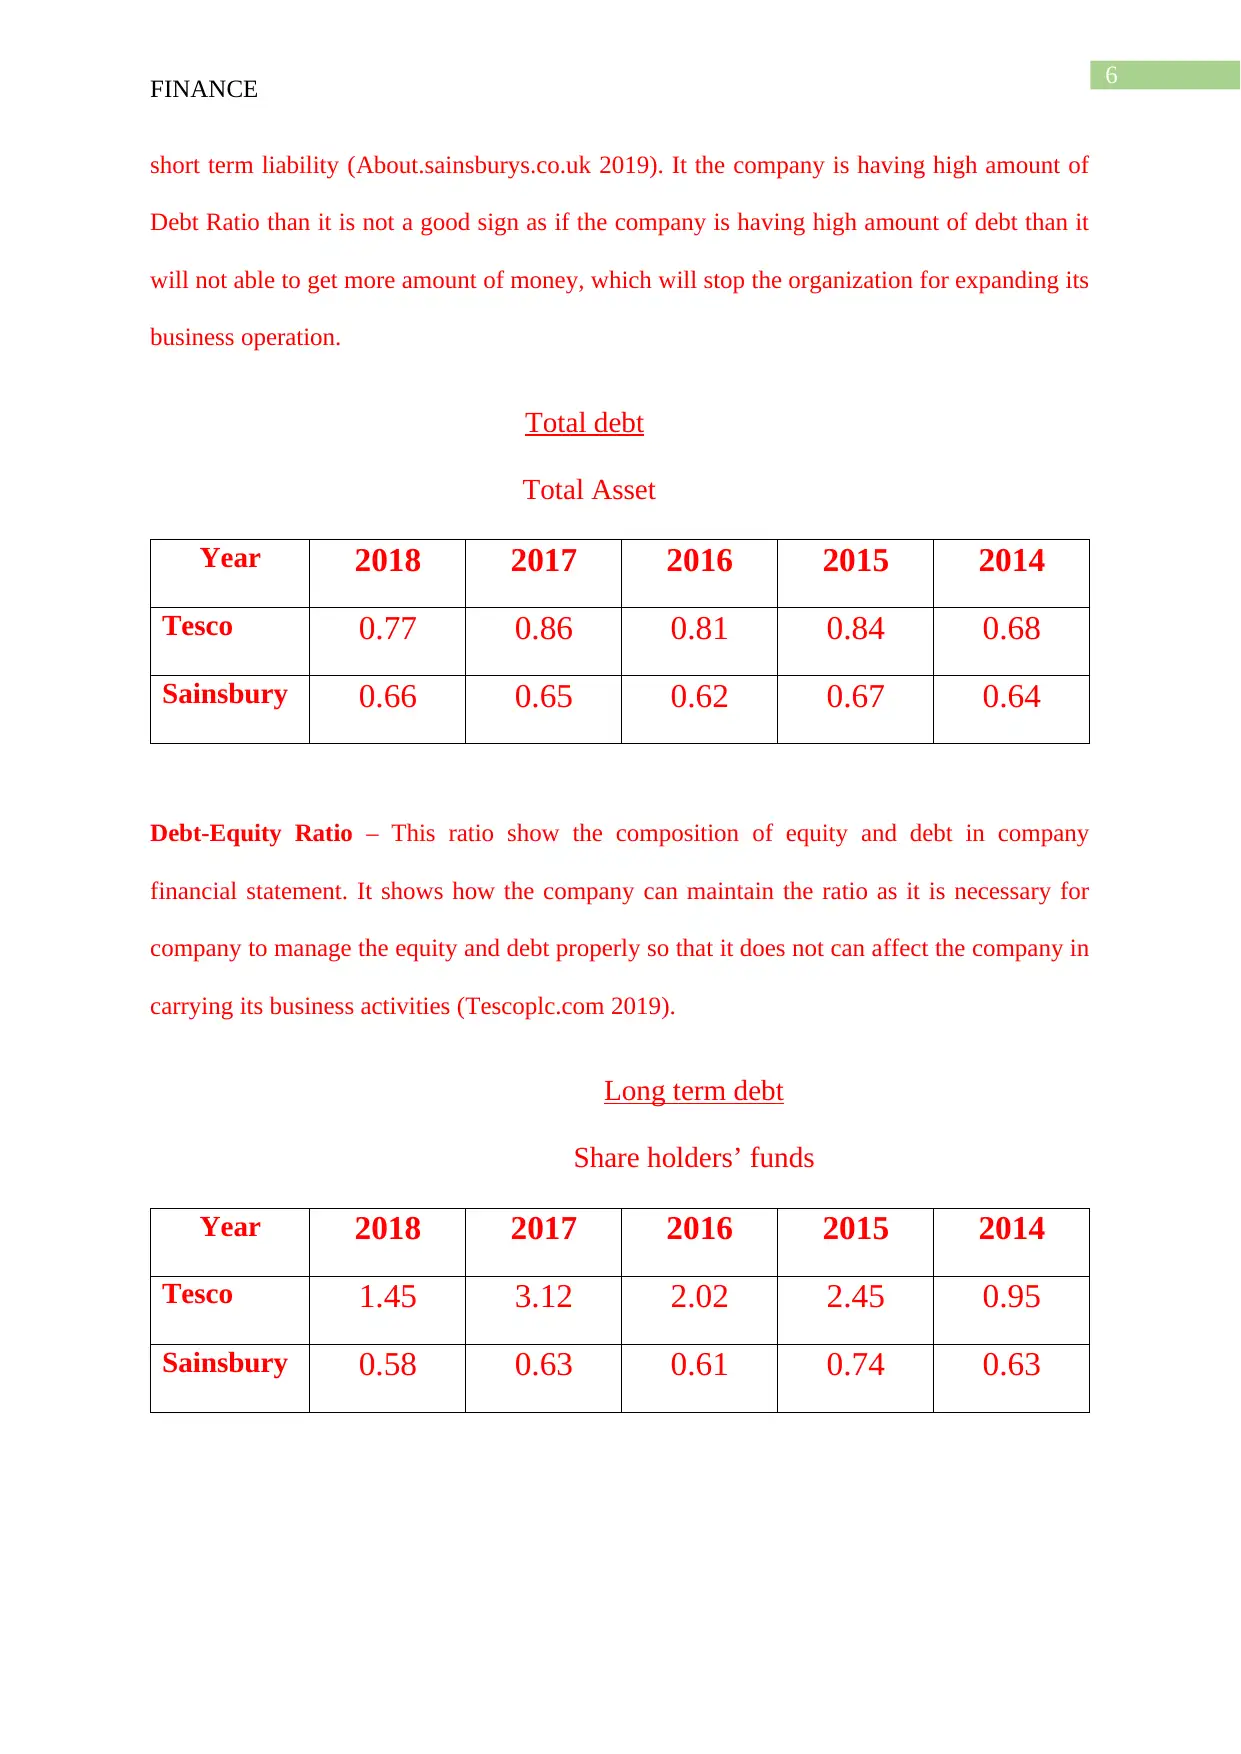
short term liability (About.sainsburys.co.uk 2019). It the company is having high amount of
Debt Ratio than it is not a good sign as if the company is having high amount of debt than it
will not able to get more amount of money, which will stop the organization for expanding its
business operation.
Total debt
Total Asset
Year 2018 2017 2016 2015 2014
Tesco 0.77 0.86 0.81 0.84 0.68
Sainsbury 0.66 0.65 0.62 0.67 0.64
Debt-Equity Ratio – This ratio show the composition of equity and debt in company
financial statement. It shows how the company can maintain the ratio as it is necessary for
company to manage the equity and debt properly so that it does not can affect the company in
carrying its business activities (Tescoplc.com 2019).
Long term debt
Share holders’ funds
Year 2018 2017 2016 2015 2014
Tesco 1.45 3.12 2.02 2.45 0.95
Sainsbury 0.58 0.63 0.61 0.74 0.63
FINANCE
short term liability (About.sainsburys.co.uk 2019). It the company is having high amount of
Debt Ratio than it is not a good sign as if the company is having high amount of debt than it
will not able to get more amount of money, which will stop the organization for expanding its
business operation.
Total debt
Total Asset
Year 2018 2017 2016 2015 2014
Tesco 0.77 0.86 0.81 0.84 0.68
Sainsbury 0.66 0.65 0.62 0.67 0.64
Debt-Equity Ratio – This ratio show the composition of equity and debt in company
financial statement. It shows how the company can maintain the ratio as it is necessary for
company to manage the equity and debt properly so that it does not can affect the company in
carrying its business activities (Tescoplc.com 2019).
Long term debt
Share holders’ funds
Year 2018 2017 2016 2015 2014
Tesco 1.45 3.12 2.02 2.45 0.95
Sainsbury 0.58 0.63 0.61 0.74 0.63
Paraphrase This Document
Need a fresh take? Get an instant paraphrase of this document with our AI Paraphraser
7
FINANCE
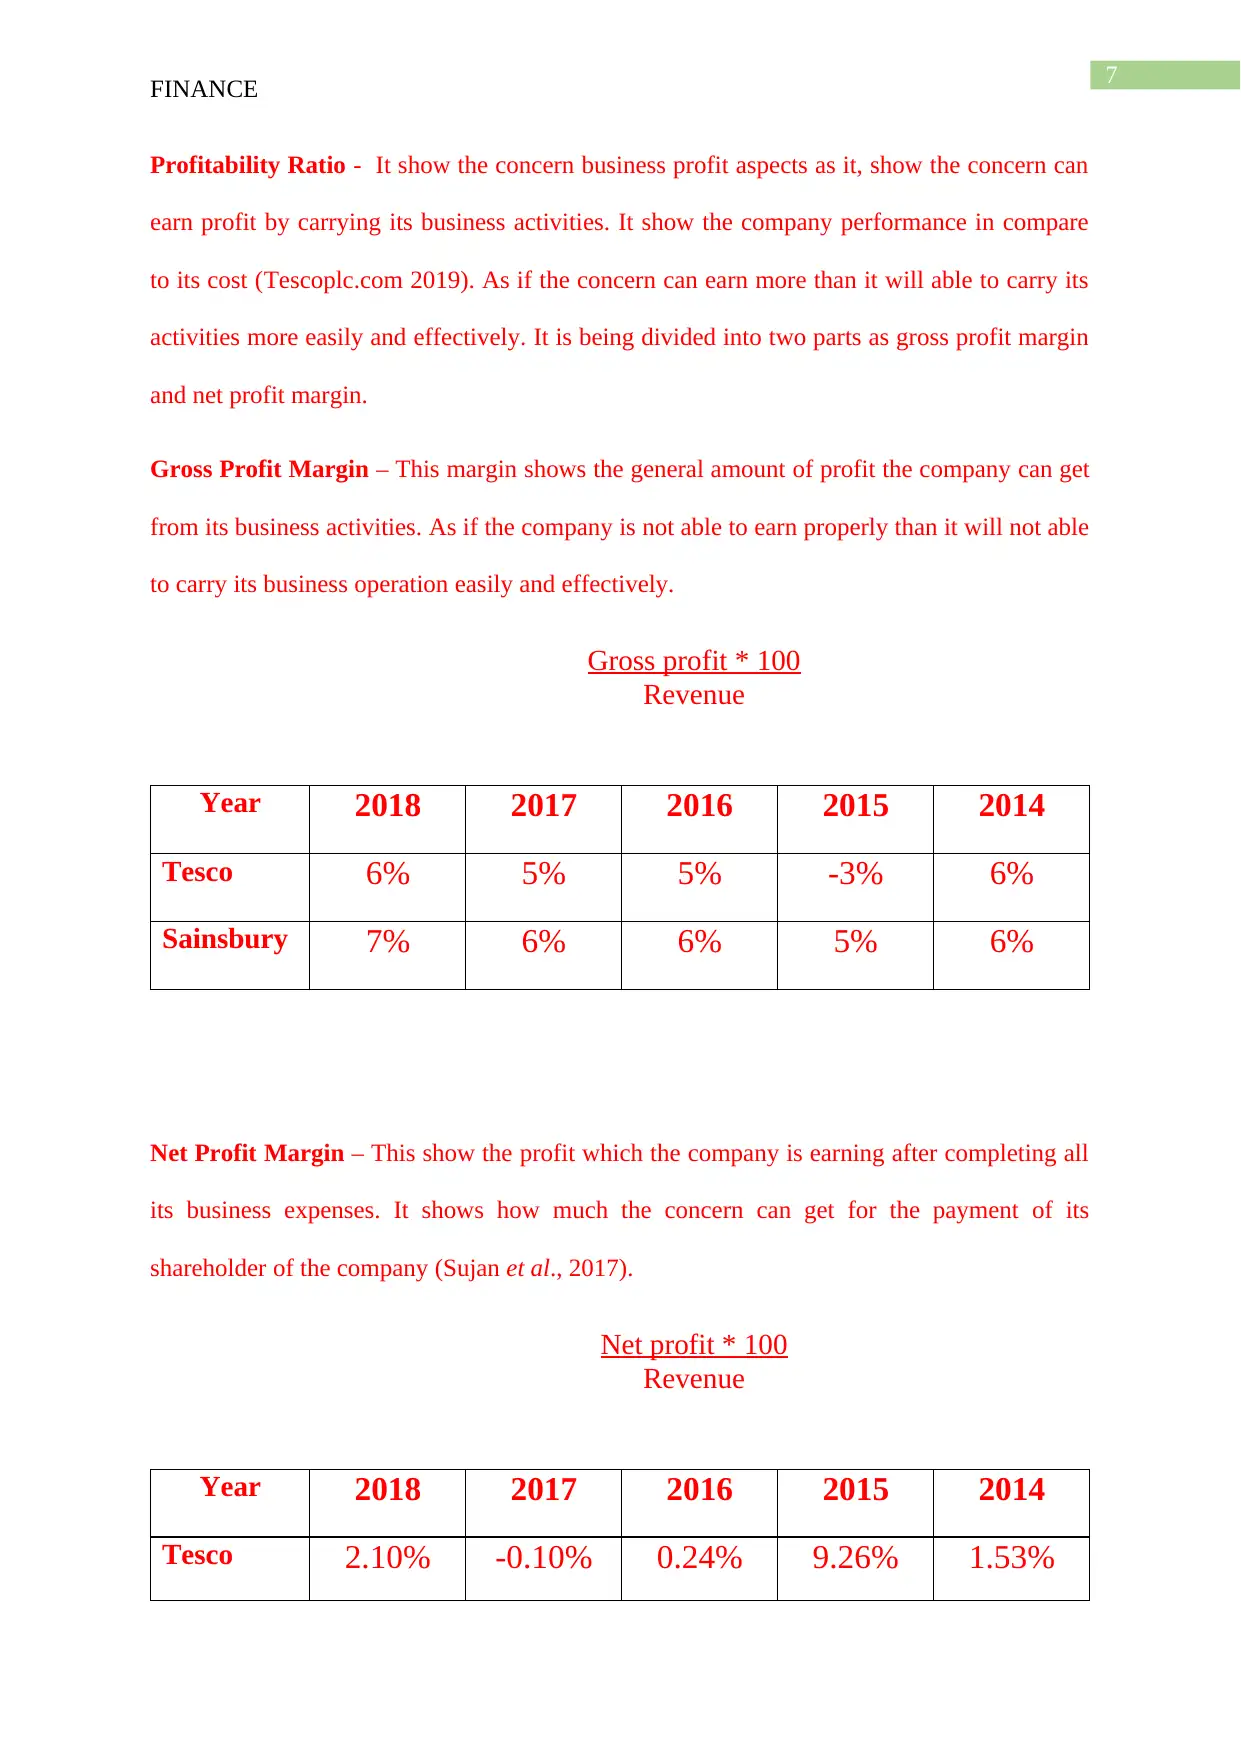
Profitability Ratio - It show the concern business profit aspects as it, show the concern can
earn profit by carrying its business activities. It show the company performance in compare
to its cost (Tescoplc.com 2019). As if the concern can earn more than it will able to carry its
activities more easily and effectively. It is being divided into two parts as gross profit margin
and net profit margin.
Gross Profit Margin – This margin shows the general amount of profit the company can get
from its business activities. As if the company is not able to earn properly than it will not able
to carry its business operation easily and effectively.
Gross profit * 100
Revenue
Year 2018 2017 2016 2015 2014
Tesco 6% 5% 5% -3% 6%
Sainsbury 7% 6% 6% 5% 6%
Net Profit Margin – This show the profit which the company is earning after completing all
its business expenses. It shows how much the concern can get for the payment of its
shareholder of the company (Sujan et al., 2017).
Net profit * 100
Revenue
Year 2018 2017 2016 2015 2014
Tesco 2.10% -0.10% 0.24% 9.26% 1.53%
FINANCE
Profitability Ratio - It show the concern business profit aspects as it, show the concern can
earn profit by carrying its business activities. It show the company performance in compare
to its cost (Tescoplc.com 2019). As if the concern can earn more than it will able to carry its
activities more easily and effectively. It is being divided into two parts as gross profit margin
and net profit margin.
Gross Profit Margin – This margin shows the general amount of profit the company can get
from its business activities. As if the company is not able to earn properly than it will not able
to carry its business operation easily and effectively.
Gross profit * 100
Revenue
Year 2018 2017 2016 2015 2014
Tesco 6% 5% 5% -3% 6%
Sainsbury 7% 6% 6% 5% 6%
Net Profit Margin – This show the profit which the company is earning after completing all
its business expenses. It shows how much the concern can get for the payment of its
shareholder of the company (Sujan et al., 2017).
Net profit * 100
Revenue
Year 2018 2017 2016 2015 2014
Tesco 2.10% -0.10% 0.24% 9.26% 1.53%
8
FINANCE
Sainsbury 1% 1% 2% -1% 3%
Operational Issue in Company
As from above ratio analysis it show that the concern is can gain a proper market so to
have more amount of market it should able to make some changes in its process. The issue
which the company is facing is that it does can manage the resources properly in business
which result in loss in company revenue (Brooks 2019). As per Tesco is concern as the
grocery store is highly affected by inflation so it does not can meet up the goals and objective
of company smoothly (About.sainsburys.co.uk 2019).
Recommendation to Company
The concern can change their strategies which can get more business in market. It
should adopt new method of marketing which will help the company to gain more amount of
brand value that will result in increase in revenue of company as a whole (Buchner et al.,
2014). It should make more diversification of resource so that the company can satisfy its
customer and it will also help the concern to carry business operation smoothly.
Assumption
There is no such assumption which is consider while making the report, as the report
show about the company performance which is been gather from the annual report of both
companies and also the only assumption which can be taken that the company is having
similar market as per the financial report is made and the company can perform all its
activities properly and effectively in their industry.
⊘ This is a preview!⊘
Do you want full access?
Subscribe today to unlock all pages.
Trusted by 1+ million students worldwide
9
FINANCE
FINANCE
Paraphrase This Document
Need a fresh take? Get an instant paraphrase of this document with our AI Paraphraser
10
FINANCE
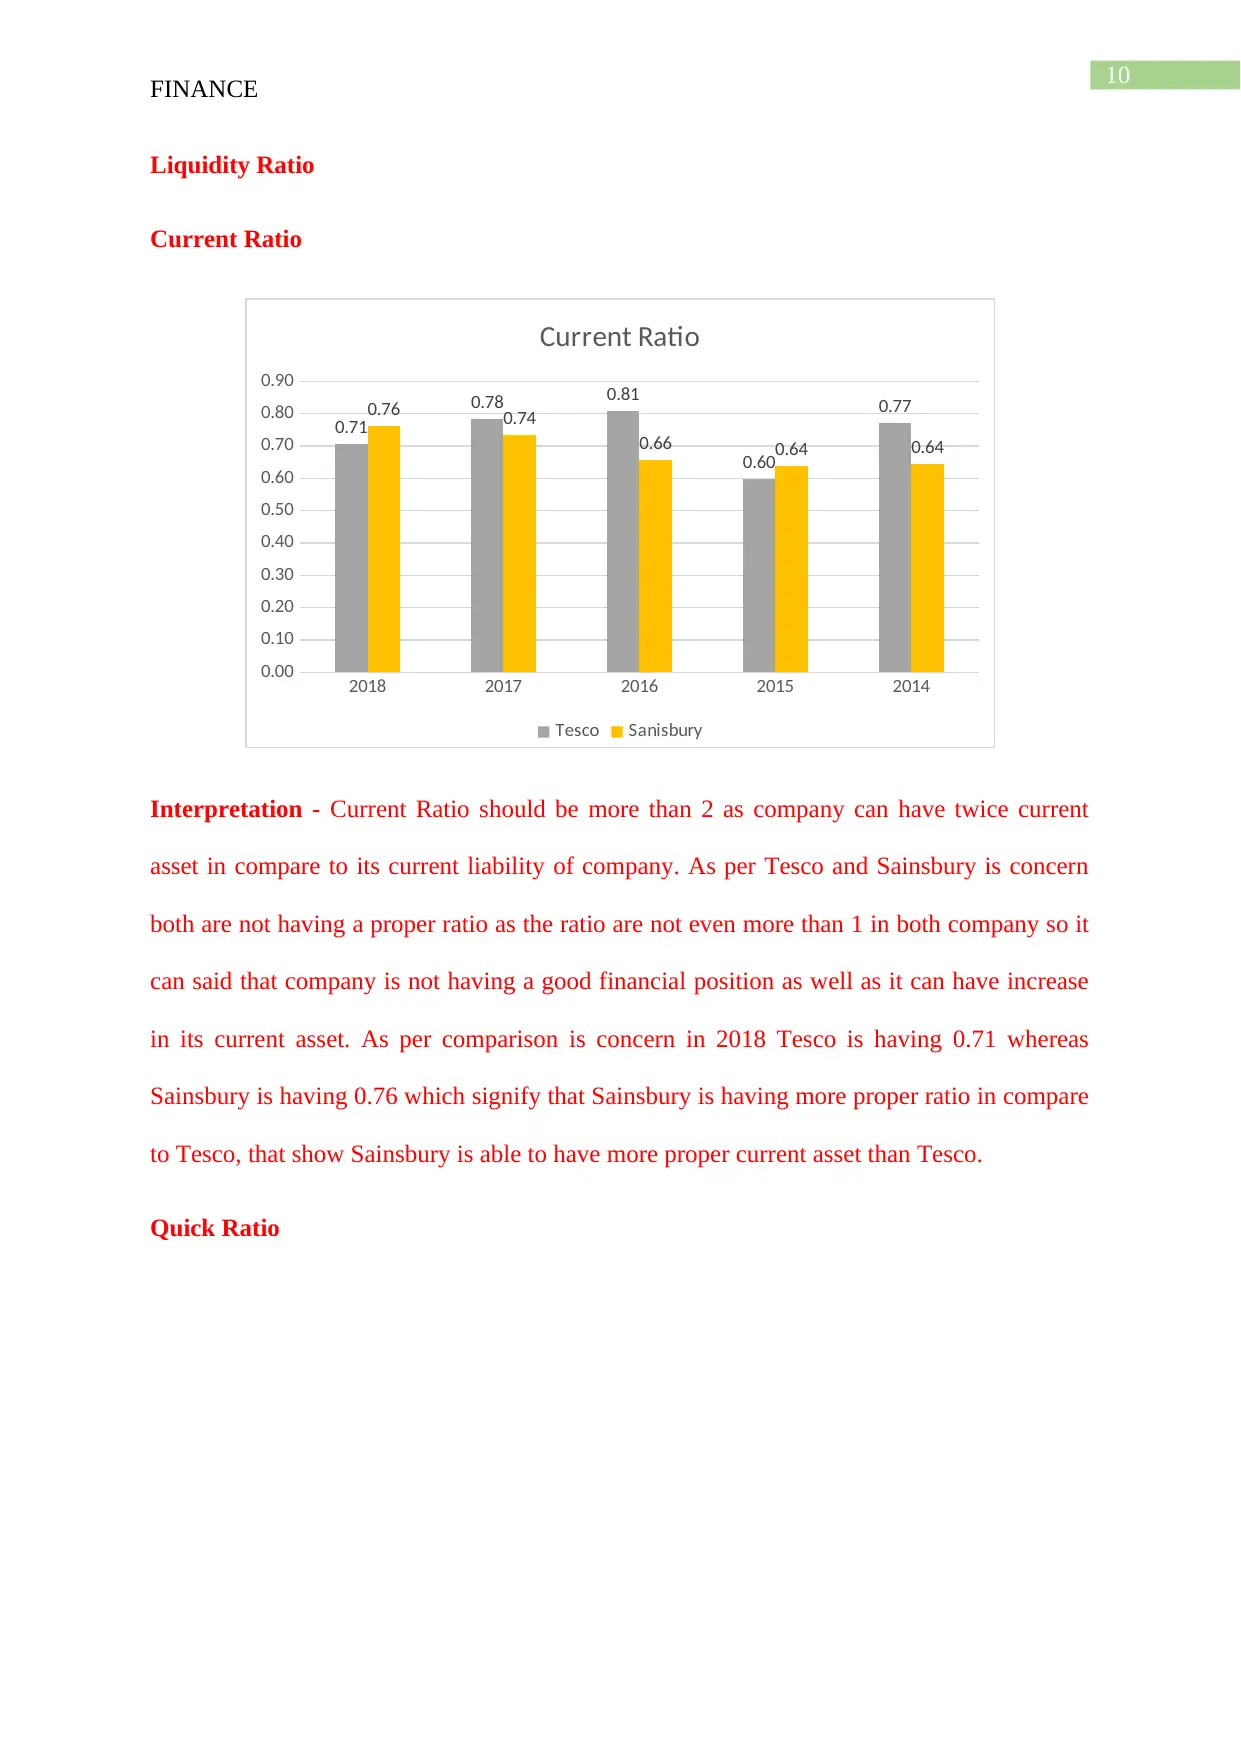
Liquidity Ratio
Current Ratio
2018 2017 2016 2015 2014
0.00
0.10
0.20
0.30
0.40
0.50
0.60
0.70
0.80
0.90
0.71
0.78 0.81
0.60
0.770.76 0.74
0.66 0.64 0.64
Current Ratio
Tesco Sanisbury
Interpretation - Current Ratio should be more than 2 as company can have twice current
asset in compare to its current liability of company. As per Tesco and Sainsbury is concern
both are not having a proper ratio as the ratio are not even more than 1 in both company so it
can said that company is not having a good financial position as well as it can have increase
in its current asset. As per comparison is concern in 2018 Tesco is having 0.71 whereas
Sainsbury is having 0.76 which signify that Sainsbury is having more proper ratio in compare
to Tesco, that show Sainsbury is able to have more proper current asset than Tesco.
Quick Ratio
FINANCE
Liquidity Ratio
Current Ratio
2018 2017 2016 2015 2014
0.00
0.10
0.20
0.30
0.40
0.50
0.60
0.70
0.80
0.90
0.71
0.78 0.81
0.60
0.770.76 0.74
0.66 0.64 0.64
Current Ratio
Tesco Sanisbury
Interpretation - Current Ratio should be more than 2 as company can have twice current
asset in compare to its current liability of company. As per Tesco and Sainsbury is concern
both are not having a proper ratio as the ratio are not even more than 1 in both company so it
can said that company is not having a good financial position as well as it can have increase
in its current asset. As per comparison is concern in 2018 Tesco is having 0.71 whereas
Sainsbury is having 0.76 which signify that Sainsbury is having more proper ratio in compare
to Tesco, that show Sainsbury is able to have more proper current asset than Tesco.
Quick Ratio
11
FINANCE
2018 2017 2016 2015 2014
0.00
0.10
0.20
0.30
0.40
0.50
0.60
0.70
0.80
0.59
0.66 0.67
0.45
0.590.59
0.53 0.51 0.49 0.50
Quick Ratio
Tesco Sanisbury
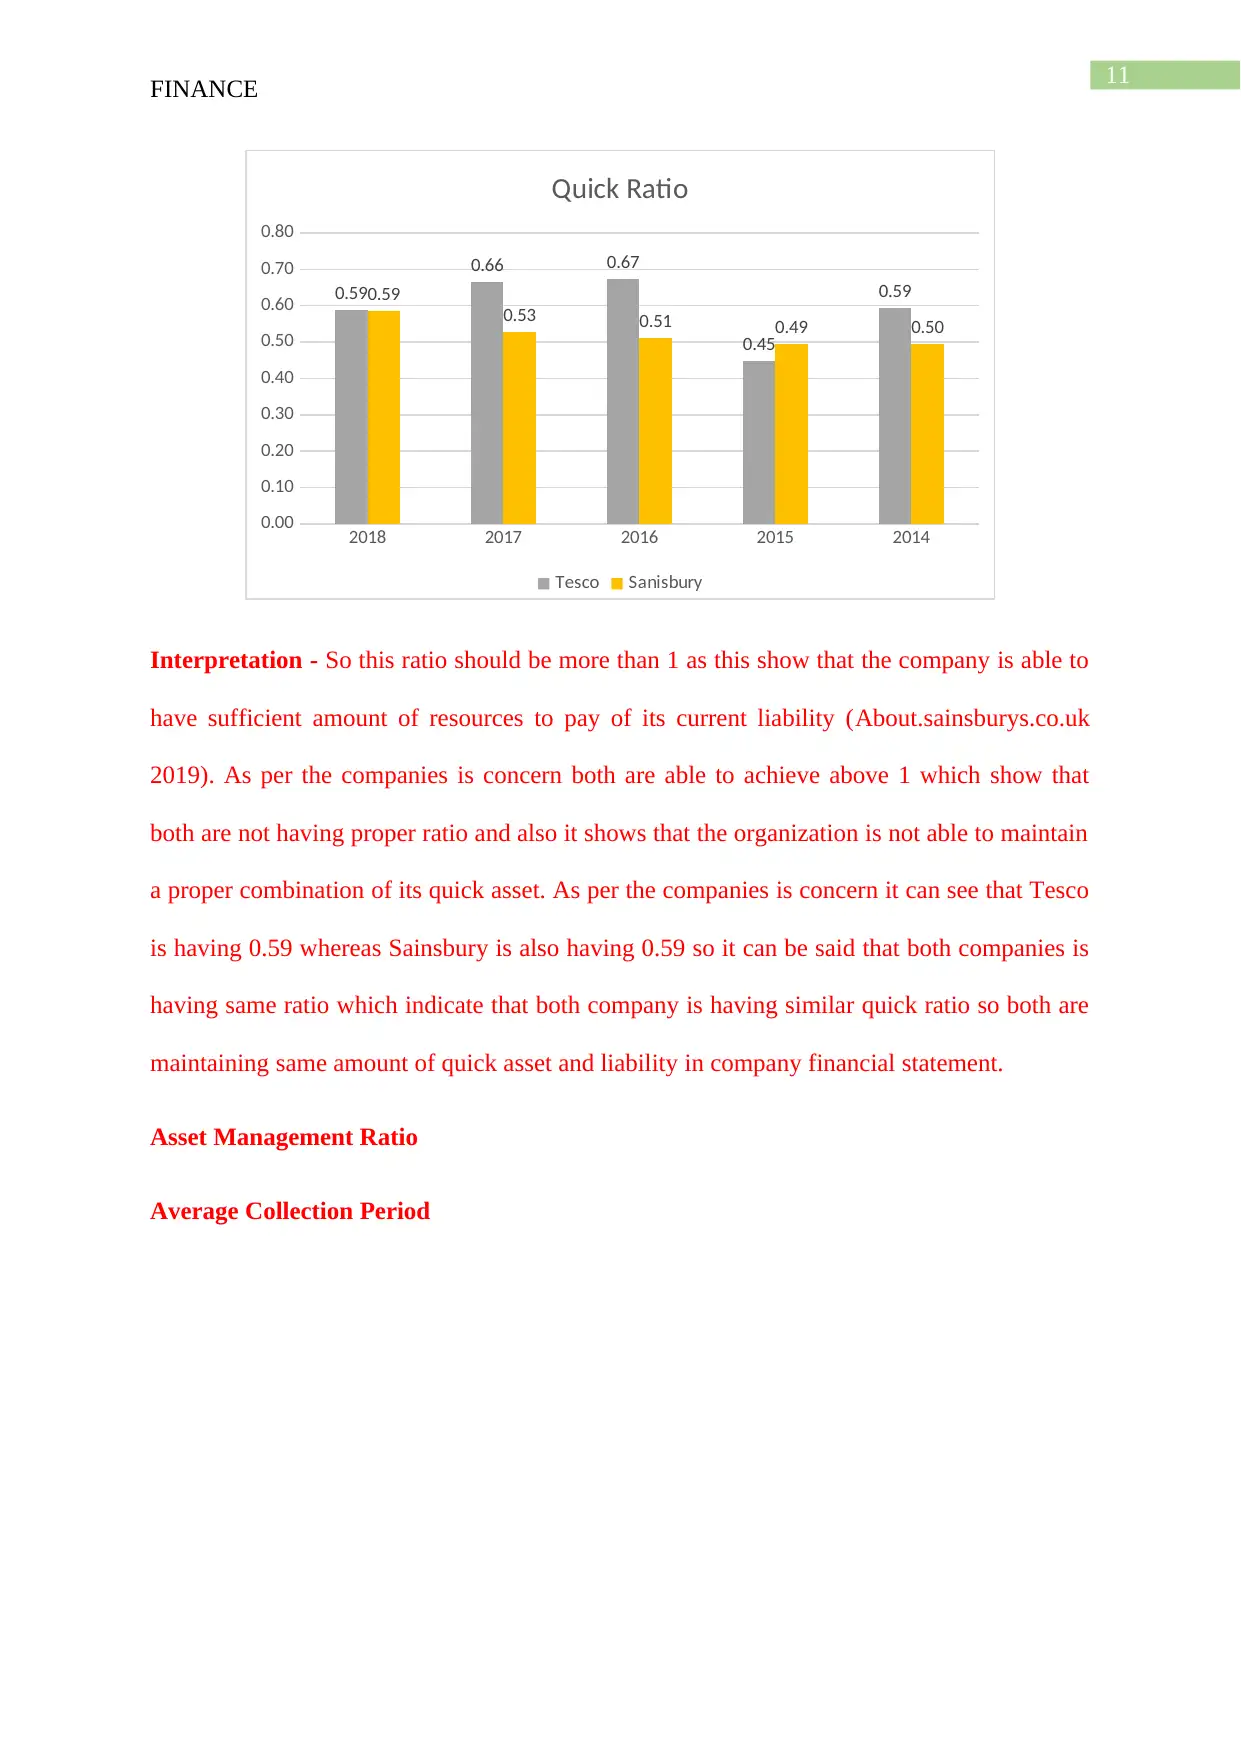
Interpretation - So this ratio should be more than 1 as this show that the company is able to
have sufficient amount of resources to pay of its current liability (About.sainsburys.co.uk
2019). As per the companies is concern both are able to achieve above 1 which show that
both are not having proper ratio and also it shows that the organization is not able to maintain
a proper combination of its quick asset. As per the companies is concern it can see that Tesco
is having 0.59 whereas Sainsbury is also having 0.59 so it can be said that both companies is
having same ratio which indicate that both company is having similar quick ratio so both are
maintaining same amount of quick asset and liability in company financial statement.
Asset Management Ratio
Average Collection Period
FINANCE
2018 2017 2016 2015 2014
0.00
0.10
0.20
0.30
0.40
0.50
0.60
0.70
0.80
0.59
0.66 0.67
0.45
0.590.59
0.53 0.51 0.49 0.50
Quick Ratio
Tesco Sanisbury
Interpretation - So this ratio should be more than 1 as this show that the company is able to
have sufficient amount of resources to pay of its current liability (About.sainsburys.co.uk
2019). As per the companies is concern both are able to achieve above 1 which show that
both are not having proper ratio and also it shows that the organization is not able to maintain
a proper combination of its quick asset. As per the companies is concern it can see that Tesco
is having 0.59 whereas Sainsbury is also having 0.59 so it can be said that both companies is
having same ratio which indicate that both company is having similar quick ratio so both are
maintaining same amount of quick asset and liability in company financial statement.
Asset Management Ratio
Average Collection Period
⊘ This is a preview!⊘
Do you want full access?
Subscribe today to unlock all pages.
Trusted by 1+ million students worldwide
1 out of 19
Related Documents


Your All-in-One AI-Powered Toolkit for Academic Success.
+13062052269
info@desklib.com
Available 24*7 on WhatsApp / Email
![[object Object]](/_next/static/media/star-bottom.7253800d.svg)
Unlock your academic potential
Copyright © 2020–2026 A2Z Services. All Rights Reserved. Developed and managed by ZUCOL.