Business Decision Making Report: Data Analysis for Thomas Cook Tourism

Verified

Added on  2020/01/23

|21
|4285
|425
Report
AI Summary
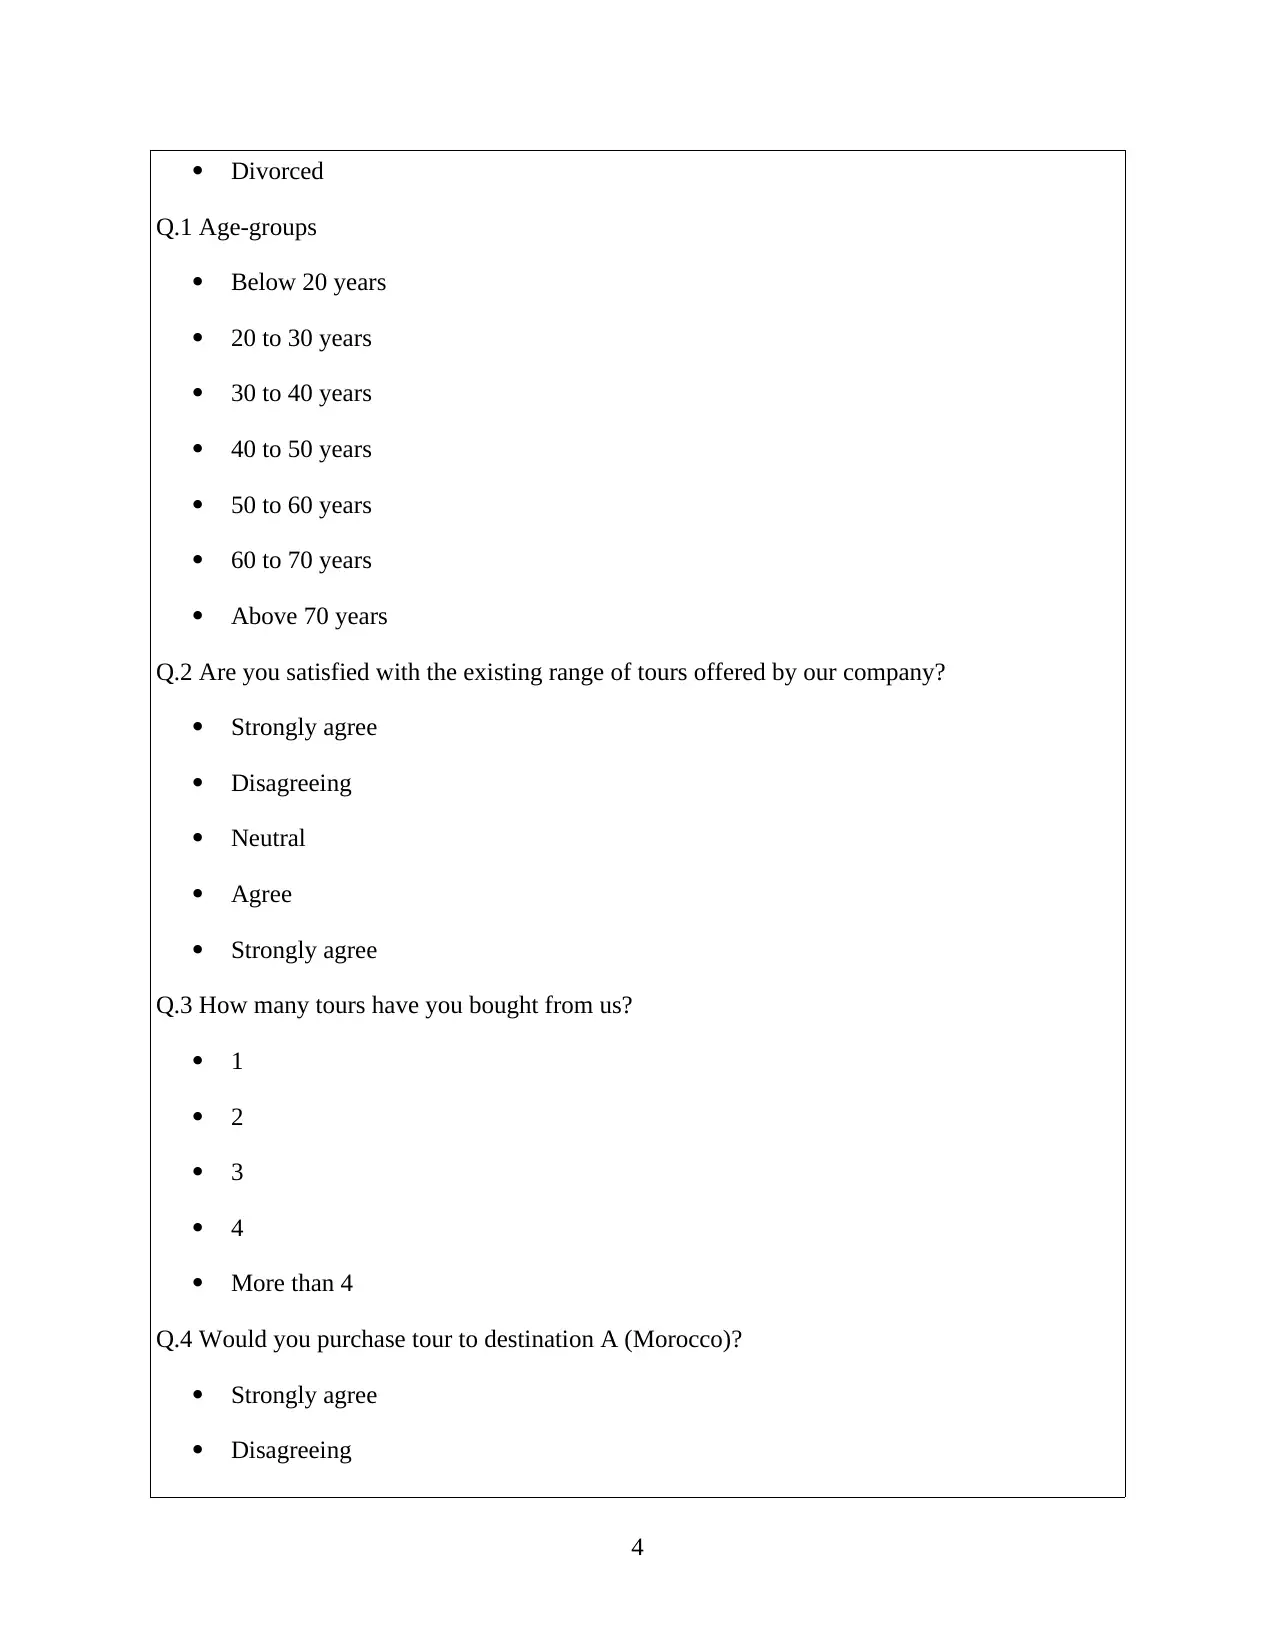
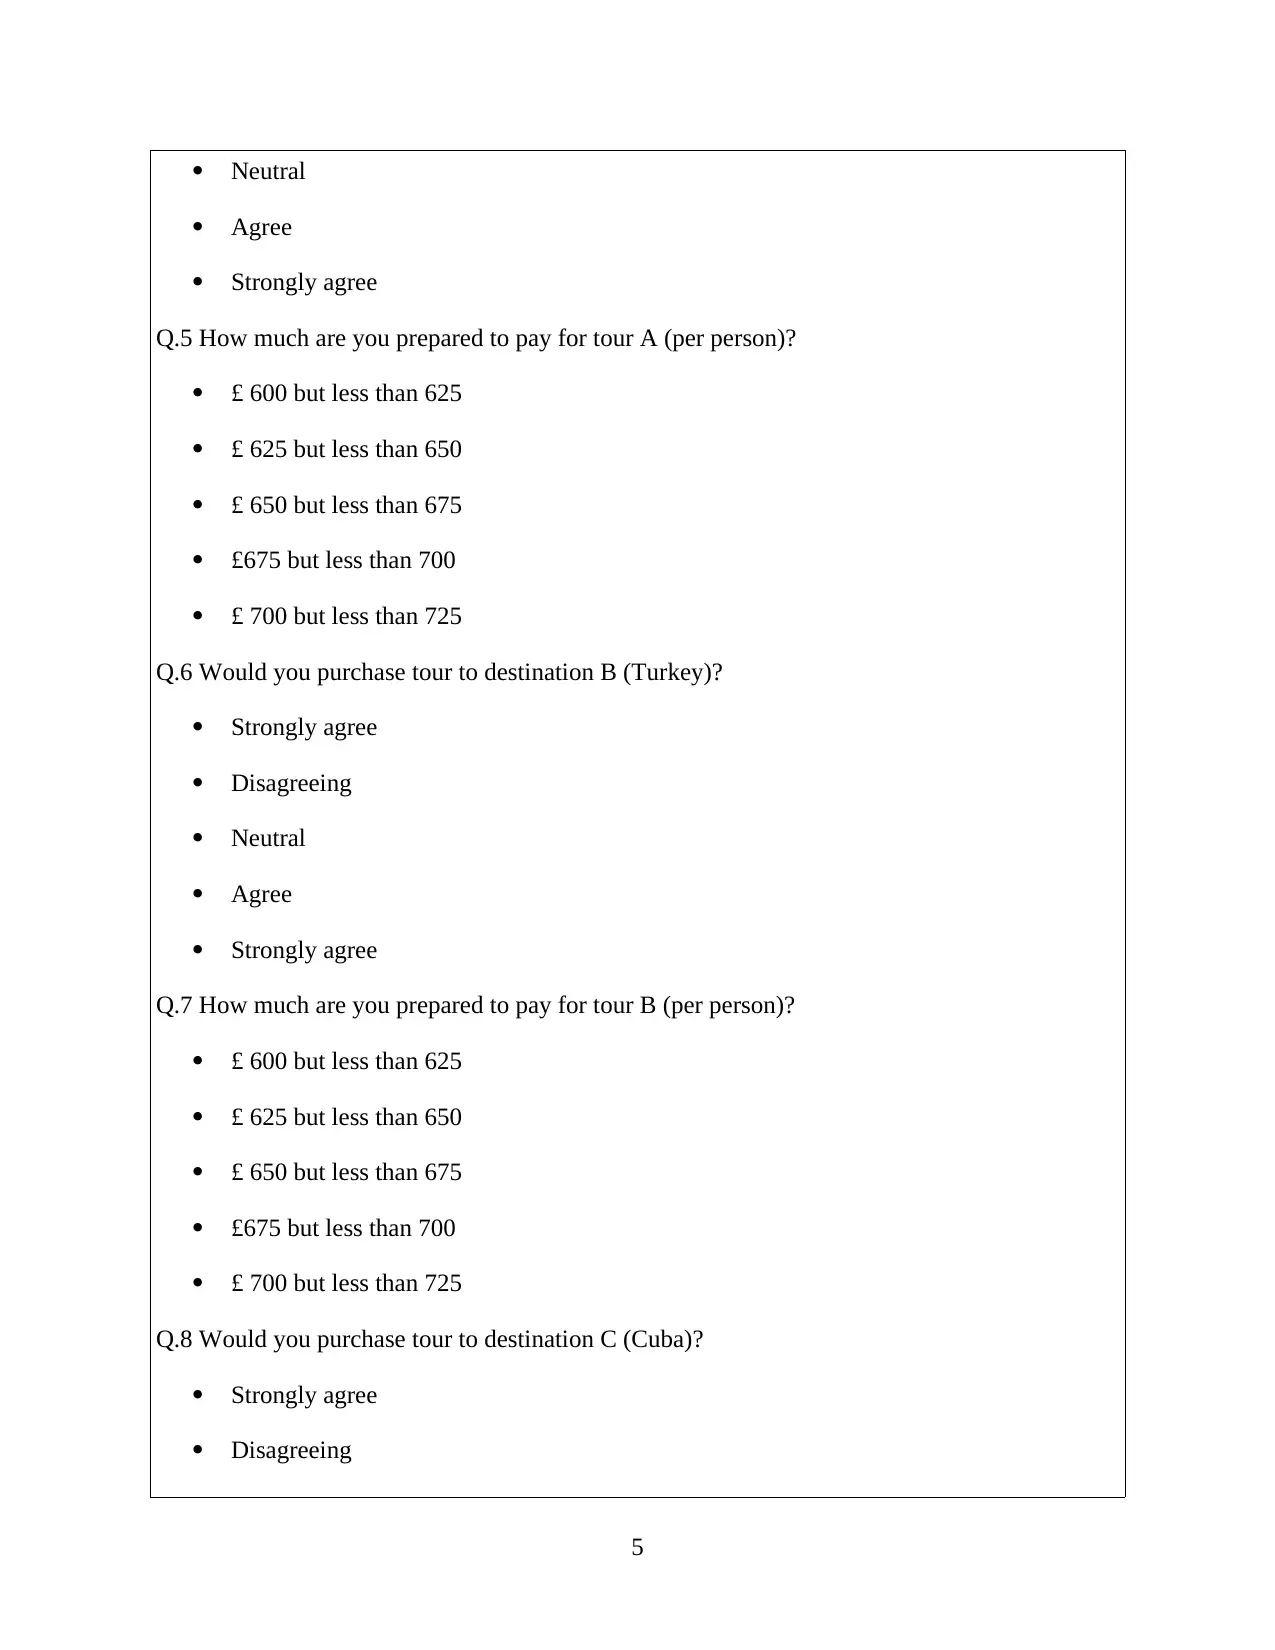
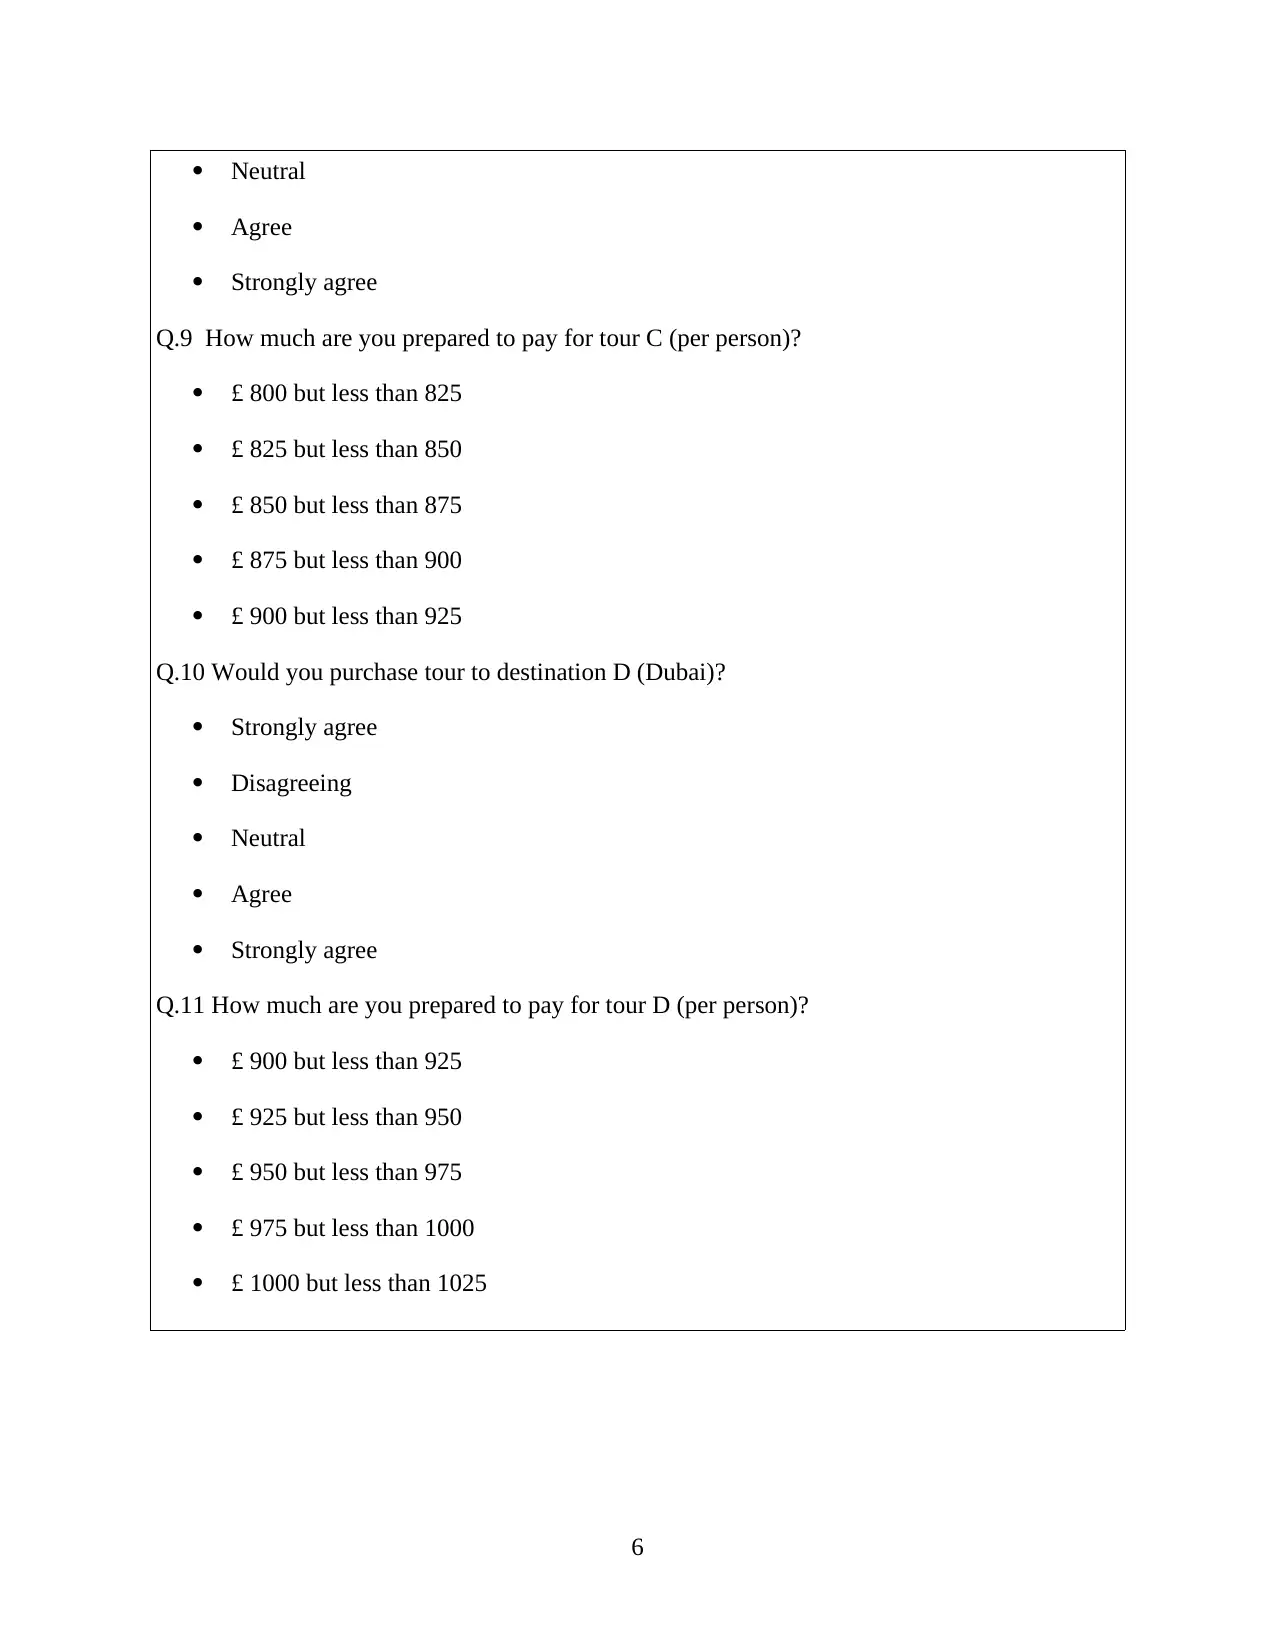
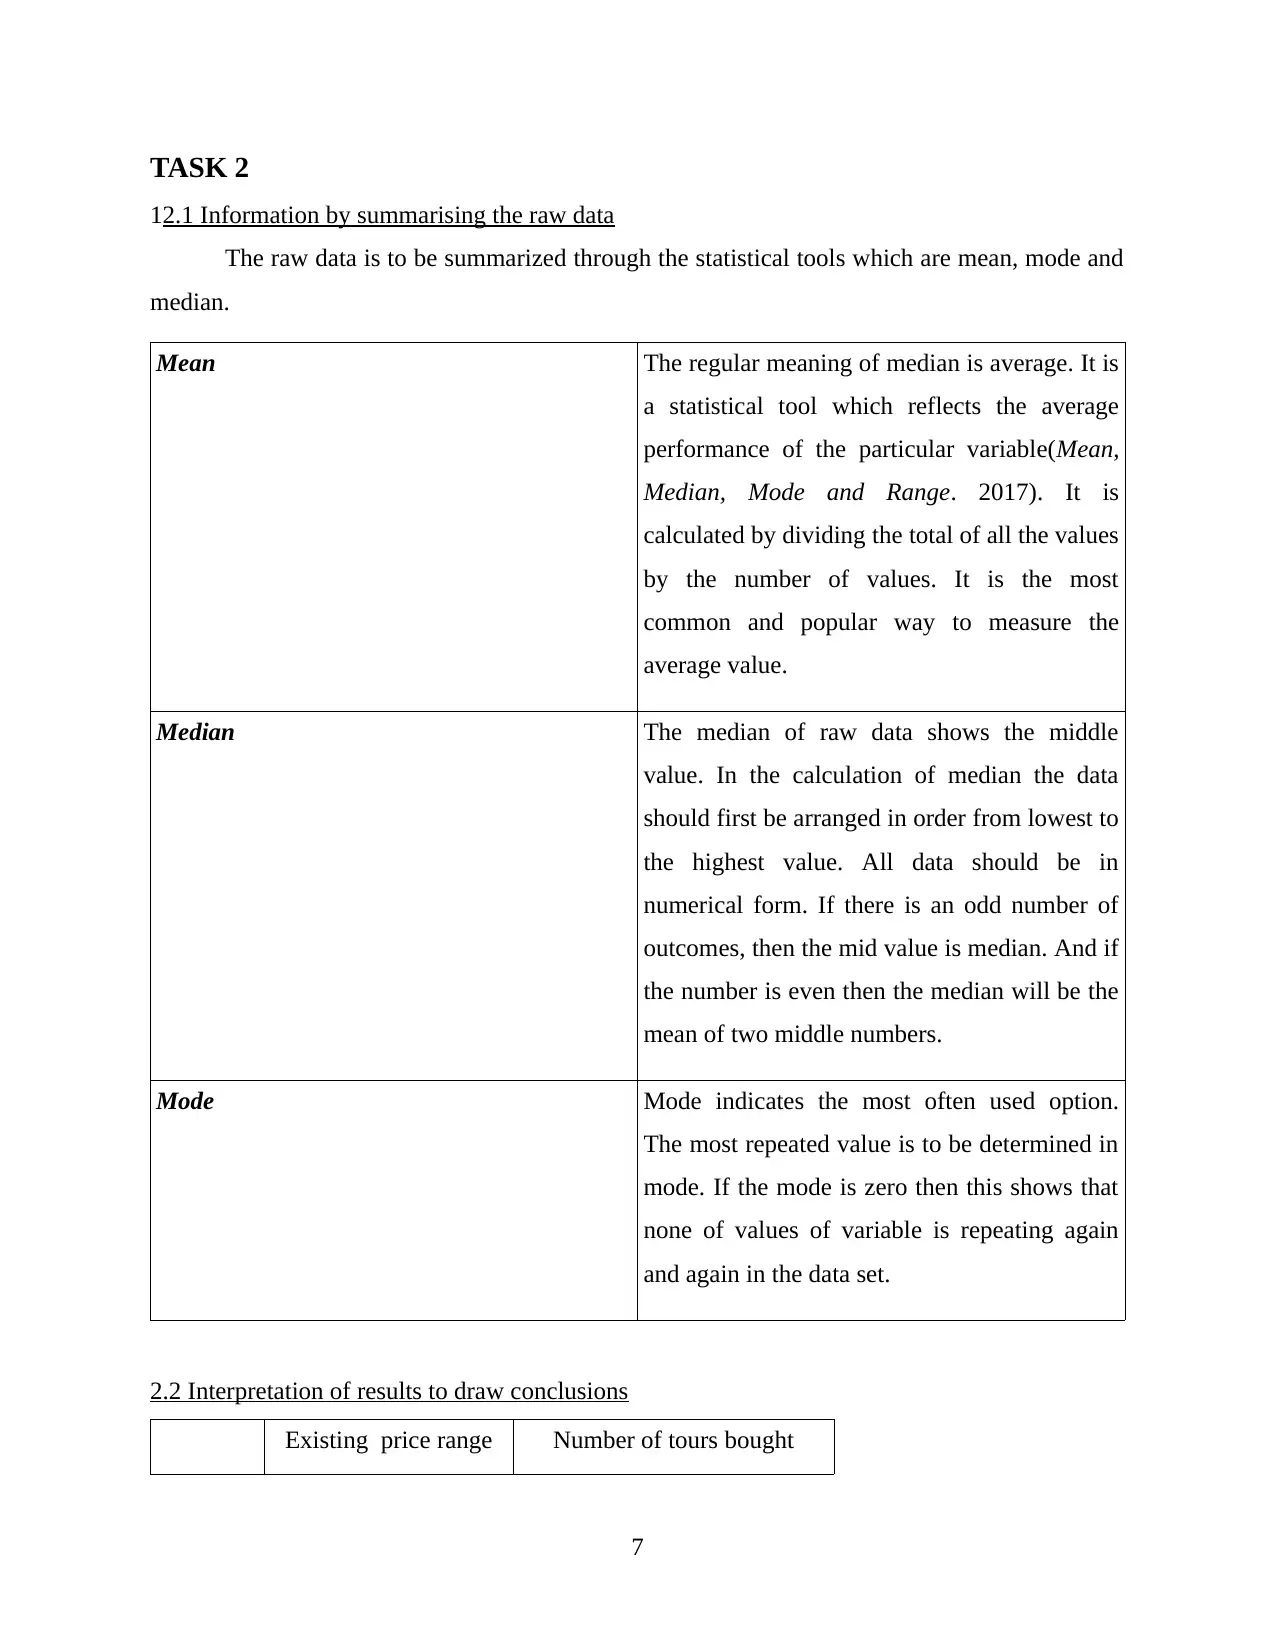
This report examines the business decision-making process of Thomas Cook, a tourism company, focusing on data collection, survey methodologies, and statistical analysis. The report begins by discussing primary and secondary data sources, highlighting the use of questionnaires and secondary data from books and journals. It then details the survey methodology, including personal and mail interviews, and sampling techniques such as simple random and convenience sampling. The report presents a questionnaire used to gather customer preferences for potential tour destinations. Task 2 involves summarizing raw data using mean, median, and mode, followed by an interpretation of the results and an analysis of data dispersion using standard deviation, quartiles, and percentiles to aid decision-making. Finally, Task 3 includes a graphical presentation of sales data and an interpretation of sales trends over time, providing insights into the company's performance and customer preferences. The report provides a comprehensive overview of the data analysis and decision-making process within the context of the tourism industry.
Document Page
BUSINESS DECISION
MAKING
tabler-icon-diamond-filled.svg

Paraphrase This Document

Need a fresh take? Get an instant paraphrase of this document with our AI Paraphraser
Document Page
Document Page
INTRODUCTION
The decision making process of any company or organization is an important aspect in
order to develop of business. For achieving organizational or managerial objectives or goals, a
decision is a course of action that is take from set of alternative options. It is a continuous and
indispensable element for managing any activities of business or organization. Thomas Cook is
tourism company in the United kingdom. This company wants to collect relevant data by using
appropriate tools and techniques. In this modern world, there are many organizations that make
use of facts and figures so that management will be able to make effective decision. Further, to
get understanding and effective decision, management make use of statistical tools. These are
helpful enough to measure the performance of the firm. Data which has gathered from the
questionnaires have been interpreted in the report.
TASK 1
1.1 Sources of data collection for the development of business
Collection of data and information can be done by various sources for conducting a
research. Mainly, there are two different type of techniques for collection of data, they are
Primary sources and Secondary sources. Generally, the company such as Thomas Cook has used
these two sources for generating better results(Zsambok and Klein, 2014). Primary data type is a
set of facts and figures which is never collected by anyone before and also has not been
published in any book, journal, magazines etc. It is also known as first hand data collection
technique which is mostly consists of set of questionnaires. On the other side, the secondary data
is that which has already been collected by someone else and published in some books, journals
or magazines.
The information related to facts and figures that has collected from internet are also
covered in the secondary sources. Both types of data collection sources are essential for the
research purpose. The researcher can take review of past data and get idea of conducting a
research. Therefore, both types of data sources persist great importance. In order to conduct this
research for Thomas Cook, the secondary data has collected from books, journals and
magazines(Pettigrew, 2014). And for primary data, sample of 90 customers will be taken into
consideration. The company is planning for four different tours that are Morocco, Turkey, Cuba
1
Document Page
and Dubai. And they wants to know that customer would prefer for these tours or not. For this
purpose they are doing research.
The list of type of data required are as follows:
Age-groups
Costomer profile
Preference
Attitude
Buying behaviour
1.2 Survey methodology and sampling techniques
Survey methodology:
Survey methodology can be determined as the study in which individual units from
particular associated survey data or population is collected. For this purpose, there are various
strategies used which are questionnaire and methods for improving the number and accuracy of
responds to surveys(Nowduri, 2011). Majorly there are four methods for collection of data with
the help of Survey Methods. In this context, it includes interview through electronic, telephonic,
personal interview and mail interview. For this survey the company has gone with personal and
mail interview.
Personal interviewing This is the most versatile from the all methods.
It is also termed as face-to-face survey(García-
Peñalvo and Conde, 2014). This type of survey
method is used when a specific target
population is involved. The main aim of this
method is to explore the responses of the
people to gather more and deeper information.
Mail interviewing The email survey means the survey instrument
like questionnaire is send to the respondent
through email. It can reach all types of people.
2
tabler-icon-diamond-filled.svg

Paraphrase This Document

Need a fresh take? Get an instant paraphrase of this document with our AI Paraphraser
Document Page
Sampling techniques:
In order to conduct a research, it becomes essential to identify the the sample units. The
conclusion which is made for sample then it will represent the entire population(Ho, Xu and
Dey, 2010). The sampling techniques which has used in this survey are simple random sampling
and convenience sampling.
Simple random sampling This method is generally used in the research
in which sample units are to be taken on the
random basis from population. When specific
type of sample is not required in the research
for data collection then this technique is good.
And in our research, it is required to analyse
the buying behaviour of the people.
Convenience sampling In this method the sample units are to be taken
from the population on the basis of
convenience of researcher. Therefore, many of
the researchers prefer to follow this method for
collecting data.
1.3 Questionnaire for the survey
Name:
Gender:
Male
Female
Marital status:
Married
Unmarried
3
Document Page
Divorced
Q.1 Age-groups
Below 20 years
20 to 30 years
30 to 40 years
40 to 50 years
50 to 60 years
60 to 70 years
Above 70 years
Q.2 Are you satisfied with the existing range of tours offered by our company?
Strongly agree
Disagreeing
Neutral
Agree
Strongly agree
Q.3 How many tours have you bought from us?
1
2
3
4
More than 4
Q.4 Would you purchase tour to destination A (Morocco)?
Strongly agree
Disagreeing
4
Document Page
Neutral
Agree
Strongly agree
Q.5 How much are you prepared to pay for tour A (per person)?
£ 600 but less than 625
£ 625 but less than 650
£ 650 but less than 675
£675 but less than 700
£ 700 but less than 725
Q.6 Would you purchase tour to destination B (Turkey)?
Strongly agree
Disagreeing
Neutral
Agree
Strongly agree
Q.7 How much are you prepared to pay for tour B (per person)?
£ 600 but less than 625
£ 625 but less than 650
£ 650 but less than 675
£675 but less than 700
£ 700 but less than 725
Q.8 Would you purchase tour to destination C (Cuba)?
Strongly agree
Disagreeing
5
tabler-icon-diamond-filled.svg

Paraphrase This Document

Need a fresh take? Get an instant paraphrase of this document with our AI Paraphraser
Document Page
Neutral
Agree
Strongly agree
Q.9 How much are you prepared to pay for tour C (per person)?
£ 800 but less than 825
£ 825 but less than 850
£ 850 but less than 875
£ 875 but less than 900
£ 900 but less than 925
Q.10 Would you purchase tour to destination D (Dubai)?
Strongly agree
Disagreeing
Neutral
Agree
Strongly agree
Q.11 How much are you prepared to pay for tour D (per person)?
£ 900 but less than 925
£ 925 but less than 950
£ 950 but less than 975
£ 975 but less than 1000
£ 1000 but less than 1025
6
Document Page
TASK 2
12.1 Information by summarising the raw data
The raw data is to be summarized through the statistical tools which are mean, mode and
median.
Mean The regular meaning of median is average. It is
a statistical tool which reflects the average
performance of the particular variable(Mean,
Median, Mode and Range. 2017). It is
calculated by dividing the total of all the values
by the number of values. It is the most
common and popular way to measure the
average value.
Median The median of raw data shows the middle
value. In the calculation of median the data
should first be arranged in order from lowest to
the highest value. All data should be in
numerical form. If there is an odd number of
outcomes, then the mid value is median. And if
the number is even then the median will be the
mean of two middle numbers.
Mode Mode indicates the most often used option.
The most repeated value is to be determined in
mode. If the mode is zero then this shows that
none of values of variable is repeating again
and again in the data set.
2.2 Interpretation of results to draw conclusions
Existing price range Number of tours bought
7
Document Page
Mean 4.3 3.4
Median 5 3
Mode 5 5
Mean – The mean value of existing range of tour which are offered by Thomas Cook is 4.3
which indicates that customers are agree as they are satisfied with the price range of the
company. The mean for number of tours bought is 3.4 that means customers purchase the tour
package in an average three times.
Median – The median of existing price range is 5 that means the mid value is strong agree as per
the data. The median of number of tours bought by the customers is 3 which shows that the
frequency of purchasing of tours is three.
Mode – The mode for existing price range is 5 that means customers are repeatedly choose the
strongly agree option. The mode for number of tours bought is 5 that means most of the
customers are purchased the tour package more than four times.
2.3 Analyse data by using measure of dispersion
Standard Deviation:
The standard deviation can be determined as tool that is used to measure the dispersion
that is being calculated form of a set of data from its mean. However, there are conditions in
which the data point is away from the mean. In such condition there are higher divination that is
found within the set of data. Further, it can also be calculated with the help of square root of
variance. This is derived and determined by the variation between each data point relative to the
mean (Vercellis, 2011). The overall standard deviation indicates that the most of the customers
have given the average response to the questions. Commonly it can be that deviation is high in
relation the mean values.
2.4 Quartile and Percentile for decision making
Table 1: Quartile and Percentile for decision making
Quartile The range of data is divided into four equal
8
tabler-icon-diamond-filled.svg

Paraphrase This Document

Need a fresh take? Get an instant paraphrase of this document with our AI Paraphraser
Document Page
parts. The first quartile (lower) is the number
below 25% of bottom data. The second quartile
(median) is valued at 50% of the data below it.
The third (upper) one has 75% of the data
below it. And The top 25% of data above it.
Percentile This can be determined as term which is used
each and every day but it does not have a
proper definition (Hwang and Yoon, 2012). In
order words, it can be stated that as a number
in which percentage of score fall below
percentile.


These are the tools which helps in decision making for the packaged tour market of Thomas
Cook company.
TASK-3
3.1 Graphical presentation
Existing sales of tours (£000s)
Appendix B sale
201
4 2015 2016
Q1 Q2 Q3 Q4 Q1 Q2 Q3 Q4 Q1 Q2 Q3 Q4
Destinations in Southern Europe 234 323 350 123 243 325 375 130 250 330 360 140
Destinations in Africa and
Middle East 105 120 130 75 108 122 131 76 108 123 132 80
9
Document Page
Destinations in Asia 409 290 280 350 420 309 300 375 450 334 323 380
Destinations in South America 23 30 34 25 25 32 34 26 26 33 35 27
Destinations in North America 110 134 234 100 109 145 245 120 120 150 260 140
Other Destinations 50 62 76 40 52 64 78 42 54 65 79 44
Interpretation – In this graph there are many sales of the different year are calculated and in this
present the sale are increase at the same time that they (Aharoni, Tihanyi, and Connelly,
2011)reflect the profit of the company when the turnover increase the sale and profit is also
increased at that same it is concluded that the sale may reflect the company and the turnover is
10
Destinations in Southern Europe
Destinations in Africa and Middle East
Destinations in Asia
Destinations in South America
Destinations in North America
Other Destinations
0
100
200
300
400
500
Q1
2014 Q2
sale Q3
Q4
Q1
2015 Q2
Q3
Q4
Q1
2016 Q2
Q3
Q4
chevron_up_icon
1 out of 21
circle_padding
hide_on_mobile
zoom_out_icon
[object Object]