Analysis and Planning of Residential Care Homes Business in the UK
VerifiedAdded on 2023/03/24
|24
|2582
|26
Report
AI Summary
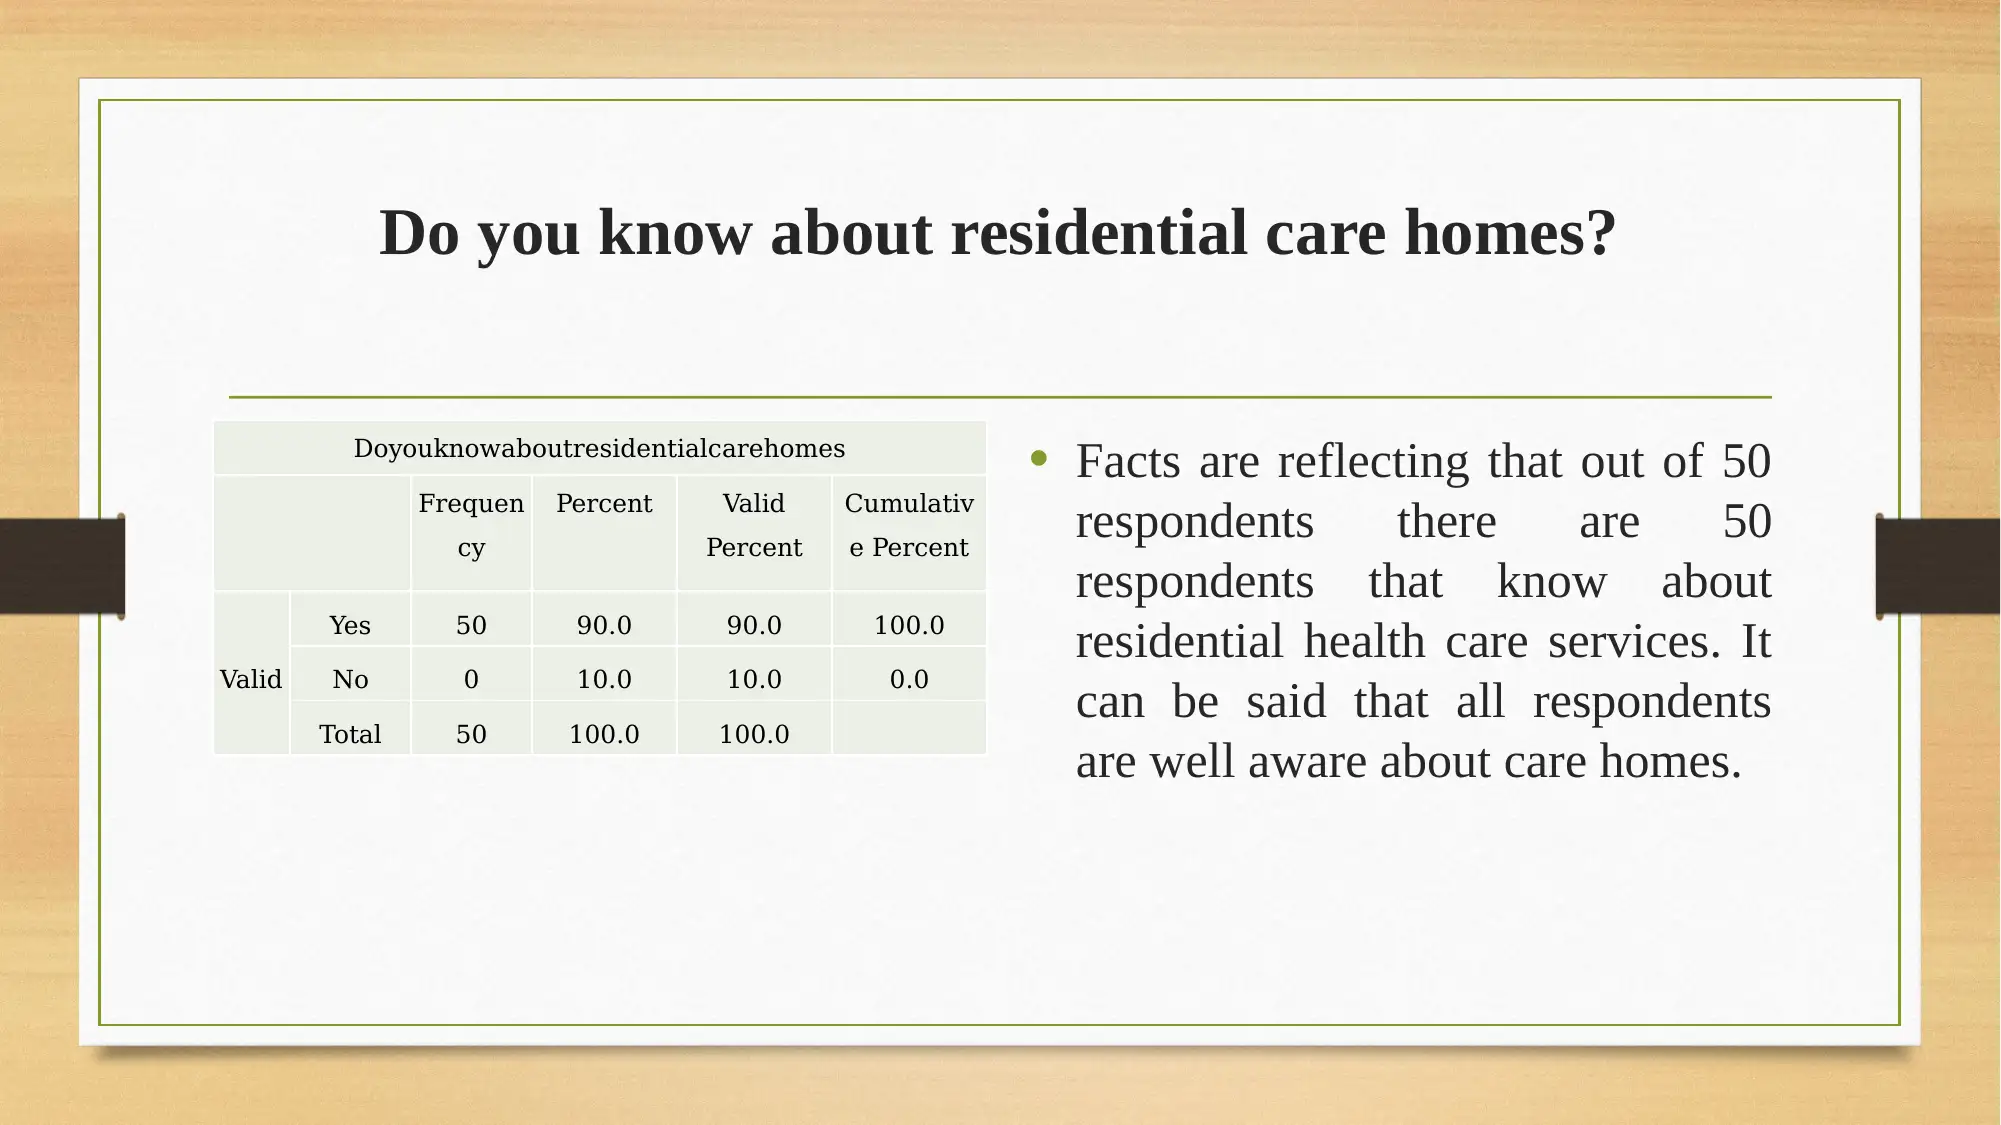
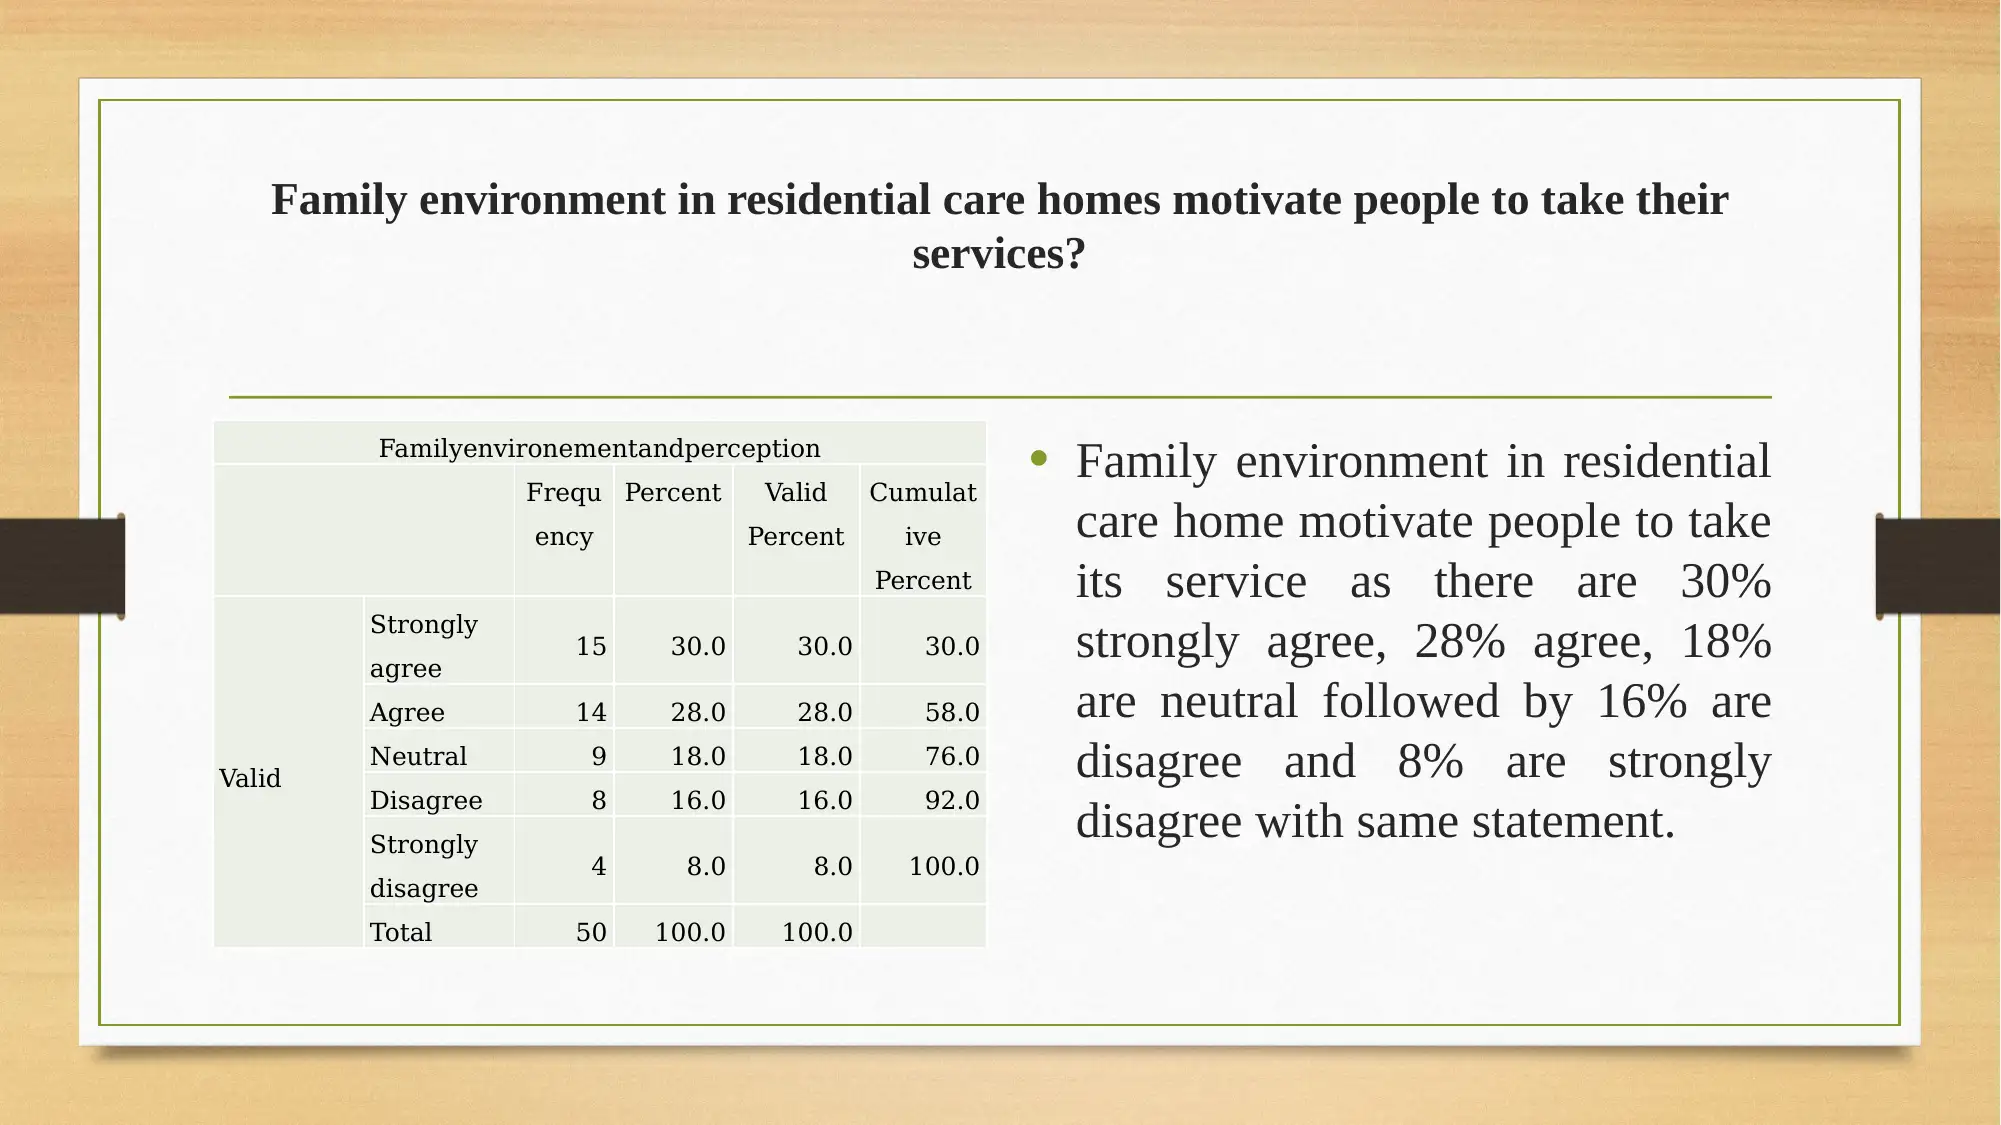
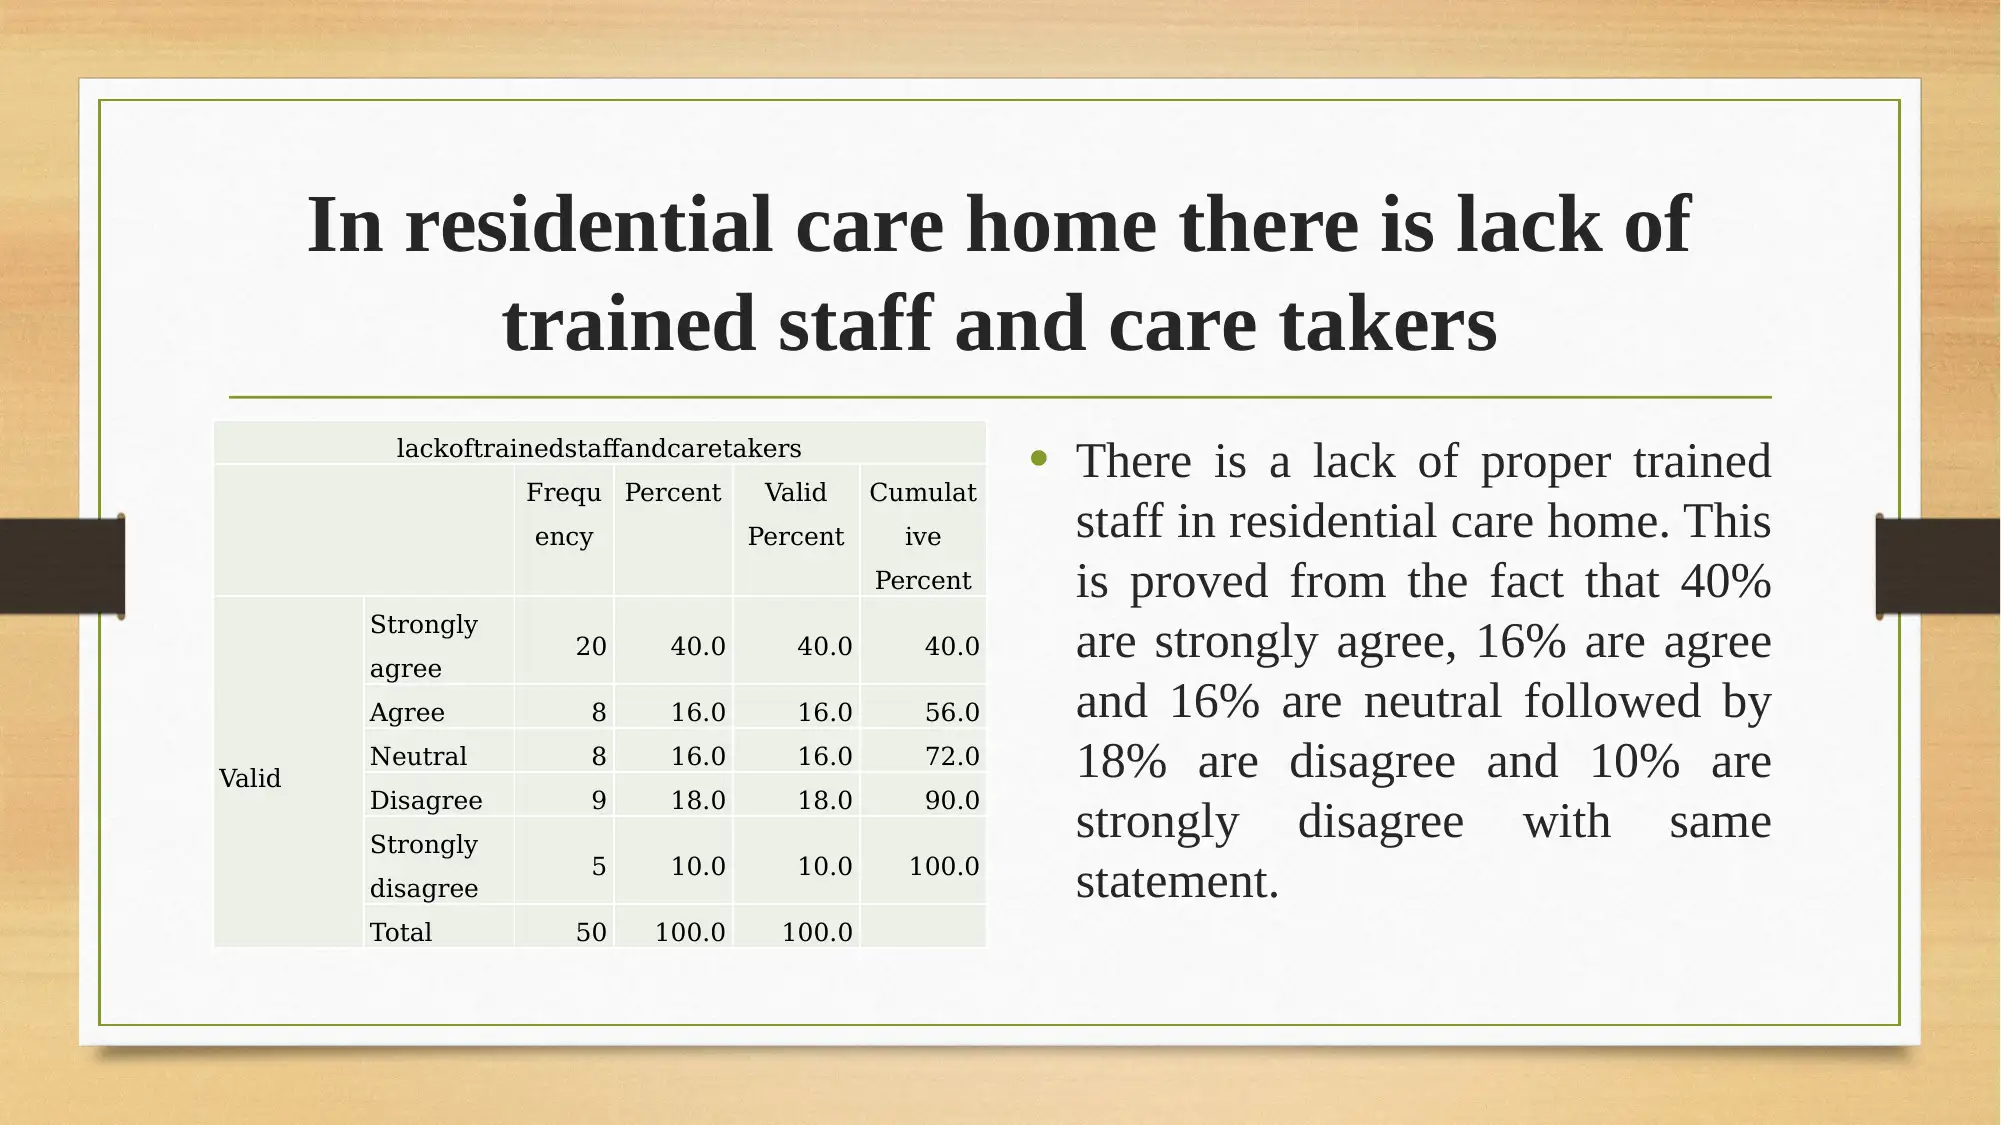
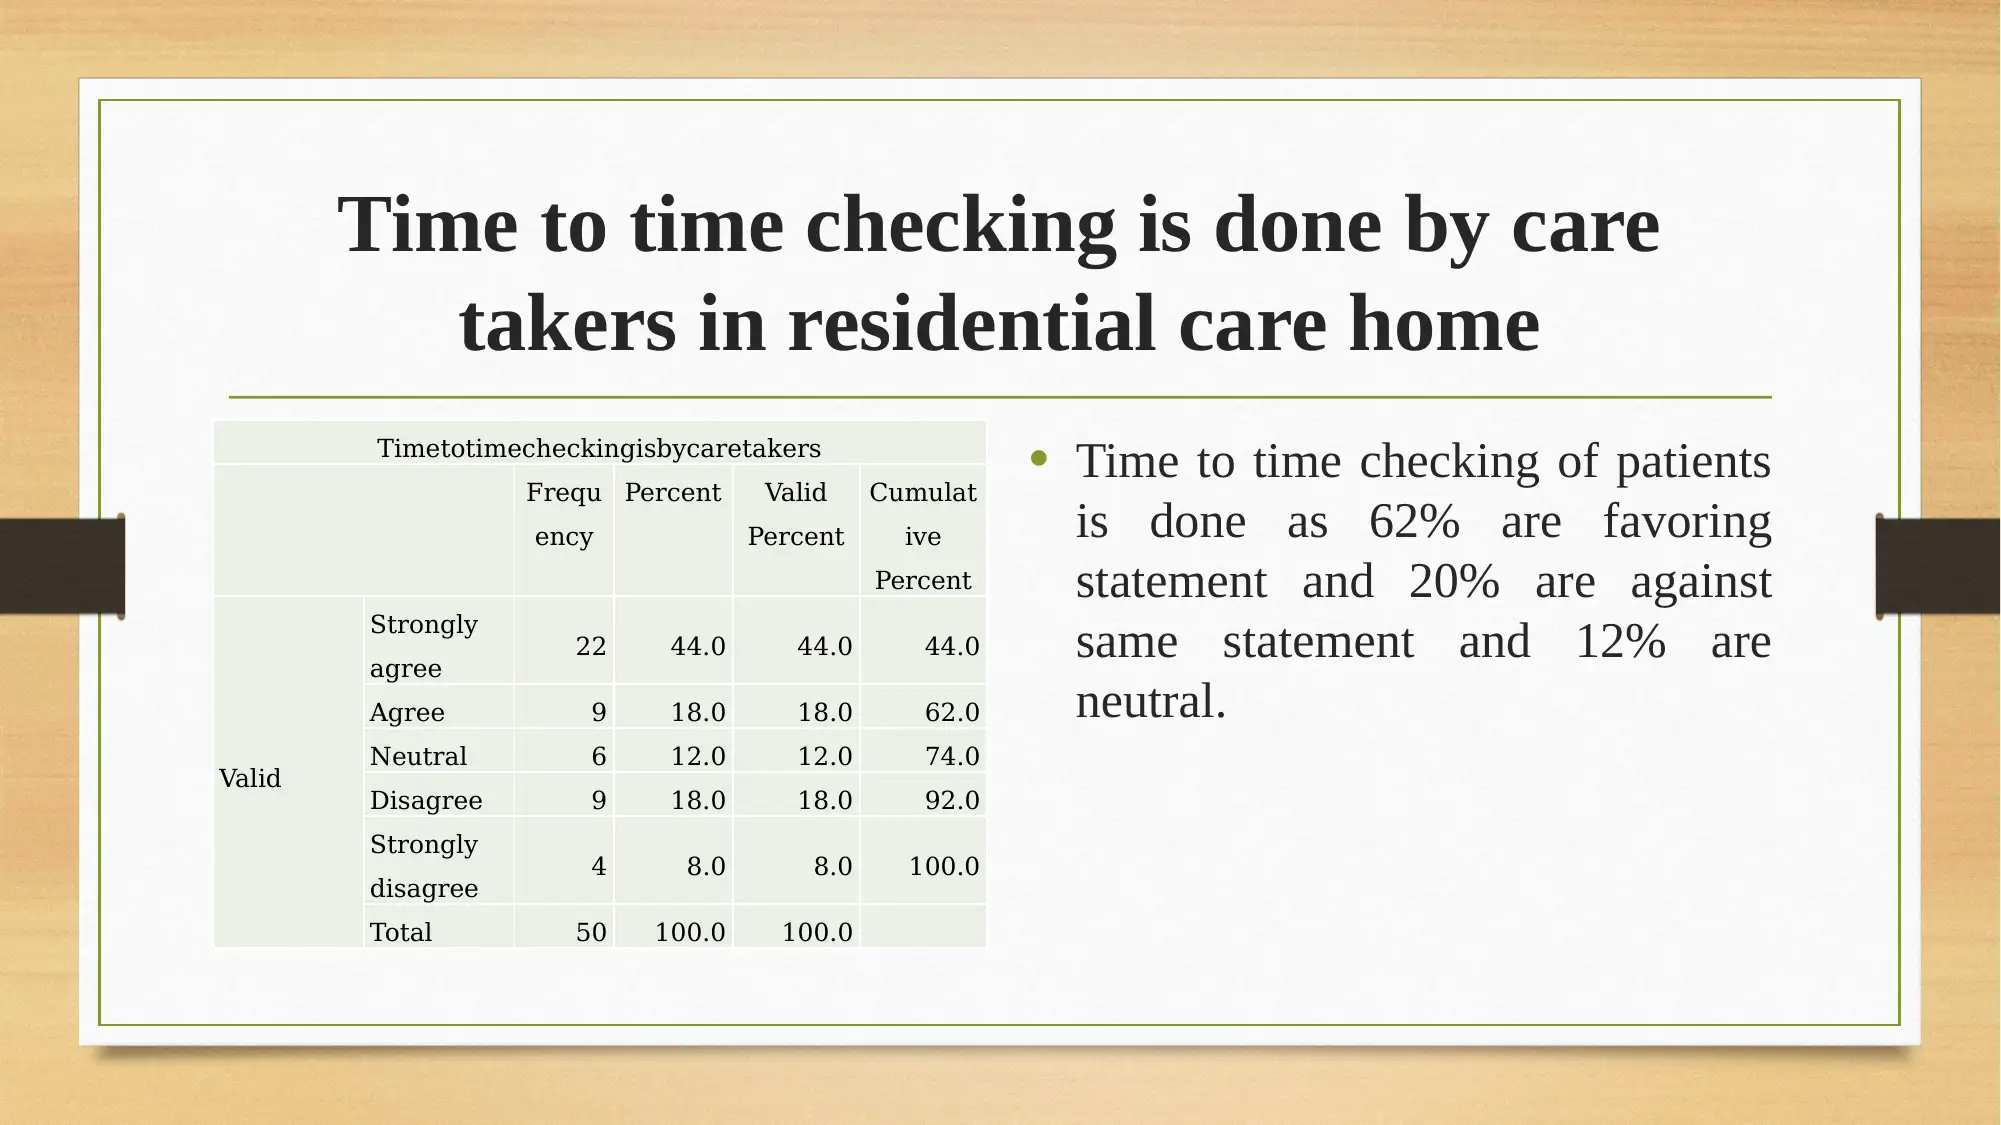
This report provides a comprehensive business analysis and planning overview of residential care homes in the UK. It examines public perception and various factors influencing the profitability of these homes. The analysis incorporates data collected from primary sources (a sample of 50 people) and secondary sources (research papers). Thematic analysis and descriptive statistics, along with regression analysis conducted using SPSS, reveal key insights. The findings suggest a generally positive awareness of residential care homes, with family environment and staff training identified as significant factors in service selection and satisfaction. Occupancy rates are perceived as high, impacting profitability alongside satisfaction levels. Regression analysis confirms a significant relationship between occupancy rates, satisfaction, staff levels, and profitability. SPSS software is highlighted for its utility in predictive analysis, aiding venture capitalists and businesses in forecasting future trends in the residential care home sector. Desklib offers similar solved assignments and past papers for students.

Business Analysis and
Planning
Planning
Paraphrase This Document
Need a fresh take? Get an instant paraphrase of this document with our AI Paraphraser

INTRODUCTION
• Residential care homes number are growing consistently in the UK. In the current report
perception that people have about residential care homes is measured and impact of
varied factors on its profitability is measured. In this regard descriptive analysis, thematic
analysis and regression analysis is done in the report and results are interpreted. At end
of the report significance of use SPSS for analysis of data is explained in detail.

Implementation of data collection strategy
from primary and secondary sources
• Primary data will be taken from sample of 50 people. Different questions related to research objectives
will be ask from them and their opinion on same will collected.
• Secondary data will be collected from research papers that are published in Journals.
• It can be said that both data collection strategy are best suited to the requirements. As primary data is taken from reliable sources and
appropriate strategy is followed to collect data. In same secondary source is appropriately used to gather data and in this way perfect
data collection strategy is developed in the business (Zimmerman, Murillo-Sánchez and Thomas, 2011).
• However, data collection alone is not sufficient because when same is gathered there is probability that there may be lots of mistakes in
the data. Many times respondents answer one question accurately but answer other interlinked answer inaccurately. In order to solve
this problem after collection of data same will be analysed and it will be identified whether response given by respondents are accurate.
⊘ This is a preview!⊘
Do you want full access?
Subscribe today to unlock all pages.

Trusted by 1+ million students worldwide

Complex range of techniques to analyse data
In order to analyse data number of techniques can be used. It depend on the research objectives that which
sort of data one takes for analysis purpose. Objective of undertaking present research study are given below.
• To develop broad understanding of residential care home business.
• To identify issues that people have in residential care homes.
• To identify factors after considering which people finally make decision in respect to selection of residential care
homes.
• To find out impact of occupancy rate on earning of profit in business.
Paraphrase This Document
Need a fresh take? Get an instant paraphrase of this document with our AI Paraphraser

Techniques used for analysis of data
• Thematic analysis: In order to analyse data thematic analysis method will be used and under this results
obtained from different respondents will be analysed. In this regard, pictorial presentation of facts will be
done and it will be identified that in which direction respondents are giving response to asked question.
• Positive and negative response can be received from sample units and all of them will be reveal in charts.
Hence, it can be said that tables will give better picture of what people think about residential care
homes.

Do you know about residential care homes?
Doyouknowaboutresidentialcarehomes
Frequen
cy
Percent Valid
Percent
Cumulativ
e Percent
Valid
Yes 50 90.0 90.0 100.0
No 0 10.0 10.0 0.0
Total 50 100.0 100.0
• Facts are reflecting that out of 50
respondents there are 50
respondents that know about
residential health care services. It
can be said that all respondents
are well aware about care homes.
⊘ This is a preview!⊘
Do you want full access?
Subscribe today to unlock all pages.

Trusted by 1+ million students worldwide

Family environment in residential care homes motivate people to take their
services?
Familyenvironementandperception
Frequ
ency
Percent Valid
Percent
Cumulat
ive
Percent
Valid
Strongly
agree 15 30.0 30.0 30.0
Agree 14 28.0 28.0 58.0
Neutral 9 18.0 18.0 76.0
Disagree 8 16.0 16.0 92.0
Strongly
disagree 4 8.0 8.0 100.0
Total 50 100.0 100.0
• Family environment in residential
care home motivate people to take
its service as there are 30%
strongly agree, 28% agree, 18%
are neutral followed by 16% are
disagree and 8% are strongly
disagree with same statement.
Paraphrase This Document
Need a fresh take? Get an instant paraphrase of this document with our AI Paraphraser

In residential care home there is lack of
trained staff and care takers
lackoftrainedstaffandcaretakers
Frequ
ency
Percent Valid
Percent
Cumulat
ive
Percent
Valid
Strongly
agree 20 40.0 40.0 40.0
Agree 8 16.0 16.0 56.0
Neutral 8 16.0 16.0 72.0
Disagree 9 18.0 18.0 90.0
Strongly
disagree 5 10.0 10.0 100.0
Total 50 100.0 100.0
• There is a lack of proper trained
staff in residential care home. This
is proved from the fact that 40%
are strongly agree, 16% are agree
and 16% are neutral followed by
18% are disagree and 10% are
strongly disagree with same
statement.

Time to time checking is done by care
takers in residential care home
Timetotimecheckingisbycaretakers
Frequ
ency
Percent Valid
Percent
Cumulat
ive
Percent
Valid
Strongly
agree 22 44.0 44.0 44.0
Agree 9 18.0 18.0 62.0
Neutral 6 12.0 12.0 74.0
Disagree 9 18.0 18.0 92.0
Strongly
disagree 4 8.0 8.0 100.0
Total 50 100.0 100.0
• Time to time checking of patients
is done as 62% are favoring
statement and 20% are against
same statement and 12% are
neutral.
⊘ This is a preview!⊘
Do you want full access?
Subscribe today to unlock all pages.

Trusted by 1+ million students worldwide

Do your family members are satisfied from service given to you by residential
care home?
Satisfactionfromservice
Frequ
ency
Percent Valid
Percent
Cumulat
ive
Percent
Valid
Strongly
satisfied 20 40.0 40.0 40.0
Satisfied 13 26.0 26.0 66.0
Neutral 8 16.0 16.0 82.0
Dissatisfied 6 12.0 12.0 94.0
Strongly
dissatisfied 3 6.0 6.0 100.0
Total 50 100.0 100.0
• 66% respondents are satisfied and
16% are neutral followed by 18%
are dissatisfied from statement
that family members of relevant
people are satisfied from
residential care homes.
Paraphrase This Document
Need a fresh take? Get an instant paraphrase of this document with our AI Paraphraser

You will like to recommend residential care home to other people where you
currently is admitted?
recommendresidentialcarehome
Frequ
ency
Percent Valid
Percent
Cumulat
ive
Percent
Valid
Strongly
agree 21 42.0 42.0 42.0
Agree 15 30.0 30.0 72.0
Neutral 6 12.0 12.0 84.0
Disagree 5 10.0 10.0 94.0
Strongly
disagree 3 6.0 6.0 100.0
Total 50 100.0 100.0
• 72% respondents like to recommend care
home services and 12% respondents are
neutral as well as 16% respondents are
disagree with same statement. Hence, it
can be said that majority of respondents
recommend care home service.

In current time period occupancy rate is high in residential care
home. Do you agree?
Levelofoccupancyrate
Frequ
ency
Percent Valid
Percent
Cumulat
ive
Percent
Valid
Strongly
agree 27 54.0 54.0 54.0
Agree 13 26.0 26.0 80.0
Neutral 4 8.0 8.0 88.0
Disagree 5 10.0 10.0 98.0
Strongly
disagree 1 2.0 2.0 100.0
Total 50 100.0 100.0
• 80% of respondents are agree with
fact that level of occupancy rate
increase in residential care centers
and there are 8% respondents
which are neutral followed by
12% are dissatisfied from same
statement. Hence, in future
demand of centers will increase.
⊘ This is a preview!⊘
Do you want full access?
Subscribe today to unlock all pages.

Trusted by 1+ million students worldwide
1 out of 24
Related Documents

Your All-in-One AI-Powered Toolkit for Academic Success.
+13062052269
info@desklib.com
Available 24*7 on WhatsApp / Email
Unlock your academic potential
Copyright © 2020–2025 A2Z Services. All Rights Reserved. Developed and managed by ZUCOL.