Analyzing Unemployment: Hypothesis Testing and Government Impact

Verified

Added on  2021/06/17

|4
|757
|199
Homework Assignment
AI Summary
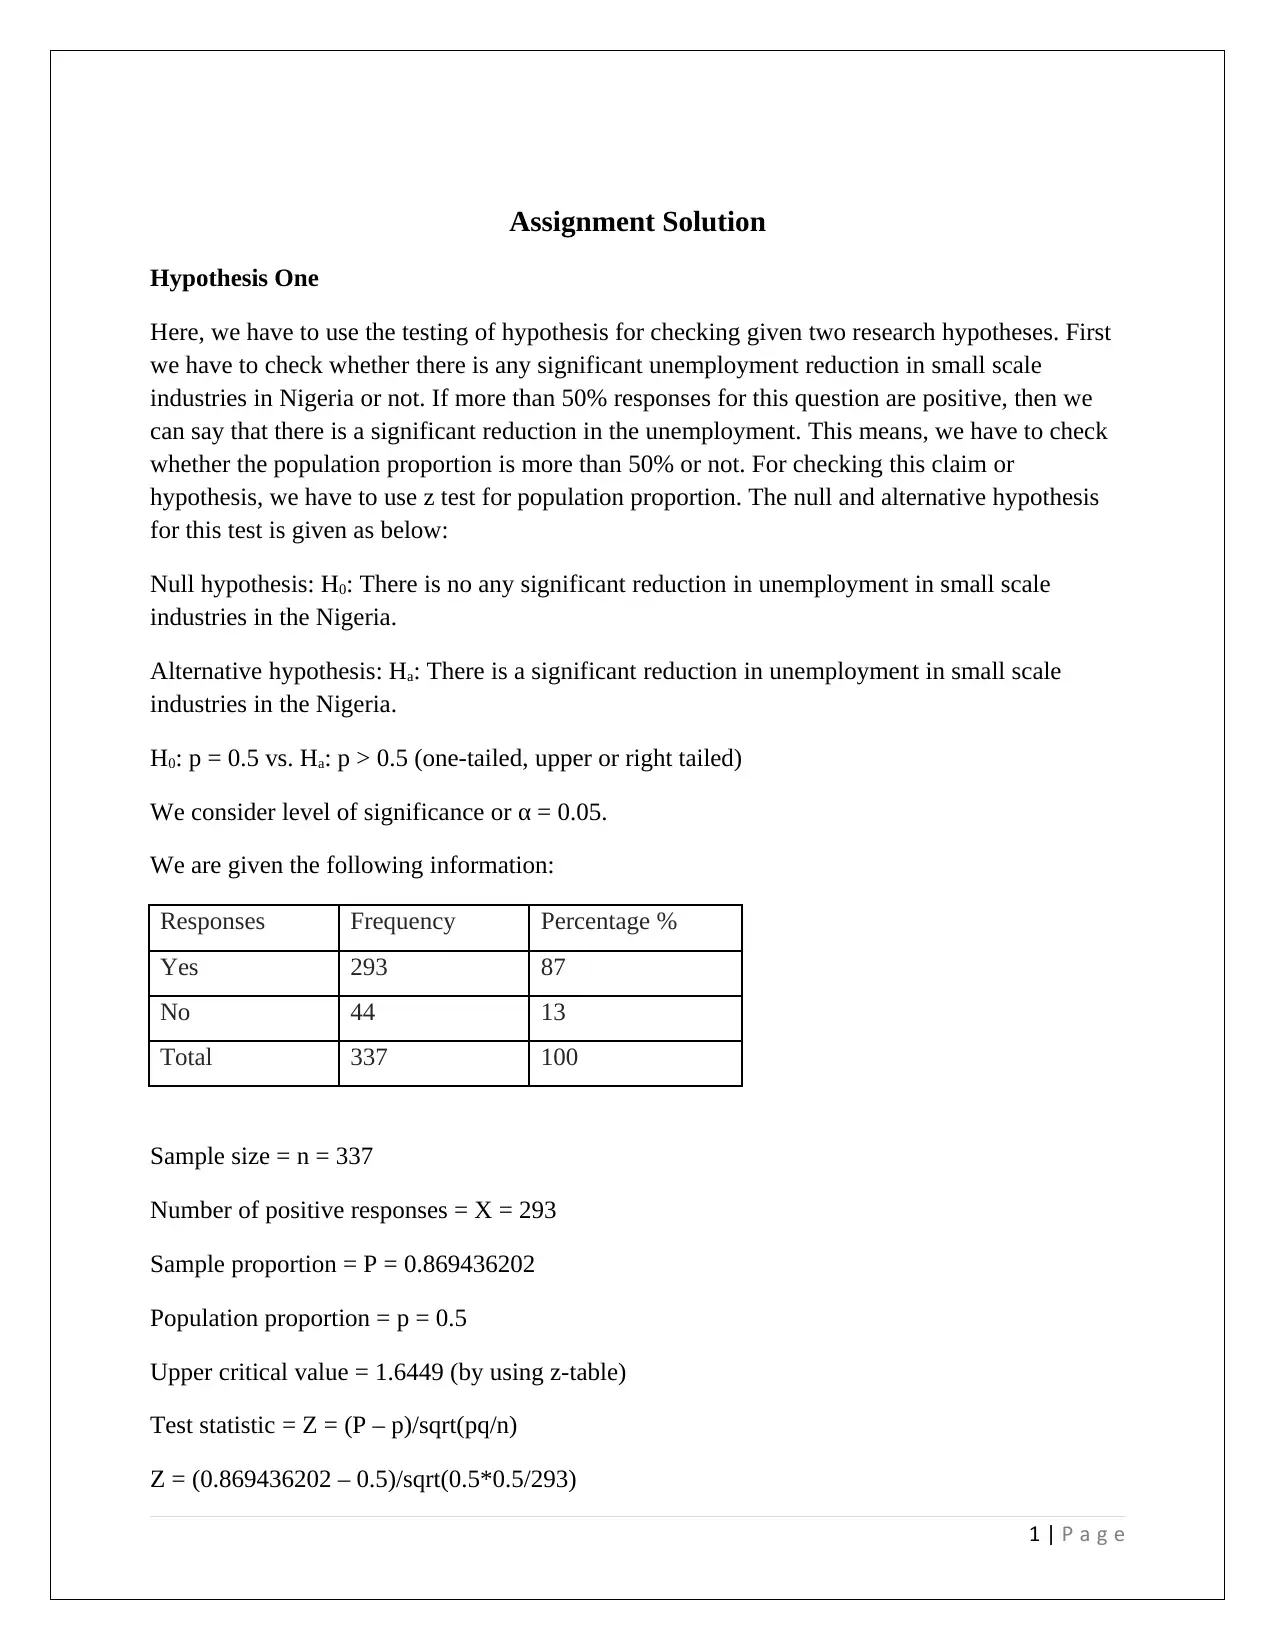
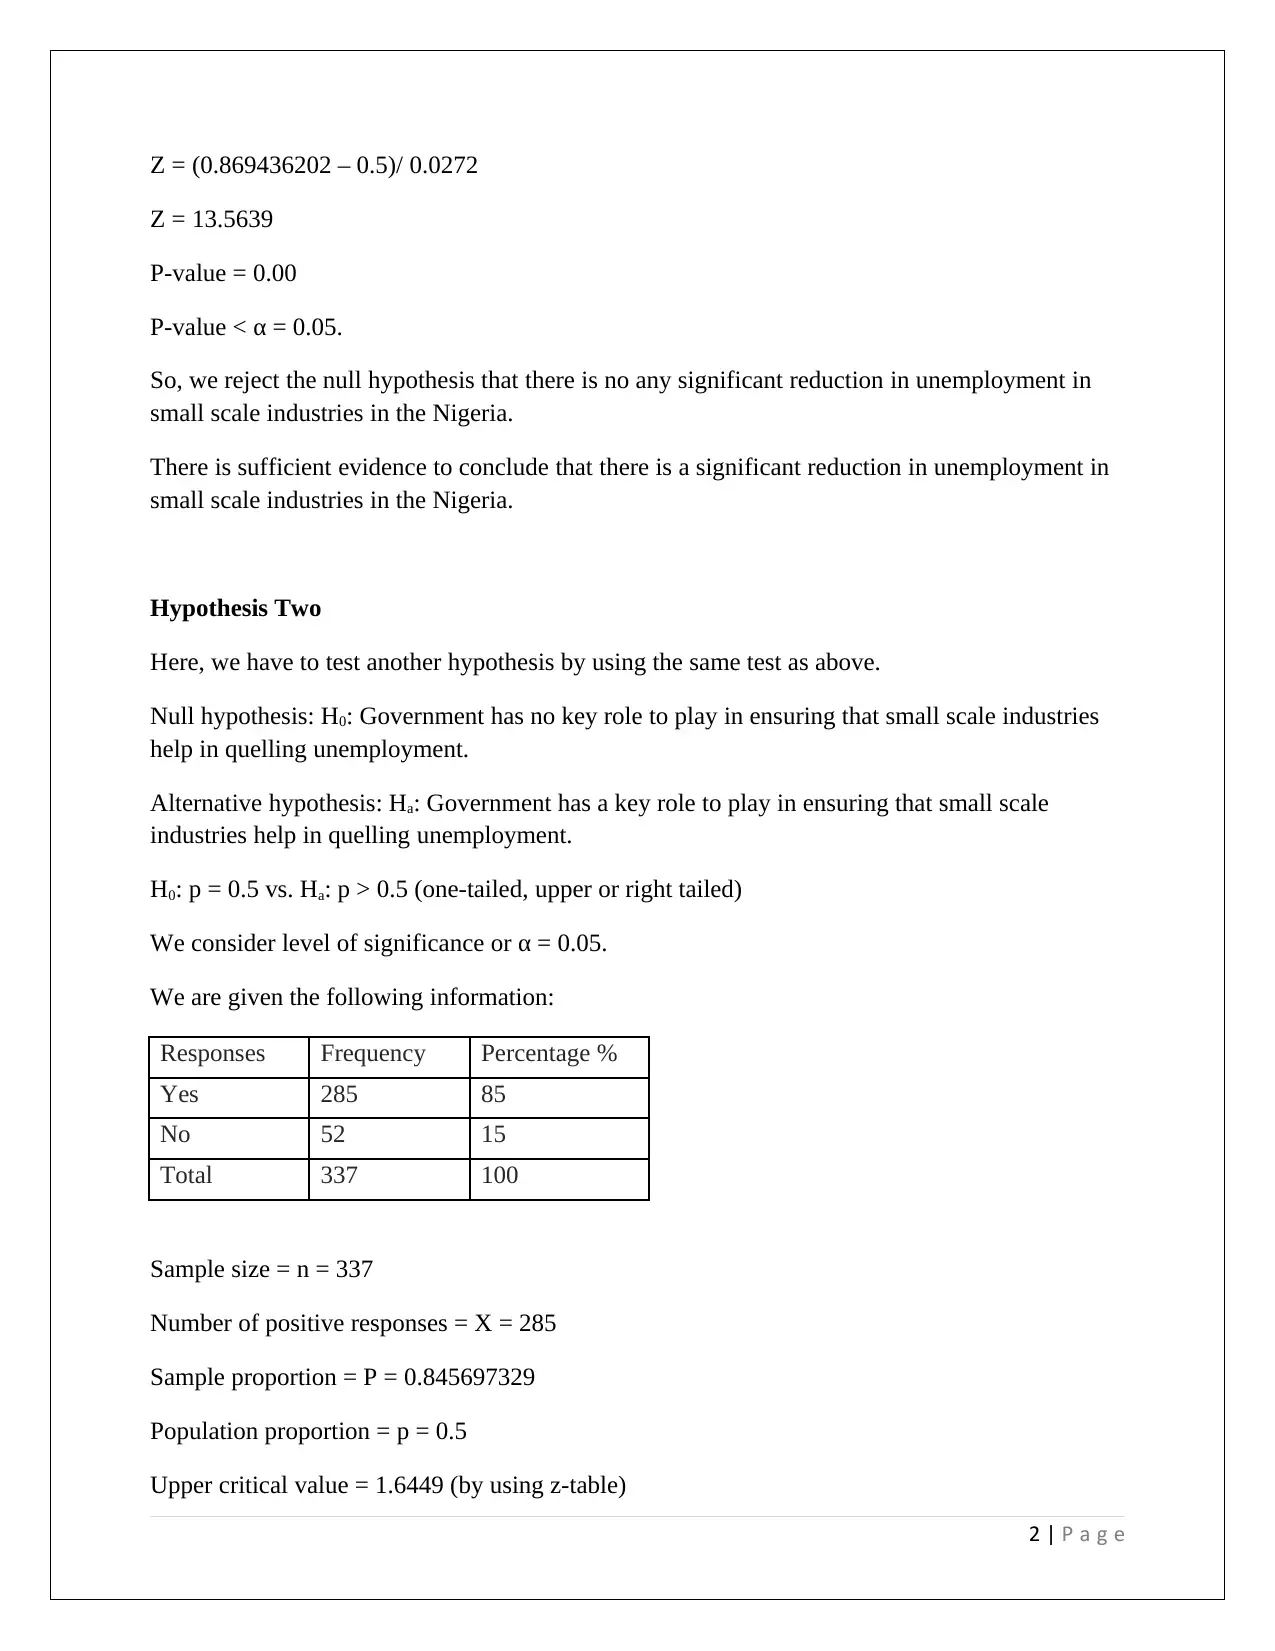
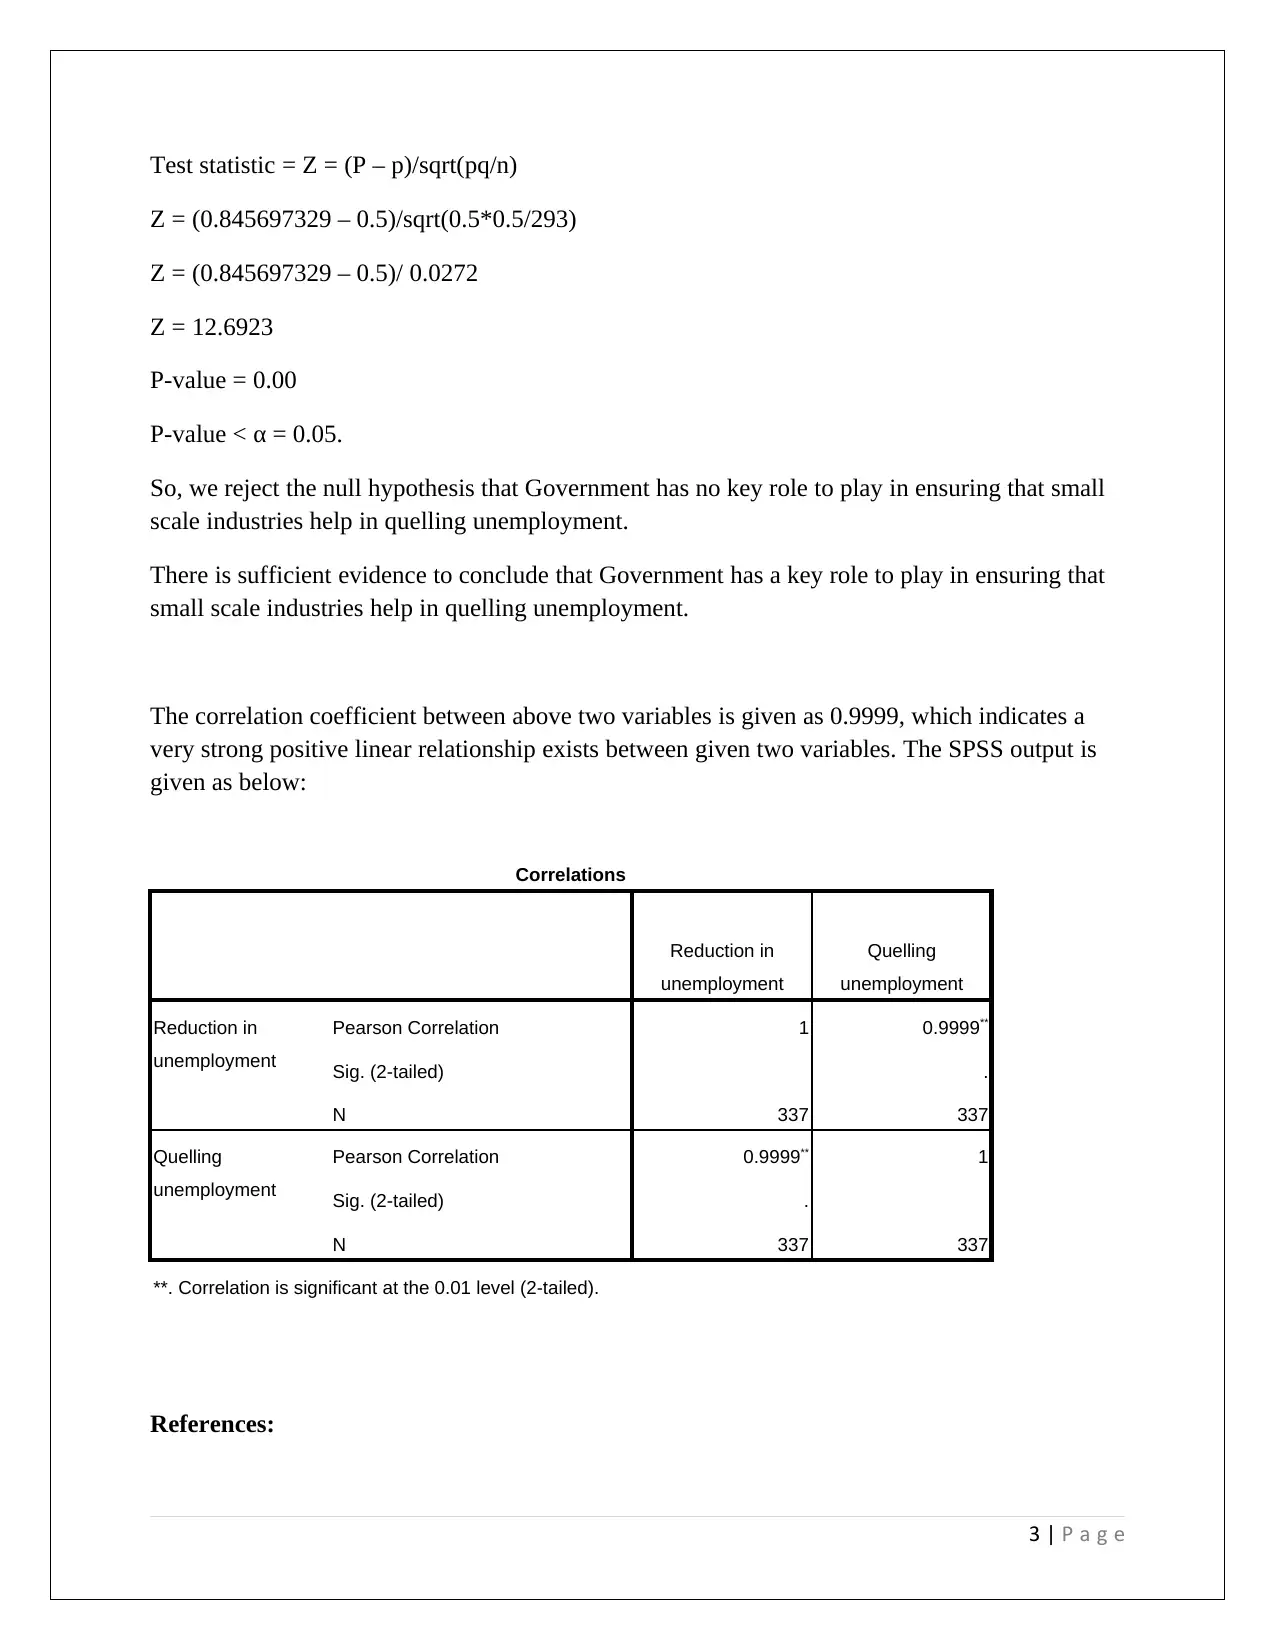
This assignment focuses on testing two hypotheses related to unemployment in Nigeria's small-scale industries. The first hypothesis examines whether there has been a significant reduction in unemployment, utilizing a z-test for population proportion. The analysis reveals sufficient evidence to reject the null hypothesis, concluding that there is a significant reduction in unemployment. The second hypothesis investigates the government's role in ensuring that small-scale industries help reduce unemployment, also using a z-test. The findings again reject the null hypothesis, indicating that the government plays a key role. A correlation coefficient of 0.9999 suggests a very strong positive linear relationship between the two variables. The assignment references several statistical texts to support its methodology and conclusions. Desklib provides this solved assignment and many other resources for students.
Document Page
Assignment Solution
Hypothesis One
Here, we have to use the testing of hypothesis for checking given two research hypotheses. First
we have to check whether there is any significant unemployment reduction in small scale
industries in Nigeria or not. If more than 50% responses for this question are positive, then we
can say that there is a significant reduction in the unemployment. This means, we have to check
whether the population proportion is more than 50% or not. For checking this claim or
hypothesis, we have to use z test for population proportion. The null and alternative hypothesis
for this test is given as below:
Null hypothesis: H0: There is no any significant reduction in unemployment in small scale
industries in the Nigeria.
Alternative hypothesis: Ha: There is a significant reduction in unemployment in small scale
industries in the Nigeria.
H0: p = 0.5 vs. Ha: p > 0.5 (one-tailed, upper or right tailed)
We consider level of significance or α = 0.05.
We are given the following information:
Responses Frequency Percentage %
Yes 293 87
No 44 13
Total 337 100
Sample size = n = 337
Number of positive responses = X = 293
Sample proportion = P = 0.869436202
Population proportion = p = 0.5
Upper critical value = 1.6449 (by using z-table)
Test statistic = Z = (P – p)/sqrt(pq/n)
Z = (0.869436202 – 0.5)/sqrt(0.5*0.5/293)
1 | P a g e
tabler-icon-diamond-filled.svg

Paraphrase This Document

Need a fresh take? Get an instant paraphrase of this document with our AI Paraphraser
Document Page
Z = (0.869436202 – 0.5)/ 0.0272
Z = 13.5639
P-value = 0.00
P-value < α = 0.05.
So, we reject the null hypothesis that there is no any significant reduction in unemployment in
small scale industries in the Nigeria.
There is sufficient evidence to conclude that there is a significant reduction in unemployment in
small scale industries in the Nigeria.
Hypothesis Two
Here, we have to test another hypothesis by using the same test as above.
Null hypothesis: H0: Government has no key role to play in ensuring that small scale industries
help in quelling unemployment.
Alternative hypothesis: Ha: Government has a key role to play in ensuring that small scale
industries help in quelling unemployment.
H0: p = 0.5 vs. Ha: p > 0.5 (one-tailed, upper or right tailed)
We consider level of significance or α = 0.05.
We are given the following information:
Responses Frequency Percentage %
Yes 285 85
No 52 15
Total 337 100
Sample size = n = 337
Number of positive responses = X = 285
Sample proportion = P = 0.845697329
Population proportion = p = 0.5
Upper critical value = 1.6449 (by using z-table)
2 | P a g e
Document Page
Test statistic = Z = (P – p)/sqrt(pq/n)
Z = (0.845697329 – 0.5)/sqrt(0.5*0.5/293)
Z = (0.845697329 – 0.5)/ 0.0272
Z = 12.6923
P-value = 0.00
P-value < α = 0.05.
So, we reject the null hypothesis that Government has no key role to play in ensuring that small
scale industries help in quelling unemployment.
There is sufficient evidence to conclude that Government has a key role to play in ensuring that
small scale industries help in quelling unemployment.
The correlation coefficient between above two variables is given as 0.9999, which indicates a
very strong positive linear relationship exists between given two variables. The SPSS output is
given as below:
Correlations
Reduction in
unemployment
Quelling
unemployment
Reduction in
unemployment
Pearson Correlation 1 0.9999**
Sig. (2-tailed) .
N 337 337
Quelling
unemployment
Pearson Correlation 0.9999** 1
Sig. (2-tailed) .
N 337 337
**. Correlation is significant at the 0.01 level (2-tailed).
References:
3 | P a g e
Document Page
Bickel, P. J. and Doksum, K. A. (2000). Mathematical Statistics: Basic Ideas and Selected
Topics, Vol I. Prentice Hall.
Casella, G. and Berger, R. L. (2002). Statistical Inference. Duxbury Press.
Ross, S. (2014). Introduction to Probability and Statistics for Engineers and Scientists. London:
Academic Press.
Todd, G. (2007). Descriptive Statistics. Topics in Biostatistics. New York: Springer.
4 | P a g e
chevron_up_icon
1 out of 4
circle_padding
hide_on_mobile
zoom_out_icon
[object Object]