Corporate Finance Project: WACC and Valuation of Bega Cheese

Verified

Added on  2023/06/05

|4
|674
|351
Project
AI Summary
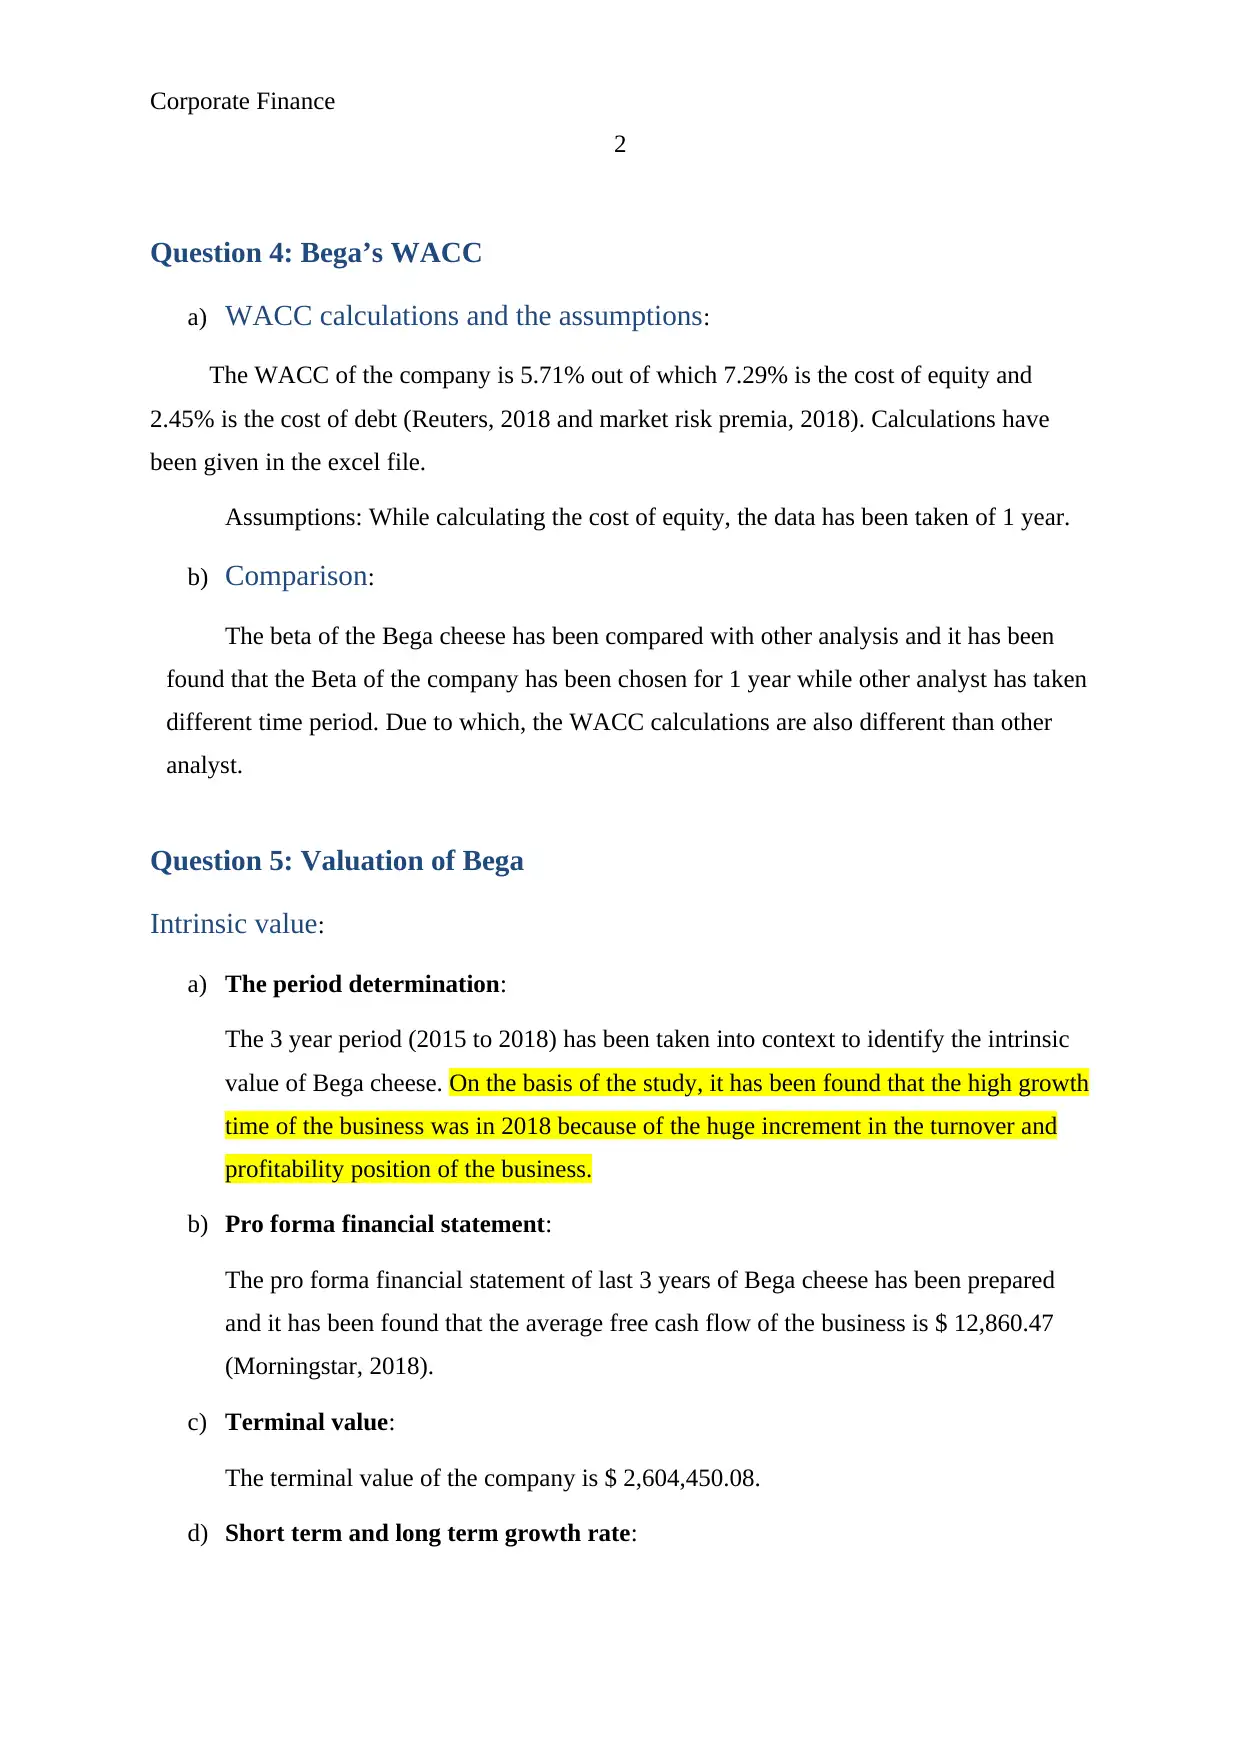
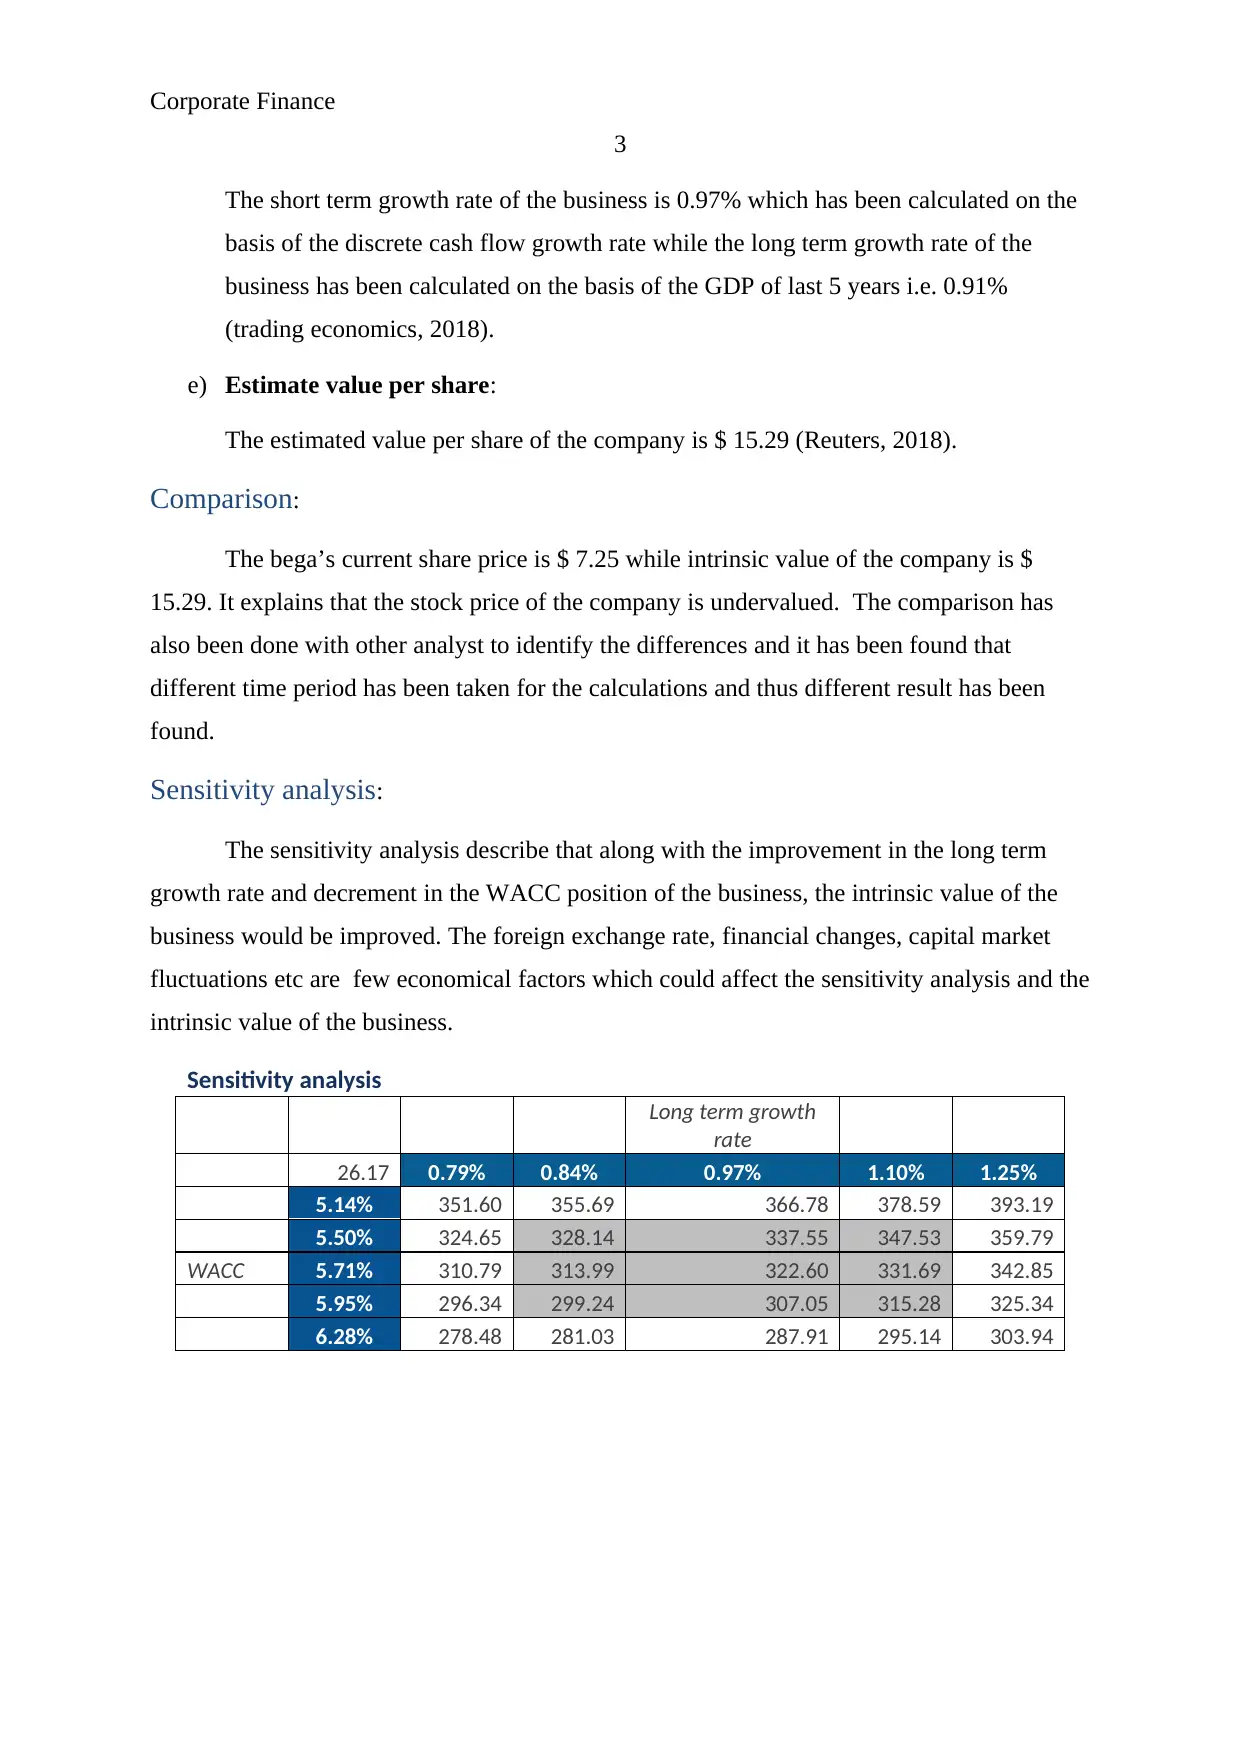
This corporate finance project report focuses on the valuation of Bega Cheese, calculating its Weighted Average Cost of Capital (WACC) and intrinsic value. The WACC is determined to be 5.71%, with a cost of equity of 7.29% and a cost of debt of 2.45%. The project utilizes a three-year period (2015-2018) to assess the intrinsic value, highlighting 2018 as a high-growth year. Pro forma financial statements reveal an average free cash flow of $12,860.47, with a terminal value of $2,604,450.08. Short-term and long-term growth rates are estimated at 0.97% and 0.91%, respectively, leading to an estimated value per share of $15.29, which suggests the company is undervalued compared to its current share price of $7.25. Sensitivity analysis indicates that improvements in long-term growth and reductions in WACC would enhance the intrinsic value. The analysis also acknowledges the impact of economic factors like foreign exchange rates and capital market fluctuations. The report concludes by referencing data from Trading Economics, Morningstar, Reuters and Market risk premia.
Document Page
Running Head: Corporate Finance
1
Project Report: Corporate Finance
tabler-icon-diamond-filled.svg

Paraphrase This Document

Need a fresh take? Get an instant paraphrase of this document with our AI Paraphraser
Document Page
Corporate Finance
2
Question 4: Bega’s WACC
a) WACC calculations and the assumptions:
The WACC of the company is 5.71% out of which 7.29% is the cost of equity and
2.45% is the cost of debt (Reuters, 2018 and market risk premia, 2018). Calculations have
been given in the excel file.
Assumptions: While calculating the cost of equity, the data has been taken of 1 year.
b) Comparison:
The beta of the Bega cheese has been compared with other analysis and it has been
found that the Beta of the company has been chosen for 1 year while other analyst has taken
different time period. Due to which, the WACC calculations are also different than other
analyst.
Question 5: Valuation of Bega
Intrinsic value:
a) The period determination:
The 3 year period (2015 to 2018) has been taken into context to identify the intrinsic
value of Bega cheese. On the basis of the study, it has been found that the high growth
time of the business was in 2018 because of the huge increment in the turnover and
profitability position of the business.
b) Pro forma financial statement:
The pro forma financial statement of last 3 years of Bega cheese has been prepared
and it has been found that the average free cash flow of the business is $ 12,860.47
(Morningstar, 2018).
c) Terminal value:
The terminal value of the company is $ 2,604,450.08.
d) Short term and long term growth rate:
Document Page
Corporate Finance
3
The short term growth rate of the business is 0.97% which has been calculated on the
basis of the discrete cash flow growth rate while the long term growth rate of the
business has been calculated on the basis of the GDP of last 5 years i.e. 0.91%
(trading economics, 2018).
e) Estimate value per share:
The estimated value per share of the company is $ 15.29 (Reuters, 2018).
Comparison:
The bega’s current share price is $ 7.25 while intrinsic value of the company is $
15.29. It explains that the stock price of the company is undervalued. The comparison has
also been done with other analyst to identify the differences and it has been found that
different time period has been taken for the calculations and thus different result has been
found.
Sensitivity analysis:
The sensitivity analysis describe that along with the improvement in the long term
growth rate and decrement in the WACC position of the business, the intrinsic value of the
business would be improved. The foreign exchange rate, financial changes, capital market
fluctuations etc are few economical factors which could affect the sensitivity analysis and the
intrinsic value of the business.
Sensitivity analysis
Long term growth
rate
26.17 0.79% 0.84% 0.97% 1.10% 1.25%
5.14% 351.60 355.69 366.78 378.59 393.19
5.50% 324.65 328.14 337.55 347.53 359.79
WACC 5.71% 310.79 313.99 322.60 331.69 342.85
5.95% 296.34 299.24 307.05 315.28 325.34
6.28% 278.48 281.03 287.91 295.14 303.94
Document Page
Corporate Finance
4
References:
Trading economics. 2018. Australia GDP. [online]. available at:
https://tradingeconomics.com/australia/gdp [accessed 14/9/18].
Morningstar. 2018. Bega Cheese. [online]. available at:
http://financials.morningstar.com/cash-flow/cf.html?t=BGA&region=aus&culture=en-US
[accessed 14/9/18].
Reuters. 2018. Bega Cheese. [online]. available at:
https://www.reuters.com/finance/stocks/overview/BGA.AX [accessed 14/9/18].
Market risk premia. 2018. Implied market risk premia. [online]. available at:
http://www.market-risk-premia.com/au.html [accessed 14/9/18].
chevron_up_icon
1 out of 4
circle_padding
hide_on_mobile
zoom_out_icon
[object Object]