Wireless Sensor Network Technologies in Building Services Report
VerifiedAdded on 2022/08/31
|33
|7757
|21
Report
AI Summary
This report presents a comprehensive study on the application of Wireless Sensor Network (WSN) technologies for temperature monitoring in building services, with a specific focus on the Internet of Things (IoT) in Hong Kong. The research explores the design and implementation of an IoT-enab...
Read More
Contribute Materials
Your contribution can guide someone’s learning journey. Share your
documents today.

WIRELESS SENSOR NETWORK TECHNOLOGIES FOR TEMPERATURE
MONITORING IN BUILDING SERVICES
WITH FOCUS ON THE INTERNET OF THINGS (IOT) IN HONGKONG
By Name
Course
Instructor
Institution
Location
Date
MONITORING IN BUILDING SERVICES
WITH FOCUS ON THE INTERNET OF THINGS (IOT) IN HONGKONG
By Name
Course
Instructor
Institution
Location
Date
Secure Best Marks with AI Grader
Need help grading? Try our AI Grader for instant feedback on your assignments.

ABSTRACT
The presented notion highlights a modified and enabled Wireless Sensing and Monitoring
Platform called Internet of Things (IoT) mainly at the building automation context for
scrutinizing the relative humidity, light and temperature. Most of the systems which have highly
developed a customized hopping technique are employed to monitor the transfer of data to the
receiver node from the transmitter node. On receiving the data, monitoring and recording is done
in an excel sheet in a personal computer by the help of GUI (Graphical User Interface) which is
designed in labVIEW. Vigorous development has also been made on the android application to
enable the transfer of data to a smartphone from the labVIEW to allow remote monitoring of
data.

Contents
ABSTRACT....................................................................................................................................................2
ACKNOWLEDGEMENT.................................................................................................................................3
DECLARATIONS............................................................................................................................................4
List of Tables............................................................................................................................................4
List of figures...........................................................................................................................................4
INTRODUCTION...........................................................................................................................................5
AIMS AND OBJECTIVES................................................................................................................................7
LITERATURE REVIEW....................................................................................................................................7
Overview of the smart home overview...................................................................................................8
Services of Smart Homes.........................................................................................................................9
Home conditions measurement..........................................................................................................9
Management of Home Appliances........................................................................................................10
METHODOLOGY.........................................................................................................................................10
Description of the System and Data Acquisition in Experimental Work................................................10
Node......................................................................................................................................................11
Sensor....................................................................................................................................................12
Micro-controller....................................................................................................................................14
Wireless Trans receiver.........................................................................................................................14
Consideration for the installations of WSN............................................................................................16
Graphical User Interface........................................................................................................................17
Android Application...............................................................................................................................18
RESULTS AND DISCUSSIONS......................................................................................................................19
Findings and disposition from the conducted experiments...............................................................19
The results of repeater node and sensor battery voltage......................................................................20
CONCLUSIONS AND RECOMMENDATIONS FOR THE FUTURE WORK........................................................24
REFERENCES..............................................................................................................................................25
APPENDICES..............................................................................................................................................26

ACKNOWLEDGEMENT
It is of common knowledge that a project can only be regarded complete when it is supplemented
by words of encouragement. And for that I’m totally obliged to Mr.………………… for being of
great help to the team in providing the correct path and relative suggestions throughout the entire
project. I may lack the exact words to express my thanks to him but I greatly submit to his help,
for he provided the vigorous effort in the endeavor, observing a close interaction in every step I
made and providing me with the necessary advice at every stage of the project development. Let
me pass my gratitude to those whom I have interacted with for their contribution and the
responsibilities they have observed.
Secure Best Marks with AI Grader
Need help grading? Try our AI Grader for instant feedback on your assignments.

DECLARATIONS
I declare that this particular is my own original work and has never been used in the award of degree
or masters in any University.
List of Tables
Table 1: Consumption of current by Sensors
Table 2: Consumption of current by microcontrollers
Table 3: Voltage and current Modules
Table 4: A table of reliability of data transmission
Table 5: A table showing duration of various states of wireless sensor node
Table 6: A table showing the sensor node calculation
List of figures
Figure 1: Figure showing a block diagram for the proposed system
Figure 2: Figure of the suggested wireless sensor node
Figure 3: Graphical User Interface
Figure 4: A figure showing results of temperature humility and light.
Figure 5: Transmission and sensing methodology

INTRODUCTION
The Internet of Things (IoT) is also said to be physical objects’ network and comprises of electronics,
software and sensors with inter-relational communication between them together with the users of the
system. IoT has shown rapid evolution following the convergence of technologies applied in
communication, information as well as the internet. It has a number of applications even within the
urban context one being smart building which assures an improvement in the standards of living of
the inhabitants with the help of improvised technology in communications and information. With
smart building, some of the services of augmented superiority include management in the quality of
air to improve the a better condition of the environment and reduce pollution effects, and to facilitate
public buildings to minimize the efforts applied by human beings and also to lower the amount of
energy consumed in the process (Tang et al.2016).
Intensive efforts have been implemented with the help of Wireless Sensor Network (WSN) to
monitor the microclimate conditions. Authors have given in their reports on monitoring the quality of
air indoor through estimating the levels of pollution for the environments within the houses of
residents while in some of their reports they have given information concerning energy autonomy for
sensor node. In the current life state, human beings encounters a lot concerning the parameters of the
environment including humidity, light and temperature and they stab to adjust manually. WNS has
made monitoring of such parameters easier and at the same time has improved the suitability of the
system with no great changes in the infrastructure. For home automation which is a section of
building automation, the monitoring system provides security and comfort to the individuals and also
energy saving mechanisms through taking a close observation at the amount of energy consumed in a
day (Abuarqoub et al.2017).

A section of this paper also discusses an integration system for the IoT and home monitoring system,
another part also provides a discussion on the monitoring system based on WSN to evaluate the
effectiveness of elderly through scrutinizing their day to day operations. In other sections, authors
provide a discussion on the developed middleware for intellect ambient applications like home
automation. In addition to that, other discussions concerning control system and smart power
monitoring system for household appliances are highlighted in other sections which are still under
building automation.
This thesis suggests a more developed IoT with enabled Wireless Sensing and Monitoring Platform
(IoT-WSMP) that takes a close observation on the essential environmental building automation
parameters including light, humidity and temperature in Hongkong. LabVIEW provides a
development platform for Graphical User Interface (GUI) that avails a graph for persistent recording
and monitoring of data concerning environmental parameters. The data which have been recorded
may be used later for extended analysis and to control the building environment. The local
application, android, is of much importance for remote monitoring. On receiving the data, monitoring
and recording is done in an excel sheet in a personal computer by the help of GUI (Graphical User
Interface) which is designed in labVIEW. Vigorous development has also been made on the android
application to enable the transfer of data to a smartphone from the labVIEW to allow remote
monitoring of data (Paiz et al.2010).
This thesis follows a specific structure, that is, first section presenting the structure of the projected
WSN as well as the mechanism applied for the transmission and sensing of data. Closely following is
the section that presents findings to the conducted experiments as per the validation and
implementation of the proposed system at development stage. The paper then concludes by
discussing probable on latent imminent activities.
Paraphrase This Document
Need a fresh take? Get an instant paraphrase of this document with our AI Paraphraser

AIMS AND OBJECTIVES
To generate a customized IoT enabled wireless sensing and monitoring platform (IoT-WSMP)
which is capable of monitoring temperature, light and humidity as the key parameters in
building services automation in Hongkong.
To develop a Graphical User Interface (GUI) capable of providing a graph to be used in
monitoring as well as recording data in the LabVIEW.
LITERATURE REVIEW
Internet of things, classic smart home, cloud computing as well as processes sing of rule-based
events have been identified as the building blocks of the of the advanced smart home which is
basically an integrated compound. The practice is not only limited to Hongkong but it is being
practiced in mot arts of the world. Each and every component that has been highlighted contributes
its crucial technologies as well as attributes to the composition which has been proposed. There is
contribution of the internet connection by the IoT . This component is also responsible for the remote
management of the appliances which have been identified as mobile and this is the reason of its in
cooperation by several sensors. It is possible to have an attachment of the sensors to the appliances of
home including lights, air-conditioning as well as other devices used for the environment.
It is also responsible for embedding the system of the computer intelligence into the devices of
home. This implies that it is responsible for the provision of mechanisms of measuring conditions of
homes as well as assists in monitoring the functionality of the home appliances. Through cloud
computing, there would be provision of scalable computing power, its applications as well as spaces
of storages. These are meant for the development, maintenance as well as running of home services
hence leading to ease of access to the devices of homes at any time anywhere. The event processes
system which is actually rule-based assist in the provision proper control as well as orchestration of

the whole composition of the advanced smart homes. The combination of the technologies so as to
get the product as a breed has been appearing already in most of the literature work done by most of
the scholars.
Overview of the smart home overview
Scholars have defined smart home as an extension of residential building automation. This involves
automation as well as control of all the embedded technology. The defined residence therefore
possess lighting, appliances, air conditioning, heating, computers, systems of entertainment, TVs , big
appliances of home like freezers and washers, camera systems and security capable of being
controlled remotely and communicating with each other. The remote control can be achieved by the
use of mobile or internet. Such kind of the systems is made up of the sensors as well as switches
whose connections are done to the main hub. The hub is under the control of the home resident by the
use of terminals which are wall-mounted. In some cases, the control can be achieved by the use of
mobile units which have been connected to the services of internet cloud (Anthopoulos 2017).
There is provision of security, low cost of operations, energy efficiency as well as convenience by the
smart homes. When the smart products are properly installed, there is provision of convenience and
this goes alongside savings of money, time and energy. Such kinds of the systems are known to be
adjustable besides being adaptive to meet the changes on the needs which are basically progressive.
This implies that the infrastructure that is used in most of the cases is very flexible. The flexibility
aspect is of advantage considering that it can effectively assist in the integration with other sample
devices obtained from various standards and providers.
Through the basic infrastructure of homes ‘architecture, it is possible to have all the measurements of
the conditions of homes taken as per the architecture. Also processing of the data which has been
instrumented while at the same time using sensors considered to be micro-controller enabled. Such

kind of the sensors will be used in the measurement of the conditions of homes and their
corresponding actuators are considered to be effective in the home monitoring in the same embedded
devices. The presented notion highlights a modified and enabled Wireless Sensing and Monitoring
Platform called Internet of Things (IoT) mainly at the building automation context for scrutinizing
the relative humidity, light and temperature. Most of the systems which have highly developed a
customized hopping technique are employed to monitor the transfer of data to the receiver node from
the transmitter node (Akcin et al.2016).
The penetration as well as the popularity of the concept of smart homes has been growing in the past
at a relatively better pace. It has since formed part of the cost reduction as well as modernizations in
the process. The achievement of the same process is through having embedding capability in the
maintenance of events which are centrally logged, execution of the learning processes by the use of
the machines hence the main cost of the elements are provided. In the long run, there is savings of
the other useful reports and recommendations.
Services of Smart Homes
Home conditions measurement
A typical home is considered to be smart is usually equipped with a set of sensors that are responsible
for the measurement of the conditions of homes including light, humidity, proximity and temperature.
Each and every sensor has been assigned to the specific measurement required. Humidity as well as
temperature can be possibly measured by the use of one sensor. In some cases, there are sensors
which are capable of calculating the light ratio for a specific area is while doing the same comparison
with the object distance as it is exposed. Nearly all the sensor can allow the storage of data and its
visualization. This will enable the user to have it viewed anywhere and at the convenient time. In
order to have this specific objective achieved, there must be incorporation of the processer of the
Secure Best Marks with AI Grader
Need help grading? Try our AI Grader for instant feedback on your assignments.

signals, an interface for the communication and finally a host which has been anchored on the cloud
infrastructure.
Management of Home Appliances
This is equivalent to the creation of the cloud services which are responsible for the appliances
management which will be later hosted in the infrastructure of the clouds. The service of the
management will enable the user responsible for the control of the smart actuators output which are
closely related with the appliances of homes like in the case of the fans and lamps. The devices such
as switches as well as valves are the smart actuators. They are responsible for the performance of the
functions like adjustment of the operational systems and turning things off and on depending on the
requirements of the user (Klett and Wang 2014). A Variety of functionalities are provided by the
actuators including having the components on/off in their services, modulation in the control of the
flow changes, positioning to the percentage opening. This extends to the provision of the emergency
shutdowns which are commonly known as ESD. In order to have activation of the actuator in place,
a written command which is digital in nature will be given to the actuator. The internet thing is
commonly refered to as IOT is a paradigm of devices with connection to the internet. The objects
considered to be devices include actuators and sensors.
METHODOLOGY
Description of the System and Data Acquisition in Experimental Work
The composition of the suggested IoT – WSMP include a receiver (sink) node, repeater node and a
transmitter node as displayed in the figure below. The sensing system offer communication in only
one direction at a time, i.e., to the receiving node from the transmitting node and is capable of
containing big number of repeater nodes if need arises for wide area coverage. Also, the suggested
system employs the use of custom hopping mechanism to offer transmission over many nodes. The

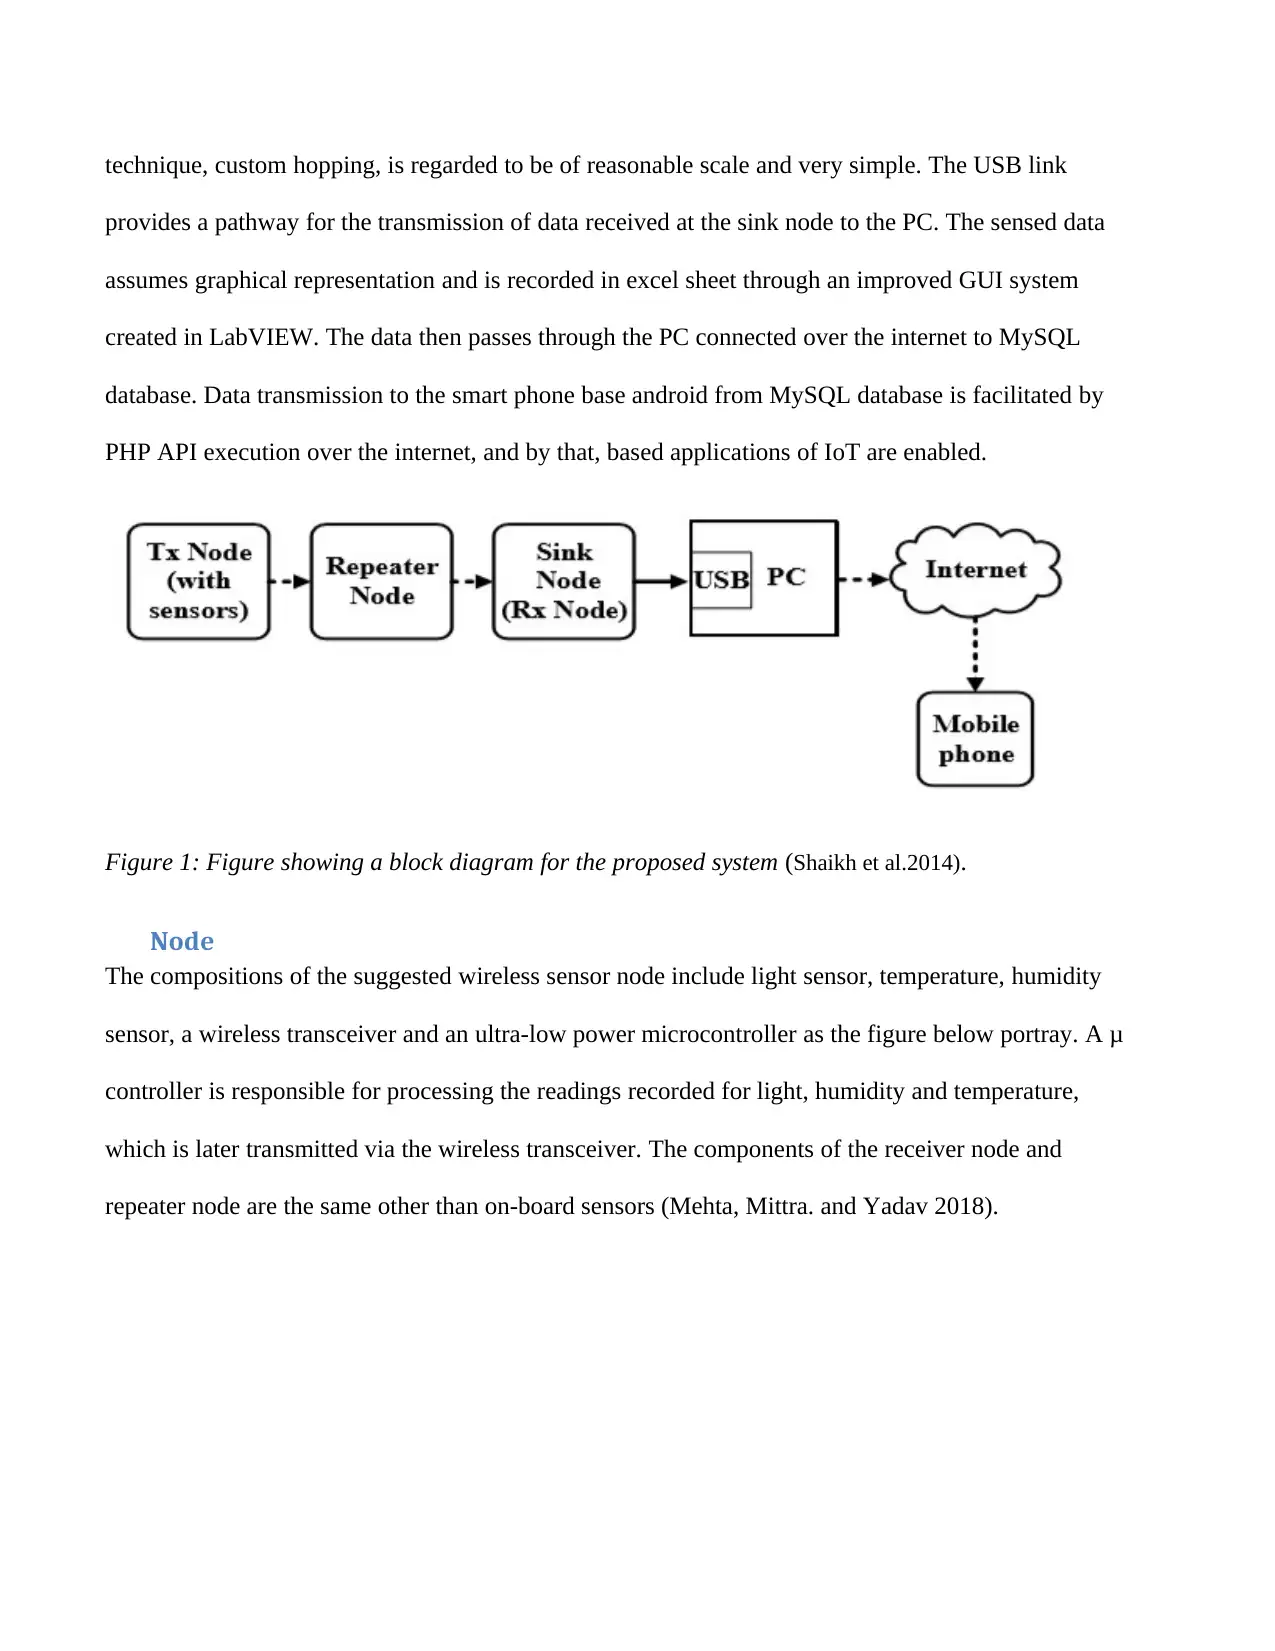
technique, custom hopping, is regarded to be of reasonable scale and very simple. The USB link
provides a pathway for the transmission of data received at the sink node to the PC. The sensed data
assumes graphical representation and is recorded in excel sheet through an improved GUI system
created in LabVIEW. The data then passes through the PC connected over the internet to MySQL
database. Data transmission to the smart phone base android from MySQL database is facilitated by
PHP API execution over the internet, and by that, based applications of IoT are enabled.
Figure 1: Figure showing a block diagram for the proposed system (Shaikh et al.2014).
Node
The compositions of the suggested wireless sensor node include light sensor, temperature, humidity
sensor, a wireless transceiver and an ultra-low power microcontroller as the figure below portray. A μ
controller is responsible for processing the readings recorded for light, humidity and temperature,
which is later transmitted via the wireless transceiver. The components of the receiver node and
repeater node are the same other than on-board sensors (Mehta, Mittra. and Yadav 2018).

Figure 2: Figure of the suggested wireless sensor node (Shaikh et al.2014).
Configuration for the aggregation and sensing of data on the node is done by a customized code of
software which relies on the application. To add on to that, customized technique of voting is
employed to supplement on the reliability of data. The proposed algorithm help in minimizing the
ambiguity of the data to some level as discussed in a section of this paper. The required power for the
system, repeater node and wireless sensor node is provided by two AA batteries, while the USB
interface ensures power provision to the receiver node connected to the PC.
Sensor
The on-board humility bas well as temperature sensor which had been marked as SHT11 assist in the
provision of a digital output which is fully calibrated and it is normally treated as a golden standard.
The results obtained from this particular system are subjected to verification with other results from
the various standard instruments in the conditions o the laboratory. The operating range temperature
of the sensor within -400C to the errors of -+ 123.80C for the temperature values. In the case of the
Relative Humidity which is commonly refered to as RH, the values of the accuracy ranges for -
+0.40C in measurement of the degree of hotness or coldness of a place (Niu et al. 2015)
Paraphrase This Document
Need a fresh take? Get an instant paraphrase of this document with our AI Paraphraser

Similarly, the variation of the relative humidity was stagnated at -+ 0.3% as for the values of relative
humidity. These kinds of the measurements have been found to be very crucial as far as the
applications are concerned indoors. The operating voltage range of the sensor had been marked to be
between 2.4 and 5.5V. The usage will thus target applications of low power. Part of the properties of
this particular sensor is that it possess very fast-time response (Huang, and Niu 2015). In the real sense,
it will require an average of 11ms to be in a state considered to be active. After each and every
measurement has been done, it will switch automatically to the sleeping mode with the last
requirements of the currents. Also in possession of this particular sensor is a two wire serial interface
with the resolution of 14bits in the case of the temperature measurement and 12bit in the case of the
humidity measurements (Shah, and Yaqoob 2016).
Table 1: Consumption of current by Sensors
Secondly, there is a TSL2561 sensor on board which has been obtained from TAOS. This particular
sensor is responsible for the measurement of the intensity of light into a digital output. The
measurement is thus given through 12C interface (Tadokoro et al.2014). The voltage of the operation
ranges from 2.7 to 3.6 V. Also the intensity of light is measured from 0.1 to 30,000 lux. It is possible
to utilize the two diodes which are found internally for the case of infrared as well as visible light
conditions. The output in the sensor which is also known to be 16 bit ADC is just enough for the
applications indoors. The actual intensity value is usually gotten from the digital values with the aid

of formulas of empirical multiplications. The current consumption has therefore been summarized in
table
Micro-controller
The PIC24F16KA102 micro- controller which was on board was basically a 16 bit micro-controller
from the Microchip. This particular micro-controller was having very low consumptions of power in
the context of XLP technology. In fact it was only capable for the consumptions of nano watts of
power. It is capable of running under various management modes of power including idle, run, doze,
sleep as well as deep sleep (Bulut et al.2016). This has made it to be ideal for running algorithms of
low power in the applications of WSN. The range of voltage for the operations was set from 1.8V to
3.6V. In the table shared below is a summary of the consumption of current in the case of the
μcontroller for various operation states.
Table 2: Consumption of current by microcontrollers
Wireless Trans receiver
In the case of the required radio unit for the node of sensor, there was use of nRF24L01 from Nordic
which is usually ultra-low power. The operation of this particular type of the transreciever is from
1.9V to 3.6V at 2.4-2.5 GHz ISM band (Rahmani et al.2018). This is the reason why it was capable
for the satisfaction of the applications indoors. The interfaces of the transreciever with the μcontroller
were achieved through Serial Peripheral Interface (SPI) which is 4-wired. The modes of applications
were equally varying in the case of the operation of modes with Transmitter (TX) types. The other
interfaces included two Standby modes as well as a Power Down mode and finally there was

Receiver (RX) mode. The power consumption for every operation mode has been given in the form
of summary as per the provisions in the table 1.
Also as per the diagrams shared below, the operations of the transreciever take place in the form of
Enhanced Shock Burst modes and Shock Burst. The receiver will be expected to send the
acknowledgement to the transmitter in the case of the Enhanced Shock Burst mode. This should take
place immediately the data is received (Cabra et al.2017). The process of data loss can therefore be
detected effectively. In the case of the Shock Burst, there is automatic generation of the CRC and
preamble data packets. Similarly, unlike the case of Enhanced Shock Burst mode, there is elimination
of the requirement of 9 flag bits and this subsequently leads to the reduction of the required memory
(Bulut et al.2016). In addition, there is lower data rate in the case of the Shock Burst mode which is
characterized with the reduced consumption rates of the average current. The proposed work
therefore utilized the option of the Shock Burst mode. It is possible to properly configure nRF24L01
transceiver that it can receive data from various proposed six systems by the use of just two pipes.
The use of two pipes was however very consequential i.e between the receiver node and repeater is
pipe-1 while pipe-0 is between the repeater node and the transmitter (Coates, Hammoudeh, and
Holmes, 2017).
Table 3: Voltage and current Modules
Secure Best Marks with AI Grader
Need help grading? Try our AI Grader for instant feedback on your assignments.

The transreceiver, μcontroller as well as sensors which have been selected above assist in the
provision of benefits of operating every concept within a single value of voltage of 3.0 V. This
implies that there will be no need to perform or carry out a conversion of DC- DC which is usually
very expensive.
Consideration for the installations of WSN
It has been confirmed by various scholars that the installation processes of the wireless sensor nodes
usually suffer from much less constraints in locations. This is due to the fact that use of wire has been
completely eliminated particularly in the case of the retrofit projects within the building which have
overstayed. The installation of the wireless sensors can be done n near or in the line of discharge of
air diffuser so that it can assist in the measurement of the flow air temperatures (Kolokotsa 2016).. In
some cases, they are deployed near the occupants so that they can effectively reflect the actual micro-
climate around the occupants. By so doing, it implies that there are no mechanical retrofits and the
occupants are therefore subjected to very minimal interference.
It is important to note that the WSN can be susceptible to the radio frequencies which are commonly
refered to as RF as a result of the indoor experiments (Oliveira & . Rodrigues. 2011).). The RF results
from the other forms of networks which are wireless but have the same frequencies bands. Some of
them include microwave ovens, broadband transmitters, wireless telephones, walkie-talkies as well as
other devices which are unwired. The strength of the signal is also likely to be affected by the
presence of the obstruction. Some of the potential obstacles which are known to be capable of
causing meaningful, obstruction include the brick walls as well as steel plates (Ngai et al.2017). This
simply means that the wireless installation must consider in all parameters the environment of the
operation with the focus being avoiding the possible sources which can affect the data transformation.
The accessibility of the WSN should be possible regardless of the location of the building. Whether

the building is within a bad site or a good site, it should be able to serve its primary purpose. The
location of the sensor node should be determined through the site survey or what is basically referred
to as the site measurements.
Graphical User Interface
The figure below shows how the development of a graphical panel of GUI made in LabVIEW occurs.
Presentation of data assumes both numeric and graphical forms. Virtual Instrument Software
Architecture (VISA) API acts as an interface that links the Lab-VIEW and the sink node. VIS has
proved to be a high quality input – output API which is very vital for instrumentation programming.
It acts as a platform for programming, configuring as well as troubleshooting systems of
instrumentation such as PXI, GPIB, serial VXI, and Ethernet together with USB interfaces (Grindvoll
et al.2012). VISA is mostly espoused since it does not depend on the internet. The storage of the
monitored data is done in excel sheet displaying the present date and time. At the front page, an
interface is provided that enable the user to configure the setup of the system and interrupt the system
setup according to the will. Structuring of the program is done in a manner that the storage done by
the excel sheet is the actual sensing time rather than delayed time.

Figure 3: Graphical User Interface (Chandra et al.2017)
Android Application
Android Application
Paraphrase This Document
Need a fresh take? Get an instant paraphrase of this document with our AI Paraphraser

Android Application
Additionally, to facilitate the operation of IoT, transmission of monitored data occurs over the
internet from Lab-VIEW to MySQL database. Execution of PHP API also occurs over the
internet server. It hooks up with MySQL database and later presents the data in a plain page of
HTML in Java Script Object Notation (JSON) as per the defined query within it. Development of
android application is done by Java within the Eclipse IDE. The consent of connection to the
internet is provided to enable it connect to the Wi-Fi (Rghioui, and Oumnad 2017). Obtaining
data within the database (fitted in MySQL) on the mobile phone can be achieved by developed
android application on the mobile phone. On clicking the android program, a connection is made
to the URL of PHP API, and for that, a connection is made for the PHP API to the database
which in turn returns the data to the mobile phone. A developed android application is indicated
by the screen shot shown in the figure above. A test on the developed android application is done
by the smartphone built on android 4.3.
RESULTS AND DISCUSSIONS
Findings and disposition from the conducted experiments
Validation of the suggested system is done by conducting a number of experiments within the
laboratory. The experiments which were conducted in ten distinct environments portraying
different intensities of light, results of same number for the TSL2561 sensor were recorded and
the same number of results for lux meter from Metravi, 1330 was recorded manually. Taking the
reading observed in lux meter as the exact value, the maximum and the minimum which were
obtained in relation to the error were 10.68% and 1.74% in that order. A conclusion can then be
drawn that the reading observed as per TSL2561 closely agree with the exact values.

The proposed system is deployed within the laboratory with both the nodes, router node and
sensor node placed in the same room with same conditions but a separation distance of around
4.75m apart, while the sink node is placed in another room together with router node but at a
separation distance of 3.75m apart, to ensure that there is a wall separation between them thereby
creating the exact environment just as for the case of buildings (Othman & Shazali 2012).
The deployment diagram below indicates the results filtered for IOT implement depending on
monitoring system for duration of one hour. The temperature results were provided in degree
Celsius, while the relative humility was given in percentage and lux for light. The reliability
being obtained using data transmitted from TX node at an interval of about 12 seconds while the
data is being received from RX node. When considering this deployment, reliability got is about
99.6 percent, within 1000 data in the RX node while996 data are being correctly received as per
the illustration in the table below.
Table 4: A table of reliability of data transmission

Figure 4: A figure showing results of temperature humility and light.
The results of repeater node and sensor battery voltage
The sensor node together with repeater node battery voltage is being measured by application of
mul-timeter at an hour interval over duration of about thirteen hours (Meyer 2005). The figure
above showed drop out of battery voltage which was very high initially while after a specific
duration it become 0.01 V for every hour, having the occasional reading of about 0.02v in a
period of time. The initial and final battery voltage was observed over a duration of about
thirteen hours indicates that battery dropout router node voltage if higher as compared to that
from transmitter node (Xue et al.2015). The repeater node higher usage of power is due to the
methodologies applied in transmission and those which were used in getting higher reliability.
The battery voltage of the sensor node after duration of thirteen hours is observed to be at 2.89V
indicating a drop of 0.51V within that stipulated time when the discharging 1200 mAh battery
has a total energy consumption of 7956mJ. To approximately evaluate the lifespan of the node,
0.7V is taken as the overall drop in voltage at which the reliable operation of the battery stops.
An estimate life span of the sensor node is evaluated by the consumed energy of the transmitter
node at a voltage of 0.7V and a current of 1200 mAh divided with the average amount of power
used, and is estimated to be around 20 hours. Considering the diagram above and the estimated
Secure Best Marks with AI Grader
Need help grading? Try our AI Grader for instant feedback on your assignments.

value, the lifetime of the battery can be prolonged by escalating the state duration S1.
Transmission and sensing methodology
The WSN node operation comprises of two steps that is sensing and transmission. As per the
illustration in the table below, the various states of individual component s are shown clear. In the
raw towards the bottom of the table below indicate time duration in which all the modules are in the
active states. The best example is the first state, where the microcontroller is very active within one
ms, while all other modules (Nrf24l01, SHT11, TSL2561) are all within the sleep state. The states
geographical presentation is also shown in the diagram below, which portraying the duration of time
as well current use of the sensor node in various states. Therefore, offering an intuitive representation
of enhancing sensor node operation based on power requirement applications.
Figure 5: Transmission and sensing methodology (Shaikh et al.2014).
The first thing to be done is to switch on the power automatically so as to ensure that the transmitter
node is within the state S1, in which it sojourns for about 1ms (Hwang, Kim, and Rho 2016). The

program of the node is done in a manner that it enters state S2 immediately. Then it maintained its
state S2 for about 400 ms, during this period SHT11 is set up and the data is being written in the μ
controller memory. The state S3 duration is also about 400 ms an d at the same period setting up of
TSL2561 is done. While the data intensity is measure and the sensor is within a standby node.
Immediately after about a minute, the states from S2 to S6 are being replicate two times in state S7.
Within S7 state, after writing of the three data set to the μ controller memory, algorithm voting is
done so as to ensure that all the anomalies are remove if may exist. This help in enhancing the data
reliability as the result being shown in a section of the table below.
Table 5: A table showing duration of various states of wireless sensor node
In most case, reliability is being enhanced at slightly higher power usage as discussed within the
results of the experiments. However, using the sensing and transmission scheme above increase the
quantifying possibilities as far as time and power concern in different WSN states at ease. Therefore,
there is provision for a scope for further optimization for future consumption. The best example is S1
is stretched in the period of the sleep node; the average power deployed is decreased, so as to ensure
the life of the battery is prolonged. Therefore, give a clear explanation together with qualified
experimental results (Shaikh et al.2014).
Each sensor node individual module is being is measured using a specific module that has been kept
active within a fixed period while the current was obtained using a standard digital setup of
multicenter. The power calculation of the sensor node is shown in the diagram below. For every state,

the last time value is obtained using multiplication and repetition of time. A good example is for state
S2 in which the final time value is 0.4 second multiplied by three. The varying state energy is being
computed by total current multiplication, voltage together with final time value. The total energy is
taken from the sum of energy of all the states of the node while calculation of the total time is
computed by adding final time value for the states which is 5.4 seconds. The average sensor node
power is calculated by dividing the total energy and the total time duration, where the result was
found to be 43.25Mw
Table 6: A table showing the sensor node calculation
CONCLUSIONS AND RECOMMENDATIONS FOR THE FUTURE WORK
The developed system of the IoT-WSMP used in monitoring of the temperatures, light as well as
relative humidity with double hopping has been implemented successfully and validated in the
environment of the building services. The power consumption was averagely kept at the node of the
transmitter was at 43.25 mW. An optimized level of reliability of about 99.6% was obtained through
the method of customized double hopping. There was testing of the developed applications of android
on the smart phones which were of the capacity android 4.3. It is possible to further reduction in the
Paraphrase This Document
Need a fresh take? Get an instant paraphrase of this document with our AI Paraphraser

consumption of power through the concepts of algorithms, optimization s of the hardware’s as well as
techniques of coding. Such kinds of the improvements will however be dependent on the specific
applications of the research work and hence it can be specifically being left for the future work.
techniques of coding. Such kinds of the improvements will however be dependent on the specific
applications of the research work and hence it can be specifically being left for the future work.


REFERENCES
Abuarqoub, A., Abusaimeh, H., Hammoudeh, M., Uliyan, D., Abu-Hashem, M.A., Murad, S.,
Al-Jarrah, M. and Al-Fayez, F., 2017, July. A survey on internet of things enabled smart campus
applications. In Proceedings of the International Conference on Future Networks and
Distributed Systems (p. 50). ACM.
Akcin, M., Kaygusuz, A., Karabiber, A., Alagoz, S., Alagoz, B.B. and Keles, C., (2016), April.
Opportunities for energy efficiency in smart cities. In 2016 4th International Istanbul Smart Grid
Congress and Fair (ICSG) (pp. 1-5). IEEE.
Anthopoulos, L., (2017). Smart utopia VS smart reality: Learning by experience from 10 smart city
cases. Cities, 63, pp.128-148.
Bulut, M.B., Hills, P., Mah, D., Stigson, P. and Wallin, F.( 2016). A comparative study of key stakeholder
views on smart homes in Hong Kong and Sweden.
Cabra, J., Castro, D., Colorado, J., Mendez, D. and Trujillo, L., 2017, June. An IoT approach for
wireless sensor networks applied to e-health environmental monitoring. In 2017 IEEE
International Conference on Internet of Things (iThings) and IEEE Green Computing and
Communications (GreenCom) and IEEE Cyber, Physical and Social Computing (CPSCom) and
IEEE Smart Data (SmartData) (pp. 578-583). IEEE.
Chandra, A.A., Jannif, N.I., Prakash, S. and Padiachy, V., 2017, August. Cloud based real-time
monitoring and control of diesel generator using the IoT technology. In 2017 20th International
Conference on Electrical Machines and Systems (ICEMS) (pp. 1-5). IEEE.
Secure Best Marks with AI Grader
Need help grading? Try our AI Grader for instant feedback on your assignments.

Coates, A., Hammoudeh, M. and Holmes, K.G., 2017, July. Internet of things for buildings
monitoring: Experiences and challenges. In Proceedings of the International Conference on
Future Networks and Distributed Systems (p. 38). ACM.
F. Osterlind, E. Pramsten, D. Roberthson, J. Eriksson, N. Finne and T. Voigt, (2007)> "Integrating
building automation systems and wireless sensor networks," IEEE Conference on Emerging
Technologies and Factory Automation, Patras, 2007, pp. 1376-1379. doi: 10.1109/EFTA.2007.4416941
Grindvoll, H., Vermesan, O., Crosbie, T., Bahr, R., Dawood, N., & Revel, G. M. (2012). A wireless
sensor network for intelligent building energy management based on multi communication standards- A
case study. Journal of Information Technology in Construction, 17, 43-61
Huang, Y. and Niu, J.L., (2015). Energy and visual performance of the silica aerogel glazing system in
commercial buildings of Hong Kong. Construction and building materials, 94, pp.57-72.
Hwang, Y.M., Kim, M.G. and Rho, J.J., 2016. Understanding Internet of Things (IoT) diffusion:
Focusing on value configuration of RFID and sensors in business cases (2008–
2012). Information Development, 32(4), pp.969-985.
Klett, F. and Wang, M., (2014). Smart cities of the future: Creating tomorrow’s education toward
effective skills and career development today. Knowledge Management & E-Learning: An International
Journal, 6(4), pp.344-355.
Kolokotsa, D., (2016). The role of smart grids in the building sector. Energy and Buildings, 116, pp.703-
708.
Li, W. and Kara, S., 2017. Methodology for monitoring manufacturing environment by using
wireless sensor networks (WSN) and the internet of things (IoT). Procedia CIRP, 61, pp.323-
328.

Mehta, G., Mittra, G. and Yadav, V.K., 2018, September. Application of IoT to optimize Data
Center operations. In 2018 International Conference on Computing, Power and Communication
Technologies (GUCON) (pp. 738-742). IEEE.
Meyer, M.K. (2005). Opportunities of Wireless Sensors and Controls for Building Operation, Energy
Engineering. 102:5, 2748, DOI:
Ngai, E., Dressler, F., Leung, V. and Li, M.,( 2017). Guest Editorial Special Section on Internet-of-Things
for Smart Cities and Urban Informatics. IEEE Transactions on Industrial Informatics, 13(2), pp.748-750.
Niu, Y., Lu, W., Chen, K., Huang, G.G. and Anumba, C., 2015. Smart construction objects. Journal of
Computing in Civil Engineering, 30(4), p.04015070.
Nukala, R., Panduru, K., Shields, A., Riordan, D., Doody, P. and Walsh, J., 2016, June. Internet
of Things: A review from ‘Farm to Fork’. In 2016 27th Irish Signals and Systems Conference
(ISSC) (pp. 1-6). IEEE.
Oliveira M.L & J.P.C. Rodrigues. (2011). Wireless Sensor Networks: A Survey on Environmental
Monitoring. Journal of Communication Vol. 6, Number2, (April 2011). Pp. 143 – 151. Retrieved from:
http://citeseerx.ist.psu.edu/viewdoc/download?doi=10.1.1.348.4169&rep=rep1&type=pdf#page=21
Othman, M.F. & Shazali, K. (2012). Wireless Sensor Network Applications: A Study in Environment
Monitoring System. Procedia Engineering (Vol 41, pages 1204-1210). ISSN 1877-7058,
https://doi.org/10.1016/j.proeng.2012.07.302.
Paiz J., Angeli, E., Wagner, J., Lawrick, E., Moore, K., Anderson, M., … Kec, R. (2010 May 5).
General Format. Retrieved from

Rahmani, A.M., Gia, T.N., Negash, B., Anzanpour, A., Azimi, I., Jiang, M. and Liljeberg, P.,
2018. Exploiting smart e-Health gateways at the edge of healthcare Internet-of-Things: A fog
computing approach. Future Generation Computer Systems, 78, pp.641-658.
Rghioui, A. and Oumnad, A., 2017. Internet of Things: Surveys for Measuring Human Activities
from Everywhere. International Journal of Electrical & Computer Engineering (2088-
8708), 7(5).
Saha, S. and Majumdar, A., 2017, March. Data centre temperature monitoring with ESP8266
based Wireless Sensor Network and cloud based dashboard with real time alert system. In 2017
Devices for Integrated Circuit (DevIC) (pp. 307-310). IEEE.
Shah, S.H. and Yaqoob, I., 2016, August. A survey: Internet of Things (IOT) technologies,
applications and challenges. In 2016 IEEE Smart Energy Grid Engineering (SEGE) (pp. 381-
385). IEEE.
Shaikh, P.H., Nor, N.B.M., Nallagownden, P., Elamvazuthi, I. and Ibrahim, T., (2014). A review on
optimized control systems for building energy and comfort management of smart sustainable
buildings. Renewable and Sustainable Energy Reviews, 34, pp.409-429.
Tadokoro, S., Jia, Q.S., Zhao, Q., Darabi, H., Huang, G., Becerik-Gerber, B., Sandberg, H. and
Johansson, K.H., (2014). Smart building technology [TC Spotlight]. IEEE Robotics & Automation
Magazine, 21(2), pp.18-20.
Tang, R., Wang, S., Gao, D.C. and Shan, K., (2016.) A power limiting control strategy based on adaptive
utility function for fast demand response of buildings in smart grids. Science and Technology for the Built
Environment, 22(6), pp.810-819.
Paraphrase This Document
Need a fresh take? Get an instant paraphrase of this document with our AI Paraphraser

Xue, X., Wang, S., Sun, Y. and Xiao, F., (2014). An interactive building power demand management
strategy for facilitating smart grid optimization. Applied Energy, 116, pp.297-310.
Xue, X., Wang, S., Yan, C. and Cui, B., (2015). A fast chiller power demand response control strategy for
buildings connected to smart grid. Applied Energy, 137, pp.77-87.
APPENDICES
Smart home paradigm with optional cloud connectivity.

Advanced smart home—integrating smart home, IoT and cloud computing.
1 out of 33

Your All-in-One AI-Powered Toolkit for Academic Success.
+13062052269
info@desklib.com
Available 24*7 on WhatsApp / Email
Unlock your academic potential
© 2024 | Zucol Services PVT LTD | All rights reserved.