Business Expansion Report: Analyzing XYZ Restaurant's London Venture
VerifiedAdded on 2019/12/04
|20
|4424
|339
Report
AI Summary
This report analyzes the potential for XYZ Restaurant to expand its business operations by opening a second restaurant in London. The report begins with an introduction to business decision-making and the role of financial management, including the use of statistical tools and capital budgeting techniques. It details the collection and analysis of both primary and secondary data to assess customer preferences and market trends, including a survey methodology and sampling framework. The report presents a summarization of sales and profit data, descriptive analysis, and analysis of primary data outcomes, including customer preferences for spending, satisfaction with services, and factors influencing dining decisions. Measures of dispersion, quartile, percentile, and correlation coefficients are explained. Furthermore, the report includes presentation of graphs using a spreadsheet, trend lines for forecasting sales and profitability, and a discussion of project planning and capital budgeting tools. The report concludes with recommendations for XYZ Restaurant's expansion strategy in London, based on the collected data and analysis.

BDM
1
1
Paraphrase This Document
Need a fresh take? Get an instant paraphrase of this document with our AI Paraphraser
Table of Contents
INTRODUCTION ...............................................................................................................................3
TASK 1.................................................................................................................................................3
1.1 Plan for the collection of primary and secondary data .............................................................3
1.2 Stating the survey methodology and sampling framed used by the researcher ........................4
1.3 Preparing questionnaire.............................................................................................................4
2.1 Summarization of sales and profit data......................................................................................5
Descriptive analysis of sales and profit are as follows: ..................................................................6
2.2 Analyzing the outcome of primary data for drawing the valid conclusion................................6
2.3 Analysis of data by using measures of dispersion.....................................................................9
2.4 Explaining quartile, percentile and correlation coefficient......................................................10
TASK 2...............................................................................................................................................11
3.1 Presenting graphs by using spread sheet .................................................................................11
3.2 Creating trend line for forecasting the sales and profitability aspects ....................................12
3.3 Preparing a business presentation ..........................................................................................13
3.4 Producing a formal business report ........................................................................................13
4.1 Using appropriate information processing tools .....................................................................14
4.2 Preparing project plan and determining the critical path.........................................................14
4.3 Using capital budgeting tools for decision making.................................................................16
CONCLUSION..................................................................................................................................17
References..........................................................................................................................................18
2
INTRODUCTION
Business decision making may be defined as a process in which manager of the firm takes
suitable decision by evaluating the several alternatives. In order to carry out the business activities
finance manager has to take several decisions on a daily basis. Thus, finance manager plays a
significant role in making most profitable decisions with the help of statistical tools and techniques
(Aripin, Tower and Taylor, 2011). In this, techniques of capital budgeting assists manager in
investing the project which will offer high return to business unit in the near future. This project
report is based on XYZ restaurant who is planning to open its second restaurant in London by
taking into in account its success factor in UK. The present report will describe the extent to which
restaurant will successfully expands its business operations in London through primary and
secondary research. Further, it will also develops understanding about the statistical tools which
helps in assessing the growth and market trend. Techniques of capital budgeting will also be used by
the manager in this report to evaluate the attractiveness of project.
TASK 1
1.1 Plan for the collection of primary and secondary data
Researcher conducts both primary and secondary investigation with the aim to assess the
view points of customers about the second restaurant which XYZ is planning to open. For this
purpose, researcher collects data from both primary and secondary data sources in the following
manner:
Collection of primary data: Information or data which is collected by the researcher for the fist in
accordance with the research issue then it is known as primary data. There are sources through
which researcher can gather primary data such as survey, observation and focus group etc.
(Badenhorst-Weiss and et. al., 2008). In the present investigation researcher conducts survey with
the aim to gather suitable data which helps them in offer appropriate solution to the large extent. In
order to conduct survey researcher needs to determine the suitable sample upon which the
investigation will be conducted by them. Thus, before establishing new restaurant in West London
researcher makes assessment of the attitude and preferences of 40 existing and potential customers.
Thereafter, researcher prepares questionnaire which contains question regarding the taste,
preferences, locations and other aspects which are associated with the growth and success of
restaurant. Through this, researcher is able to collect suitable amount of primary information.
Collection of secondary data: Researcher also makes use of secondary data sources such as books,
journals, research paper and government data sources. Secondary data is the one which is already
3
⊘ This is a preview!⊘
Do you want full access?
Subscribe today to unlock all pages.
Trusted by 1+ million students worldwide
gathered by another scholar for their own research purpose (Day, 2005). Internet provides huge and
latest information about each and every aspect. Thus, by accessing the internet researcher can gather
information about the future growth trend as well customer preferences to the significant level. In
addition to this, researcher also makes evaluation of the government data sources which provides
information about the economical and the development of food or restaurant industry. Thus, by
taking account into account both data sources researcher would be abler to conduct study more
effectively and efficiently.
1.2 Stating the survey methodology and sampling framed used by the researcher
Survey methodology entails the way and process through which survey will be conducted by
the researcher. It may be served as a guideline which helps researcher in gather primary data in an
effectual manner. Methodology prevents confusion in the mind of researcher and thereby helps in
fulfilling the purpose of investigation (Byrne, McAllister and Wyatt, 2011). Researcher will mail the
questionnaire to the 40 existing and potential customers of XYZ restaurant. Through this, researcher
would be able to offer suitable framework to restaurant about the taster, price, location and other
factors. Moreover, these factors have high level of influence on the decision making aspect of
customers. Thus, by assessing these aspects restaurant is able to offer effectual dining services to
the customers in accordance with their needs and expectations. It provides assistance to the
restaurant in achieving success in the strategic business arena.
In order to conduct researcher is also required to undertake sampling technique to determine
the customers upon which they need to conduct survey. There are various sampling techniques
which researcher can use to assess the suitable sample which having the characteristics of whole
population (Li, 2006). Thus, researcher undertakes purposive sampling technique which helps
researcher in fulfilling the purpose of researcher. Moreover, it is difficult for the researcher to
conduct study on whole population. Hence, researcher have selected 40 existing and potential
customers with the help of purposive sampling technique.
1.3 Preparing questionnaire
Demographic information
Name.......
Age....
Income.....
1. How often do you visit the restaurant?
Daily
Twice in a week ()
4
Paraphrase This Document
Need a fresh take? Get an instant paraphrase of this document with our AI Paraphraser
Thrice in a week ()
Weekly ()
2. How much do you afford to spend in the dinning services which are offered by XYZ restaurant?
£10-20
£30-40
More than £40
3. To which factor do you give more preference while taking decision about the dinning services?
Quality ()
Price ()
Ambiance ()
Location ()
4. Which restaurant comes in your mind first while you taking decision about the dining services?
Murano ()
Balti palace ()
XYZ ()
5. Are you satisfied with the services which are offered by the personnel of XYZ?
Satisfied ()
Highly satisfied ()
Dissatisfied ()
Highly dissatisfied ()
6. For which purpose do you prefers to visit the restaurant?
Breakfast ()
Lunch ()
Dinner ()
7. Which area of London offers high level of convenience to them.......................
8. Stating the other factor which affects the dining decision of your restaurant...............
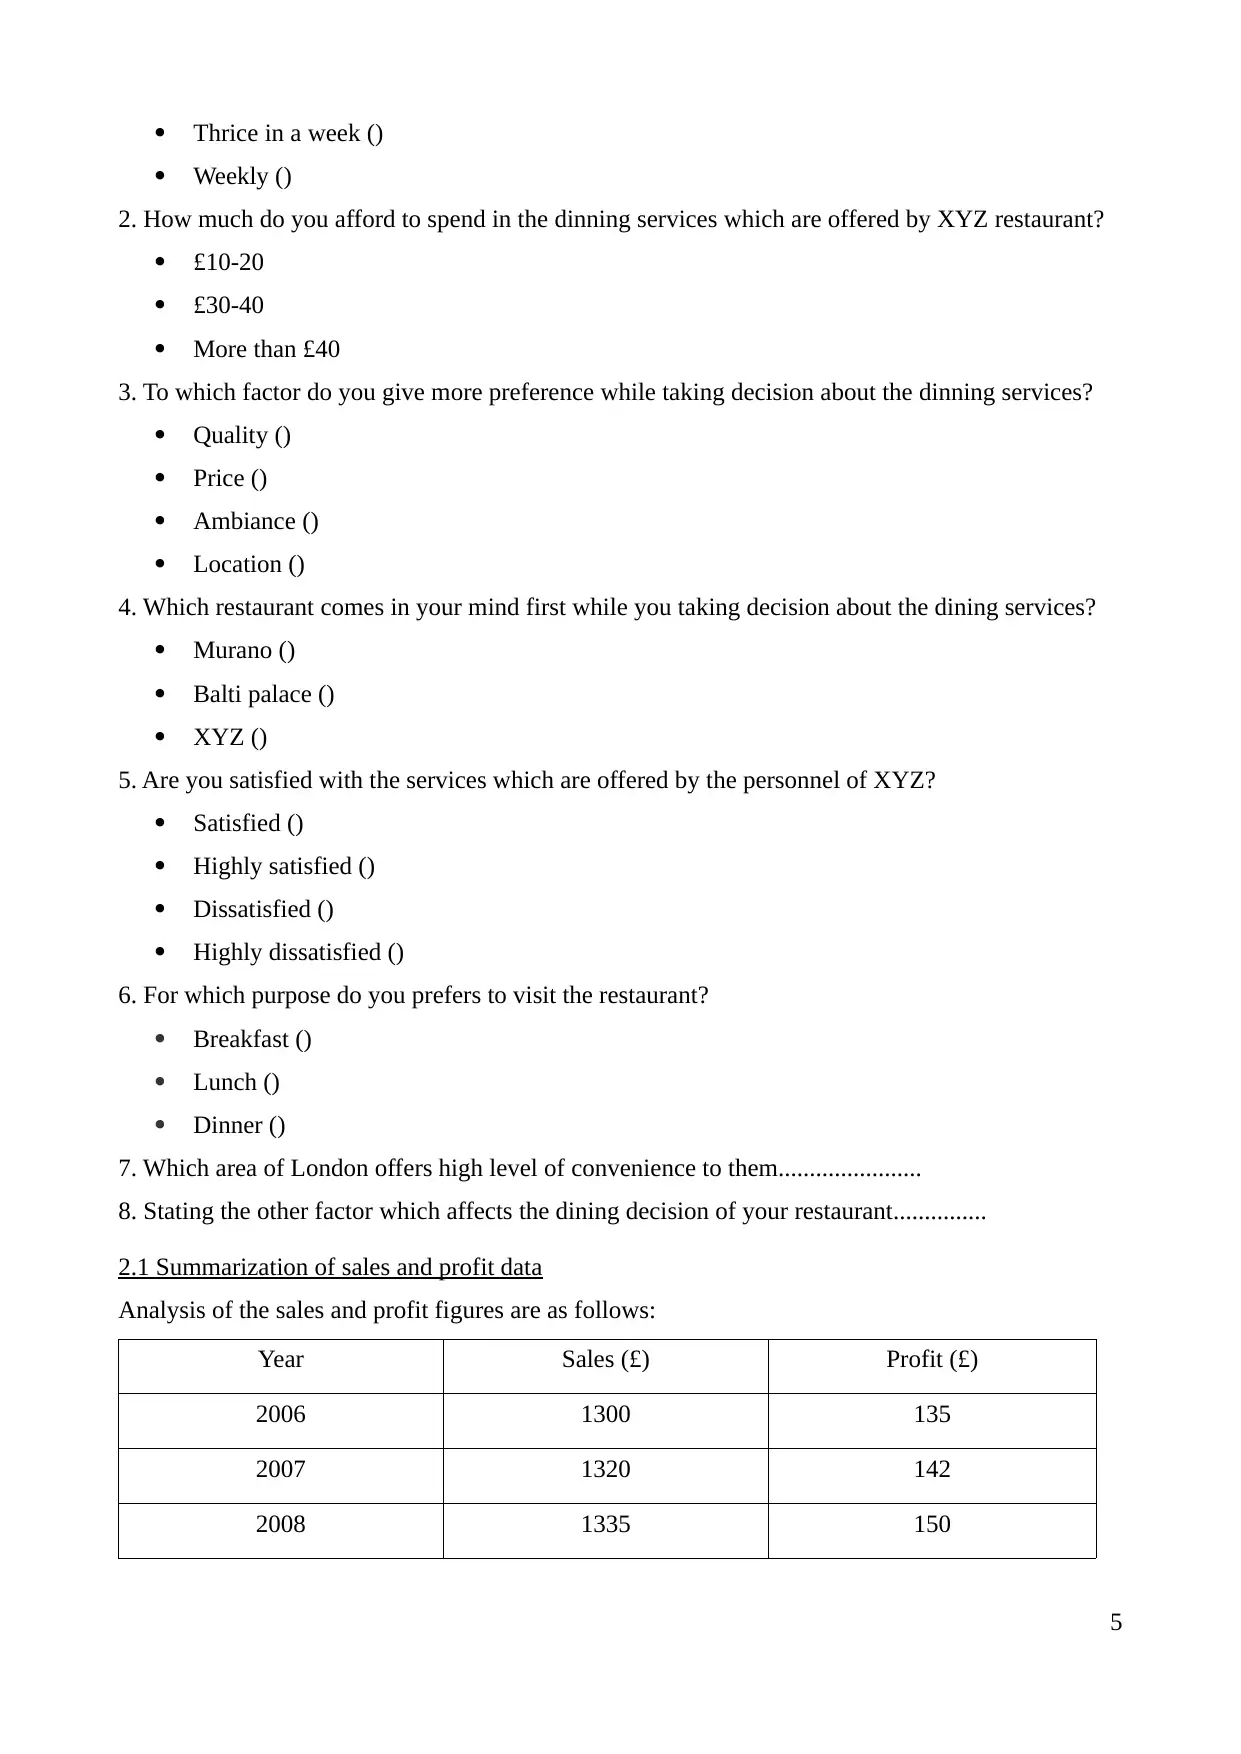
2.1 Summarization of sales and profit data
Analysis of the sales and profit figures are as follows:
Year Sales (£) Profit (£)
2006 1300 135
2007 1320 142
2008 1335 150
5
Weekly ()
2. How much do you afford to spend in the dinning services which are offered by XYZ restaurant?
£10-20
£30-40
More than £40
3. To which factor do you give more preference while taking decision about the dinning services?
Quality ()
Price ()
Ambiance ()
Location ()
4. Which restaurant comes in your mind first while you taking decision about the dining services?
Murano ()
Balti palace ()
XYZ ()
5. Are you satisfied with the services which are offered by the personnel of XYZ?
Satisfied ()
Highly satisfied ()
Dissatisfied ()
Highly dissatisfied ()
6. For which purpose do you prefers to visit the restaurant?
Breakfast ()
Lunch ()
Dinner ()
7. Which area of London offers high level of convenience to them.......................
8. Stating the other factor which affects the dining decision of your restaurant...............
2.1 Summarization of sales and profit data
Analysis of the sales and profit figures are as follows:
Year Sales (£) Profit (£)
2006 1300 135
2007 1320 142
2008 1335 150
5
2009 1350 159
2010 1370 170
2011 1375 182
2012 1400 194
2013 1410 205
2014 1425 220
2015 1440 245
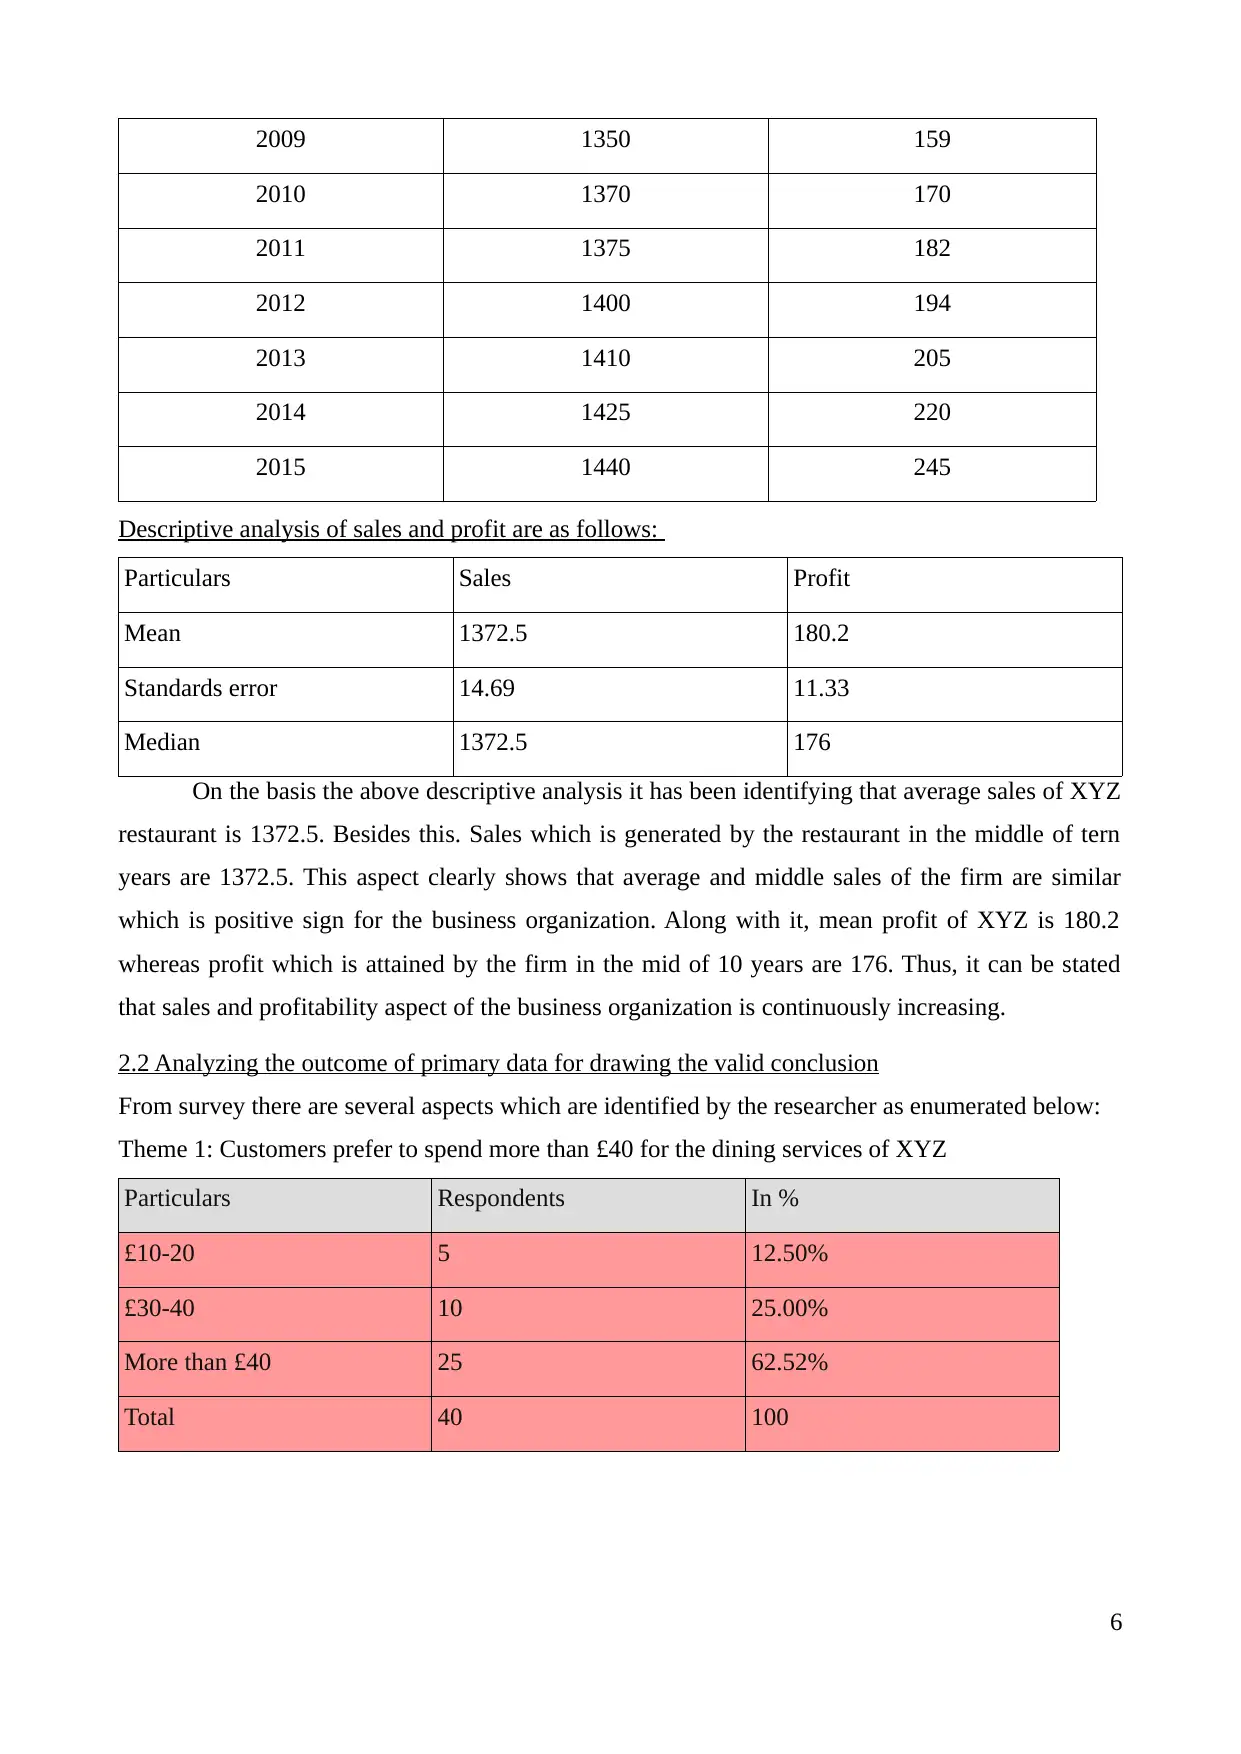
Descriptive analysis of sales and profit are as follows:
Particulars Sales Profit
Mean 1372.5 180.2
Standards error 14.69 11.33
Median 1372.5 176
On the basis the above descriptive analysis it has been identifying that average sales of XYZ
restaurant is 1372.5. Besides this. Sales which is generated by the restaurant in the middle of tern
years are 1372.5. This aspect clearly shows that average and middle sales of the firm are similar
which is positive sign for the business organization. Along with it, mean profit of XYZ is 180.2
whereas profit which is attained by the firm in the mid of 10 years are 176. Thus, it can be stated
that sales and profitability aspect of the business organization is continuously increasing.
2.2 Analyzing the outcome of primary data for drawing the valid conclusion
From survey there are several aspects which are identified by the researcher as enumerated below:
Theme 1: Customers prefer to spend more than £40 for the dining services of XYZ
Particulars Respondents In %
£10-20 5 12.50%
£30-40 10 25.00%
More than £40 25 62.52%
Total 40 100
6
2010 1370 170
2011 1375 182
2012 1400 194
2013 1410 205
2014 1425 220
2015 1440 245
Descriptive analysis of sales and profit are as follows:
Particulars Sales Profit
Mean 1372.5 180.2
Standards error 14.69 11.33
Median 1372.5 176
On the basis the above descriptive analysis it has been identifying that average sales of XYZ
restaurant is 1372.5. Besides this. Sales which is generated by the restaurant in the middle of tern
years are 1372.5. This aspect clearly shows that average and middle sales of the firm are similar
which is positive sign for the business organization. Along with it, mean profit of XYZ is 180.2
whereas profit which is attained by the firm in the mid of 10 years are 176. Thus, it can be stated
that sales and profitability aspect of the business organization is continuously increasing.
2.2 Analyzing the outcome of primary data for drawing the valid conclusion
From survey there are several aspects which are identified by the researcher as enumerated below:
Theme 1: Customers prefer to spend more than £40 for the dining services of XYZ
Particulars Respondents In %
£10-20 5 12.50%
£30-40 10 25.00%
More than £40 25 62.52%
Total 40 100
6
⊘ This is a preview!⊘
Do you want full access?
Subscribe today to unlock all pages.
Trusted by 1+ million students worldwide
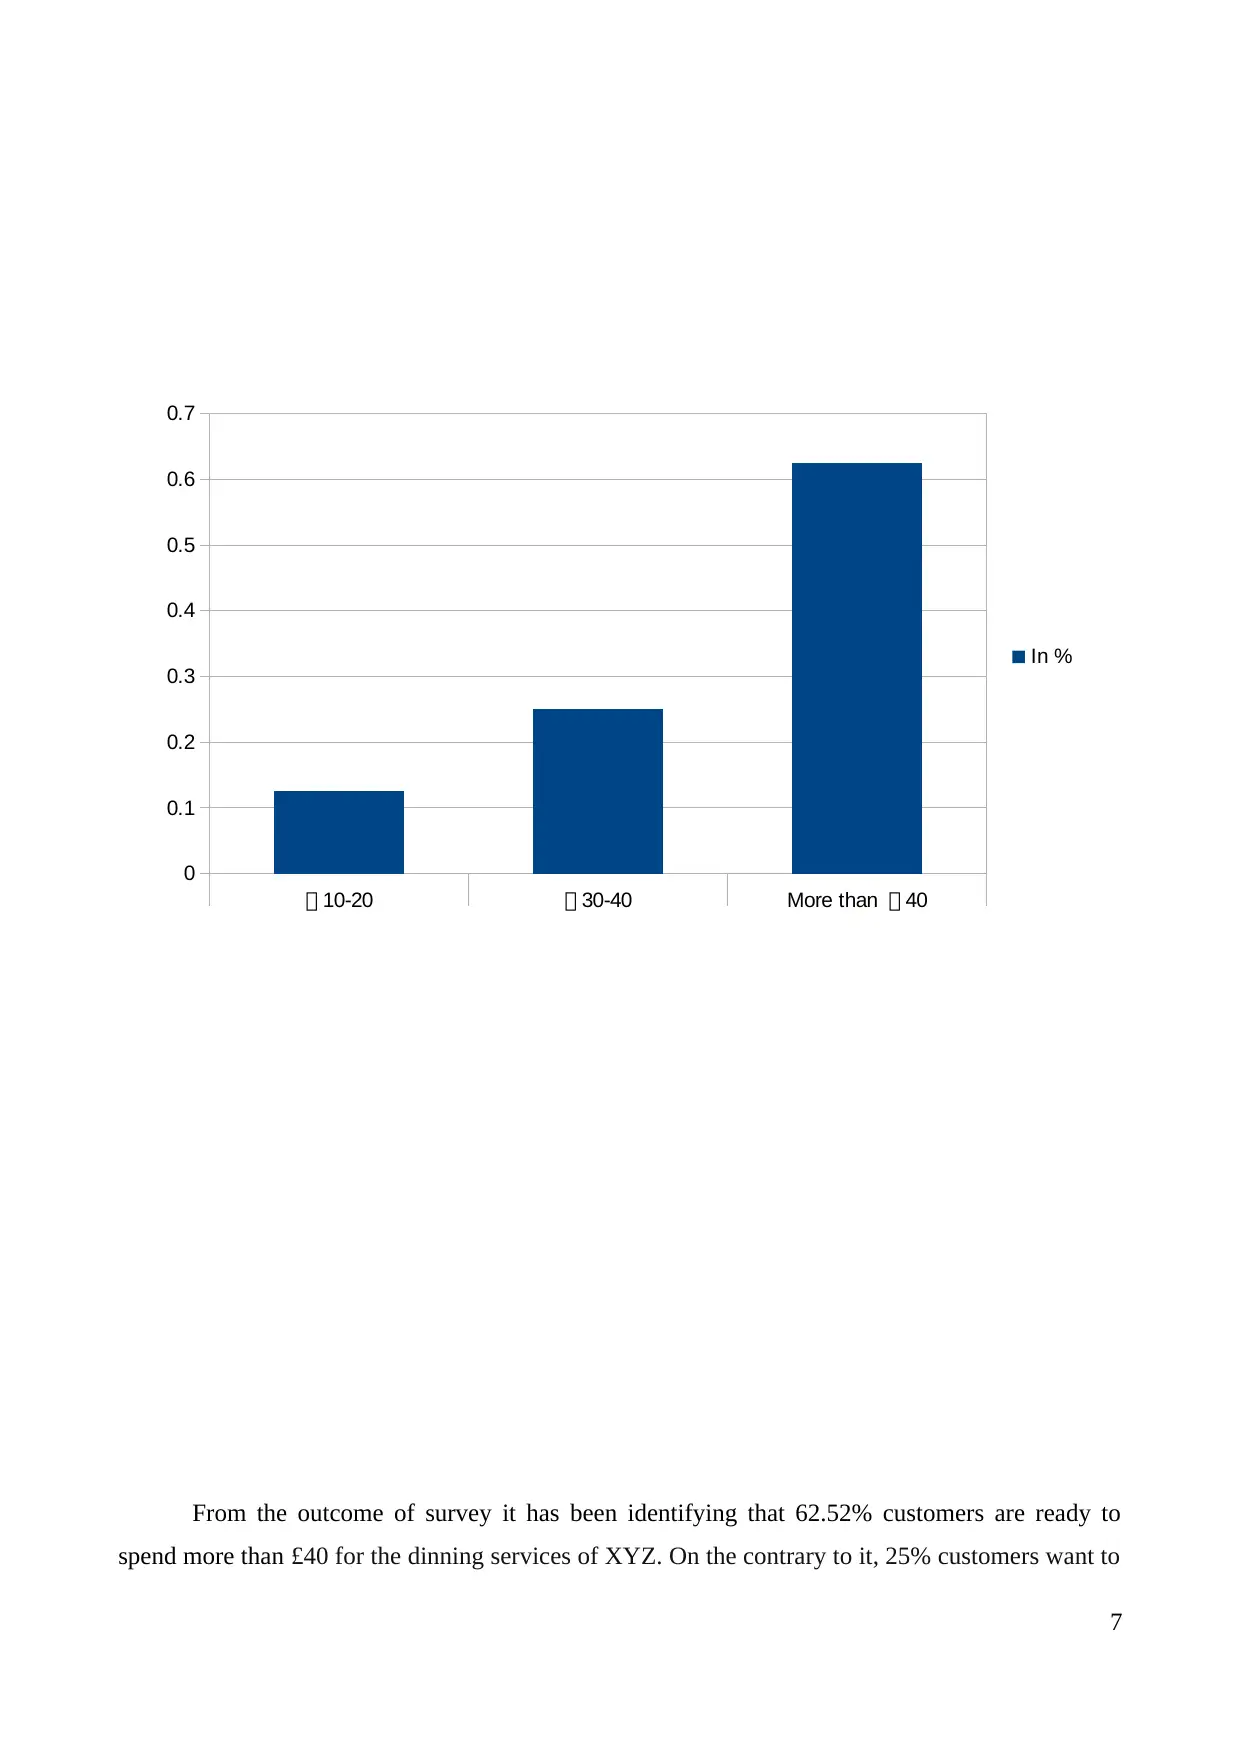
From the outcome of survey it has been identifying that 62.52% customers are ready to
spend more than £40 for the dinning services of XYZ. On the contrary to it, 25% customers want to
7
£ 10-20 £ 30-40 More than £ 40
0
0.1
0.2
0.3
0.4
0.5
0.6
0.7
In %
spend more than £40 for the dinning services of XYZ. On the contrary to it, 25% customers want to
7
£ 10-20 £ 30-40 More than £ 40
0
0.1
0.2
0.3
0.4
0.5
0.6
0.7
In %
Paraphrase This Document
Need a fresh take? Get an instant paraphrase of this document with our AI Paraphraser
pay £30-40 whereas 12.5% customers wishes to spend £10-20 for the food services. On the basis of
this aspect it can be stated that XYZ restaurant can set high prices for the dinning services which are
availed by them. It helps company in raising the productivity and profitability to the large extent.
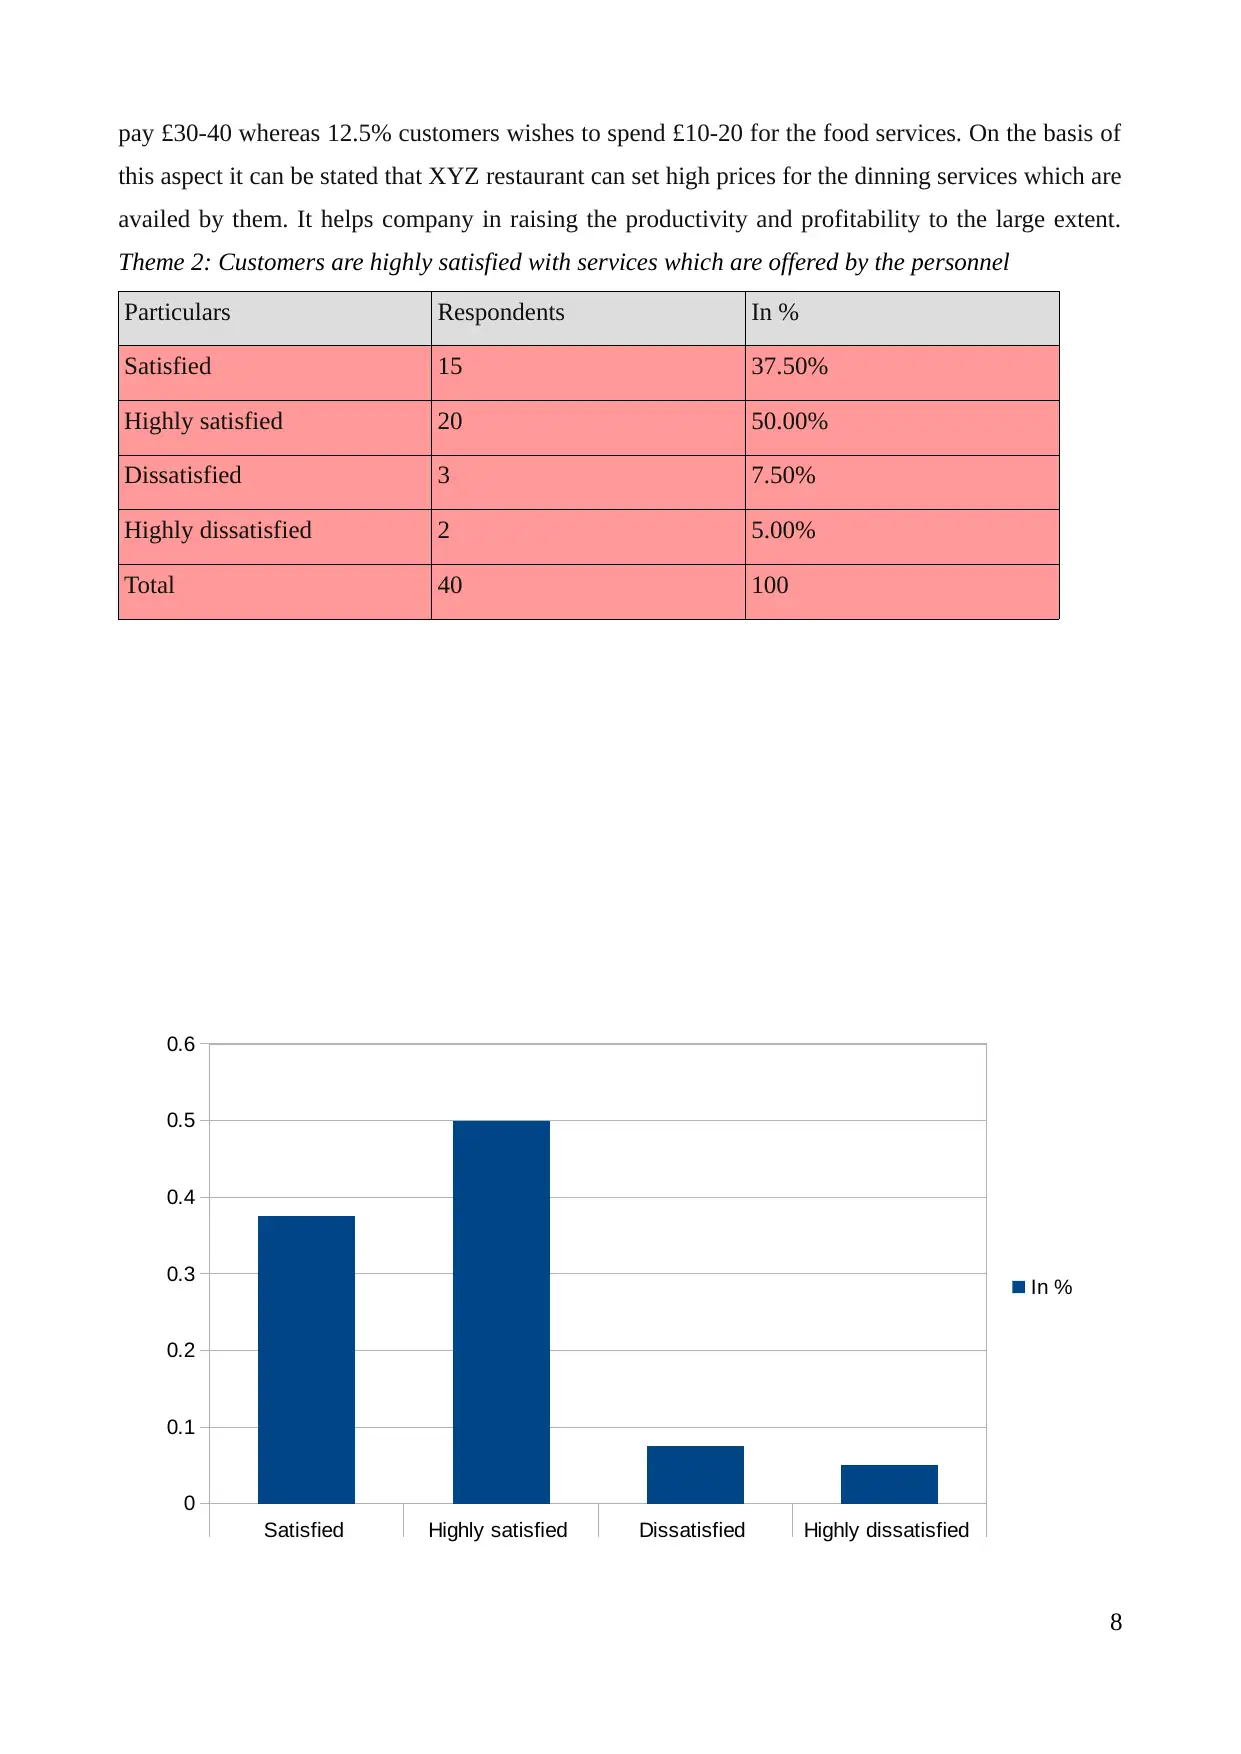
Theme 2: Customers are highly satisfied with services which are offered by the personnel
Particulars Respondents In %
Satisfied 15 37.50%
Highly satisfied 20 50.00%
Dissatisfied 3 7.50%
Highly dissatisfied 2 5.00%
Total 40 100
8
Satisfied Highly satisfied Dissatisfied Highly dissatisfied
0
0.1
0.2
0.3
0.4
0.5
0.6
In %
this aspect it can be stated that XYZ restaurant can set high prices for the dinning services which are
availed by them. It helps company in raising the productivity and profitability to the large extent.
Theme 2: Customers are highly satisfied with services which are offered by the personnel
Particulars Respondents In %
Satisfied 15 37.50%
Highly satisfied 20 50.00%
Dissatisfied 3 7.50%
Highly dissatisfied 2 5.00%
Total 40 100
8
Satisfied Highly satisfied Dissatisfied Highly dissatisfied
0
0.1
0.2
0.3
0.4
0.5
0.6
In %
Outcome of survey presents that 50% customers are highly satisfied with the services which
are offered by them at restaurant. One of the respondents claimed that service personnel treat them
in a very polite manner. Whereas 37.50% customers are satisfied with the services of human
resources. Thus, by hiring the skilled and efficient personnel company is able to serve their
customers in an effectual manner. It enables firm to develop high level of satisfaction among the
customers and there enhance their sales. Therefore, business organization needs to recruit and select
best personnel for attaining success in the strategic business arena.
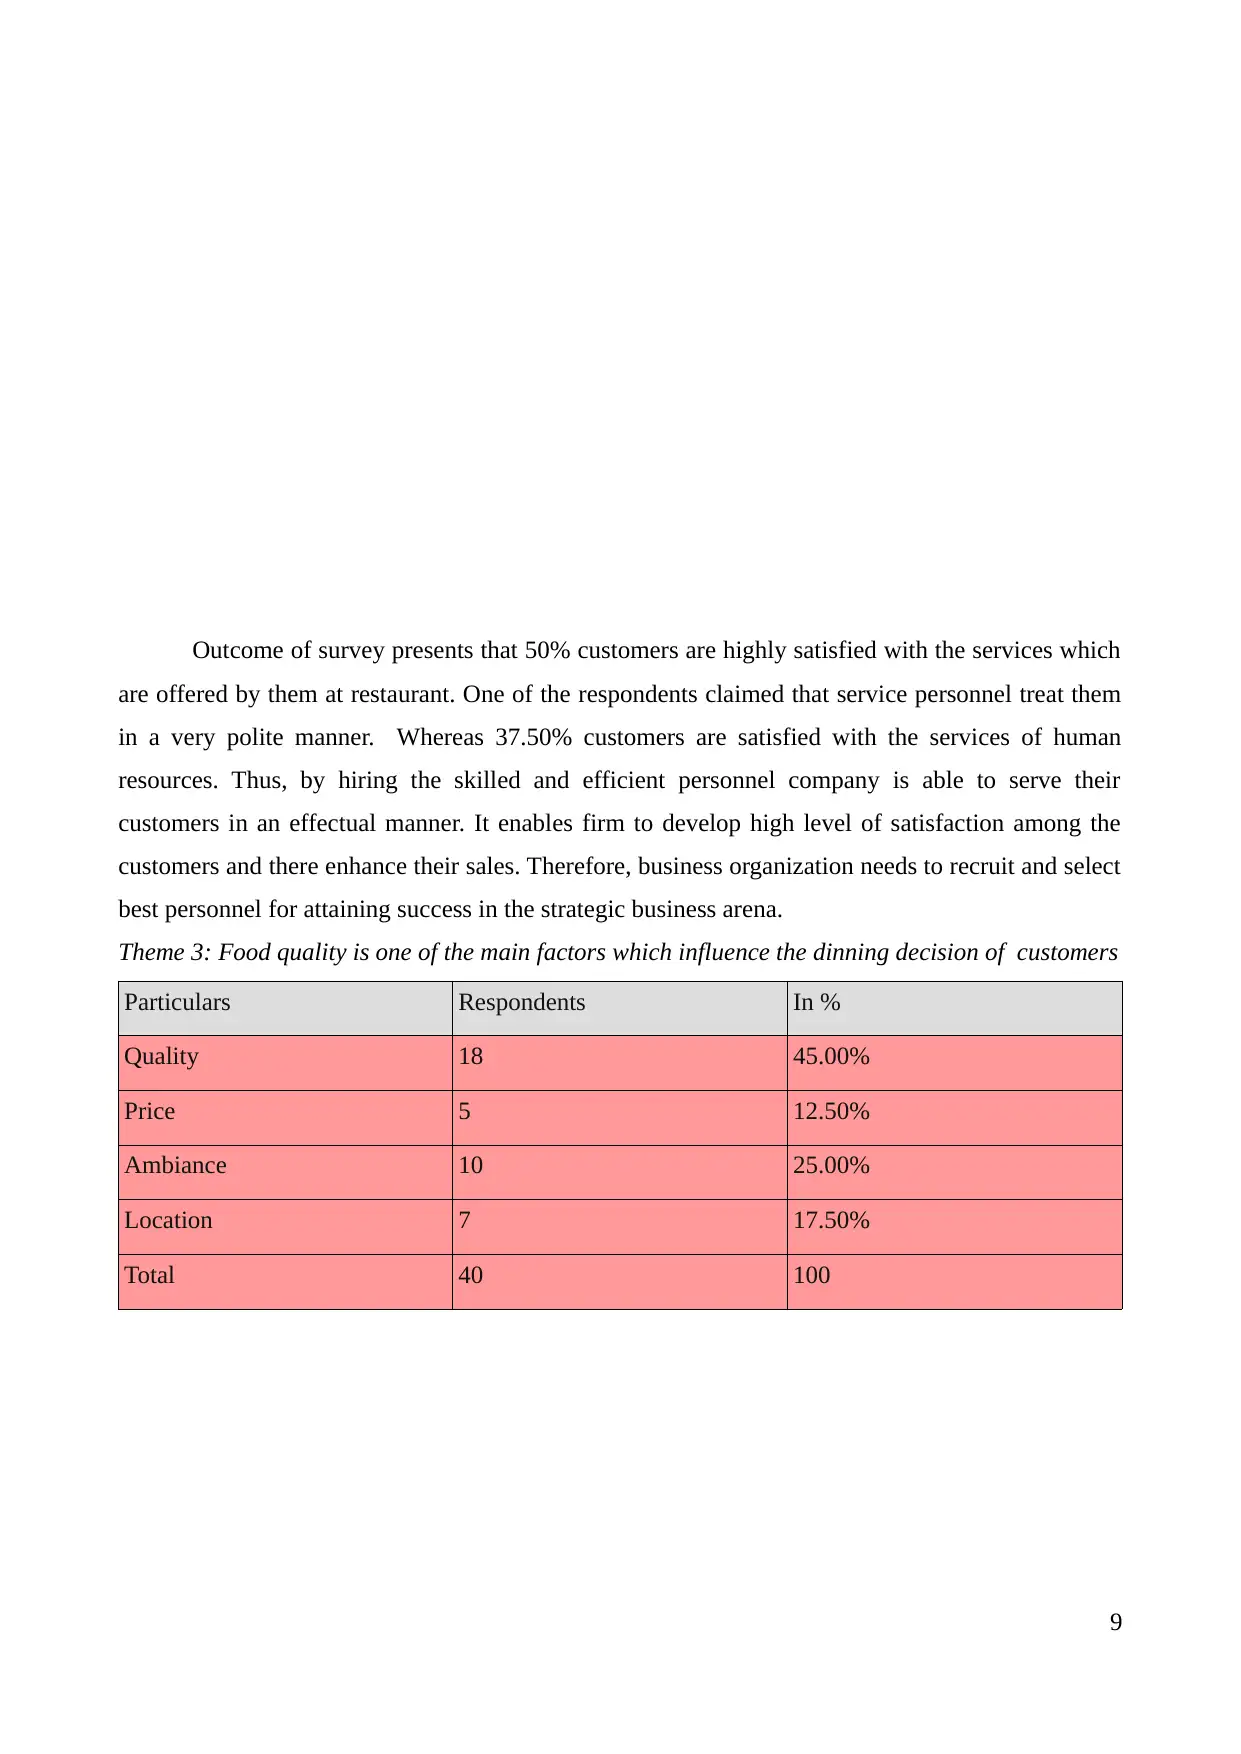
Theme 3: Food quality is one of the main factors which influence the dinning decision of customers
Particulars Respondents In %
Quality 18 45.00%
Price 5 12.50%
Ambiance 10 25.00%
Location 7 17.50%
Total 40 100
9
are offered by them at restaurant. One of the respondents claimed that service personnel treat them
in a very polite manner. Whereas 37.50% customers are satisfied with the services of human
resources. Thus, by hiring the skilled and efficient personnel company is able to serve their
customers in an effectual manner. It enables firm to develop high level of satisfaction among the
customers and there enhance their sales. Therefore, business organization needs to recruit and select
best personnel for attaining success in the strategic business arena.
Theme 3: Food quality is one of the main factors which influence the dinning decision of customers
Particulars Respondents In %
Quality 18 45.00%
Price 5 12.50%
Ambiance 10 25.00%
Location 7 17.50%
Total 40 100
9
⊘ This is a preview!⊘
Do you want full access?
Subscribe today to unlock all pages.
Trusted by 1+ million students worldwide
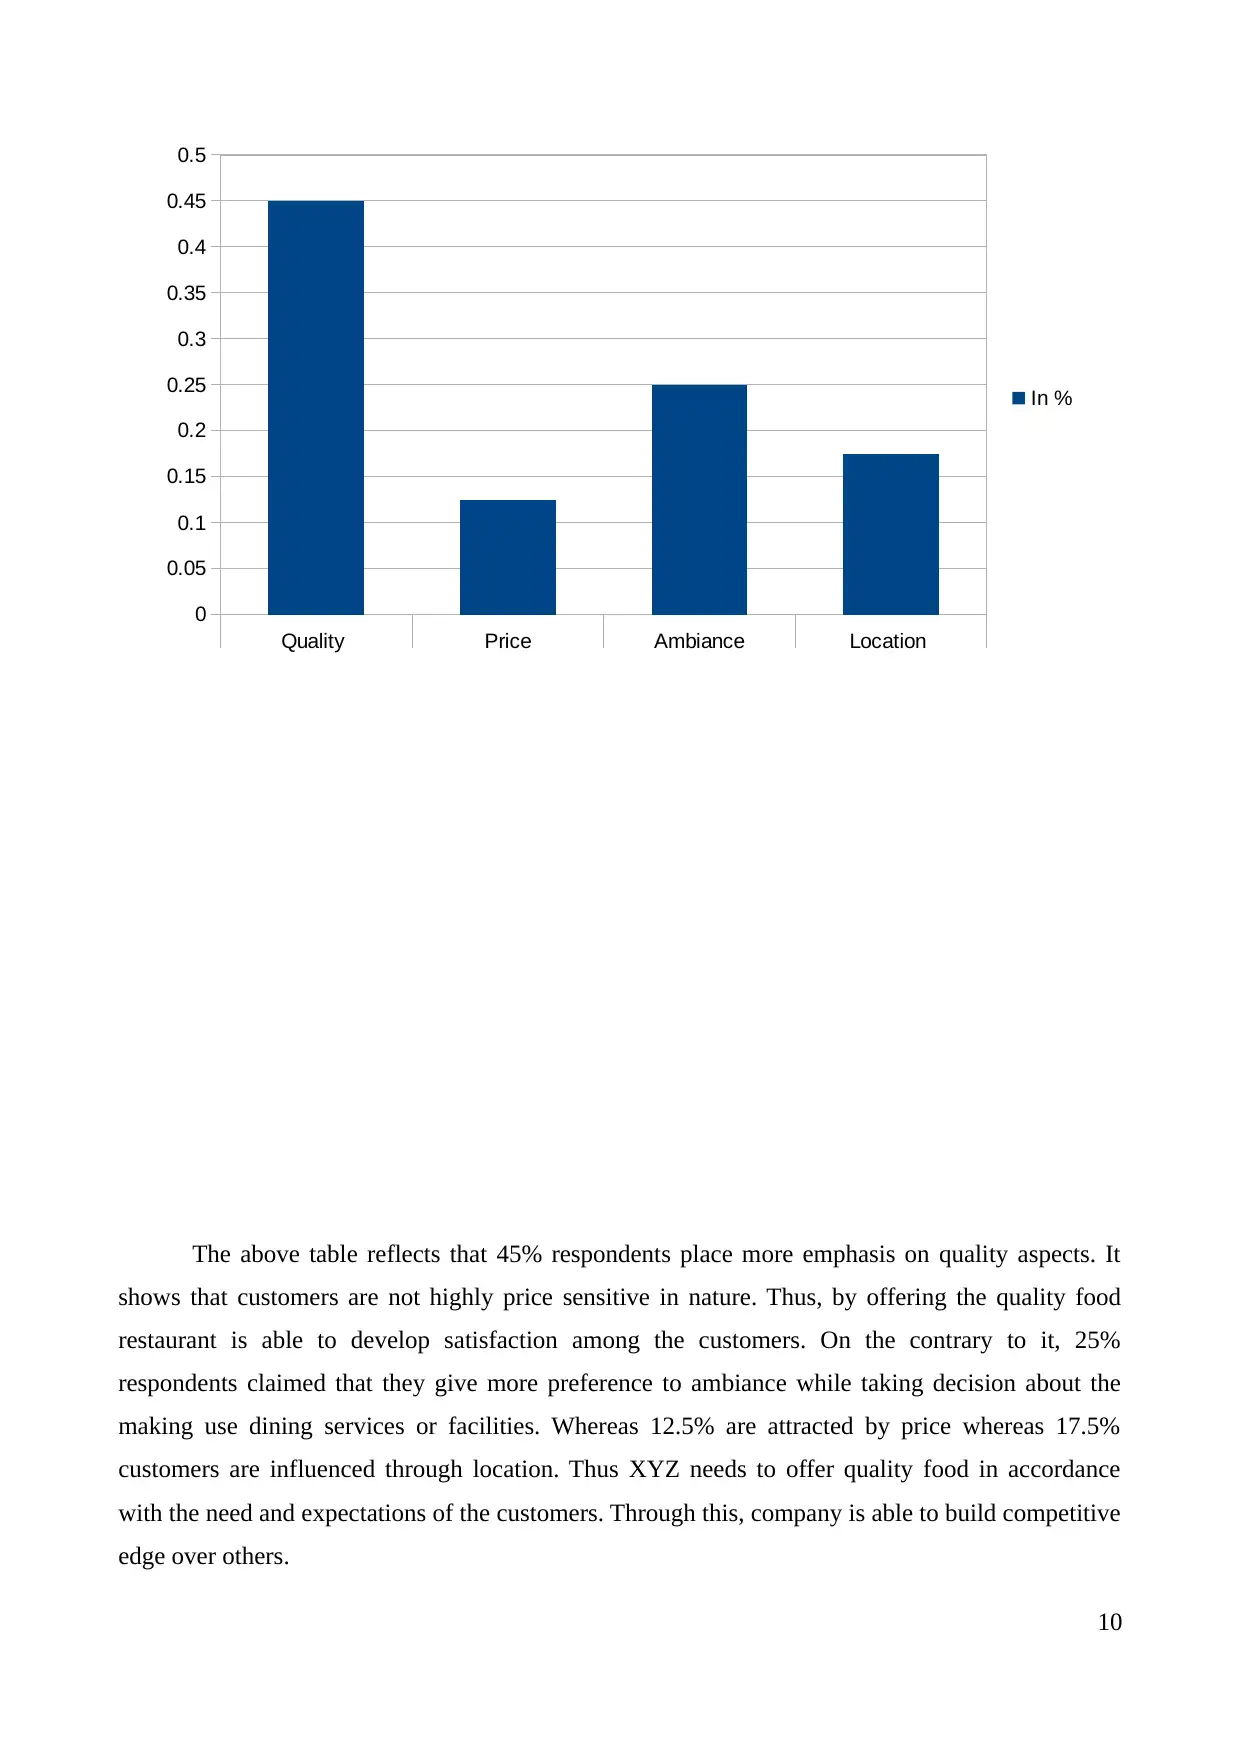
The above table reflects that 45% respondents place more emphasis on quality aspects. It
shows that customers are not highly price sensitive in nature. Thus, by offering the quality food
restaurant is able to develop satisfaction among the customers. On the contrary to it, 25%
respondents claimed that they give more preference to ambiance while taking decision about the
making use dining services or facilities. Whereas 12.5% are attracted by price whereas 17.5%
customers are influenced through location. Thus XYZ needs to offer quality food in accordance
with the need and expectations of the customers. Through this, company is able to build competitive
edge over others.
10
Quality Price Ambiance Location
0
0.05
0.1
0.15
0.2
0.25
0.3
0.35
0.4
0.45
0.5
In %
Paraphrase This Document
Need a fresh take? Get an instant paraphrase of this document with our AI Paraphraser
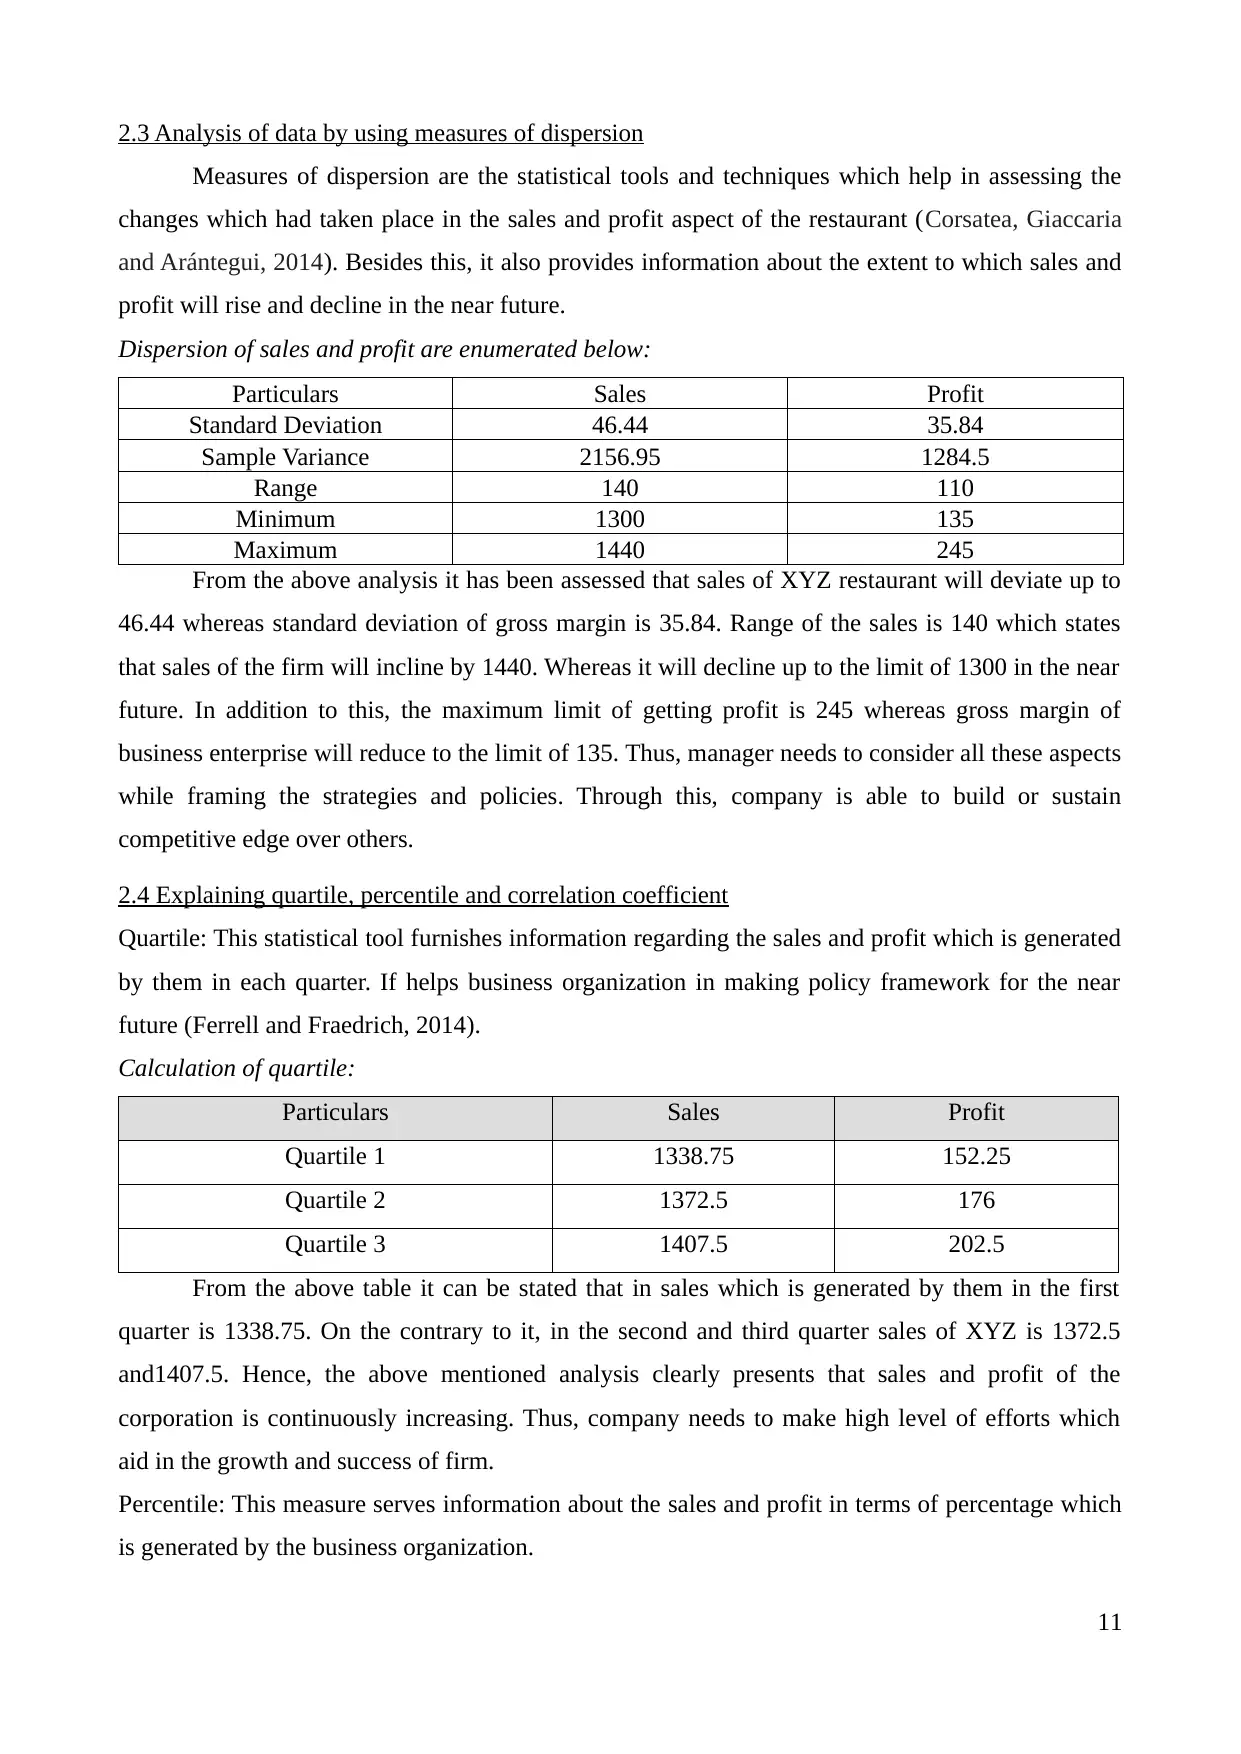
2.3 Analysis of data by using measures of dispersion
Measures of dispersion are the statistical tools and techniques which help in assessing the
changes which had taken place in the sales and profit aspect of the restaurant (Corsatea, Giaccaria
and Arántegui, 2014). Besides this, it also provides information about the extent to which sales and
profit will rise and decline in the near future.
Dispersion of sales and profit are enumerated below:
Particulars Sales Profit
Standard Deviation 46.44 35.84
Sample Variance 2156.95 1284.5
Range 140 110
Minimum 1300 135
Maximum 1440 245
From the above analysis it has been assessed that sales of XYZ restaurant will deviate up to
46.44 whereas standard deviation of gross margin is 35.84. Range of the sales is 140 which states
that sales of the firm will incline by 1440. Whereas it will decline up to the limit of 1300 in the near
future. In addition to this, the maximum limit of getting profit is 245 whereas gross margin of
business enterprise will reduce to the limit of 135. Thus, manager needs to consider all these aspects
while framing the strategies and policies. Through this, company is able to build or sustain
competitive edge over others.
2.4 Explaining quartile, percentile and correlation coefficient
Quartile: This statistical tool furnishes information regarding the sales and profit which is generated
by them in each quarter. If helps business organization in making policy framework for the near
future (Ferrell and Fraedrich, 2014).
Calculation of quartile:
Particulars Sales Profit
Quartile 1 1338.75 152.25
Quartile 2 1372.5 176
Quartile 3 1407.5 202.5
From the above table it can be stated that in sales which is generated by them in the first
quarter is 1338.75. On the contrary to it, in the second and third quarter sales of XYZ is 1372.5
and1407.5. Hence, the above mentioned analysis clearly presents that sales and profit of the
corporation is continuously increasing. Thus, company needs to make high level of efforts which
aid in the growth and success of firm.
Percentile: This measure serves information about the sales and profit in terms of percentage which
is generated by the business organization.
11
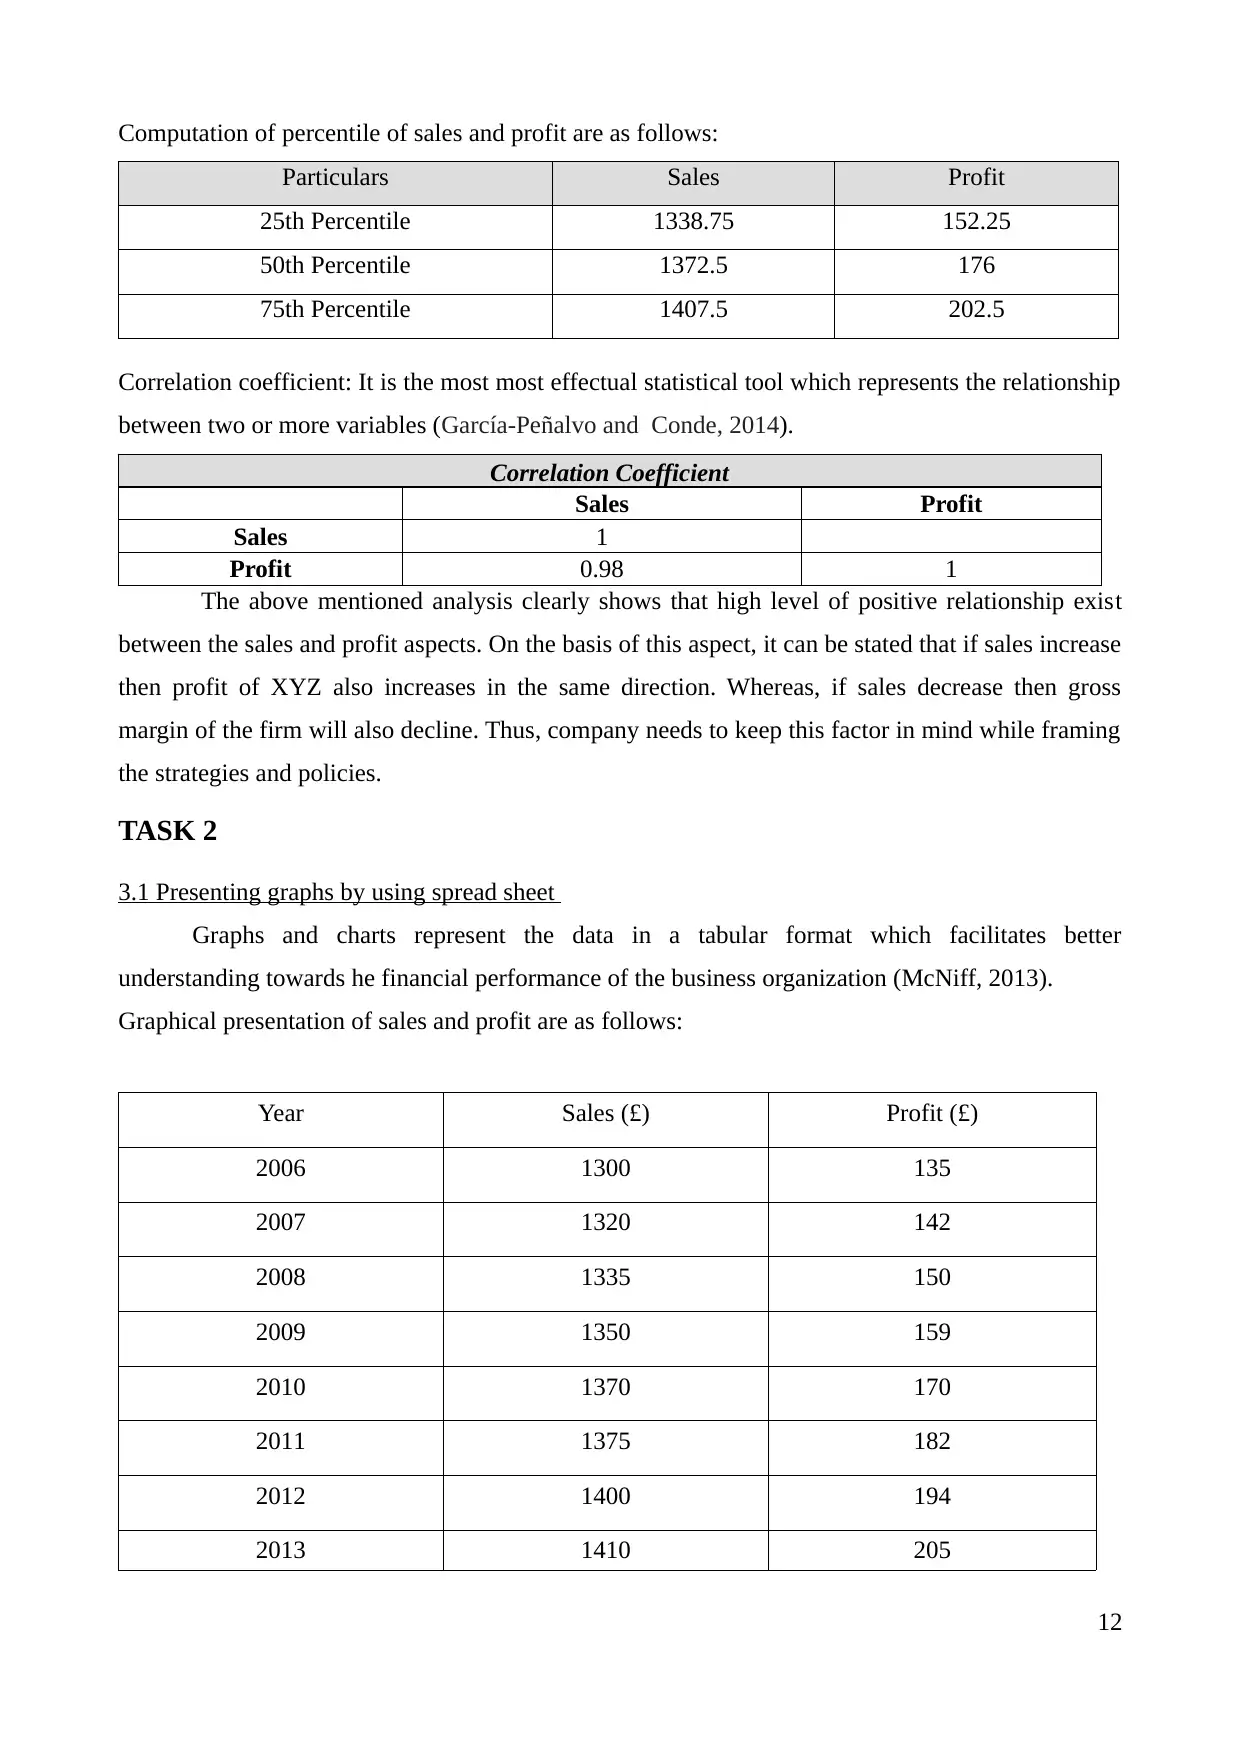
Computation of percentile of sales and profit are as follows:
Particulars Sales Profit
25th Percentile 1338.75 152.25
50th Percentile 1372.5 176
75th Percentile 1407.5 202.5
Correlation coefficient: It is the most most effectual statistical tool which represents the relationship
between two or more variables (García-Peñalvo and Conde, 2014).
Correlation Coefficient
Sales Profit
Sales 1
Profit 0.98 1
The above mentioned analysis clearly shows that high level of positive relationship exist
between the sales and profit aspects. On the basis of this aspect, it can be stated that if sales increase
then profit of XYZ also increases in the same direction. Whereas, if sales decrease then gross
margin of the firm will also decline. Thus, company needs to keep this factor in mind while framing
the strategies and policies.
TASK 2
3.1 Presenting graphs by using spread sheet
Graphs and charts represent the data in a tabular format which facilitates better
understanding towards he financial performance of the business organization (McNiff, 2013).
Graphical presentation of sales and profit are as follows:
Year Sales (£) Profit (£)
2006 1300 135
2007 1320 142
2008 1335 150
2009 1350 159
2010 1370 170
2011 1375 182
2012 1400 194
2013 1410 205
12
⊘ This is a preview!⊘
Do you want full access?
Subscribe today to unlock all pages.
Trusted by 1+ million students worldwide
1 out of 20
Related Documents


Your All-in-One AI-Powered Toolkit for Academic Success.
+13062052269
info@desklib.com
Available 24*7 on WhatsApp / Email
![[object Object]](/_next/static/media/star-bottom.7253800d.svg)
Unlock your academic potential
Copyright © 2020–2026 A2Z Services. All Rights Reserved. Developed and managed by ZUCOL.