University Study: Young People's Willingness to Work with Older People
VerifiedAdded on 2020/01/07
|18
|3703
|174
Report
AI Summary
This report presents an analysis of young people's willingness to work with older people, based on a survey of 641 university students. The study employs various statistical tools, including frequency tables, reliability tests, chi-square tests, and t-tests, to examine the respondents' perceptions. Key findings reveal the distribution of responses across gender, age, major, student status, degree level, and year level. The reliability test indicates a high level of internal consistency in the survey questions. Chi-square tests are used to assess the relationships between variables such as the ability to work with older workers, cooperation, and perceptions of training. The results suggest that young people generally possess the ability to work well with older individuals and cooperate with them in the workplace. However, the analysis also indicates that training older workers may be perceived as challenging. The report concludes with recommendations based on the statistical outcomes.
The willingness of young people to work
with older people
1
with older people
1
Paraphrase This Document
Need a fresh take? Get an instant paraphrase of this document with our AI Paraphraser
TABLE OF CONTENTS
INTRODUCTION..............................................................................................................................3
Aim............................................................................................................................................. 3
Analysis...................................................................................................................................... 3
Frequency table................................................................................................................. 3
Reliability test ....................................................................................................................6
Chi square test .................................................................................................................. 7
T test ............................................................................................................................... 14
Conclusion ...................................................................................................................................16
RECOMMENDATIONS.................................................................................................................. 17
REFERENCES................................................................................................................................. 18
2
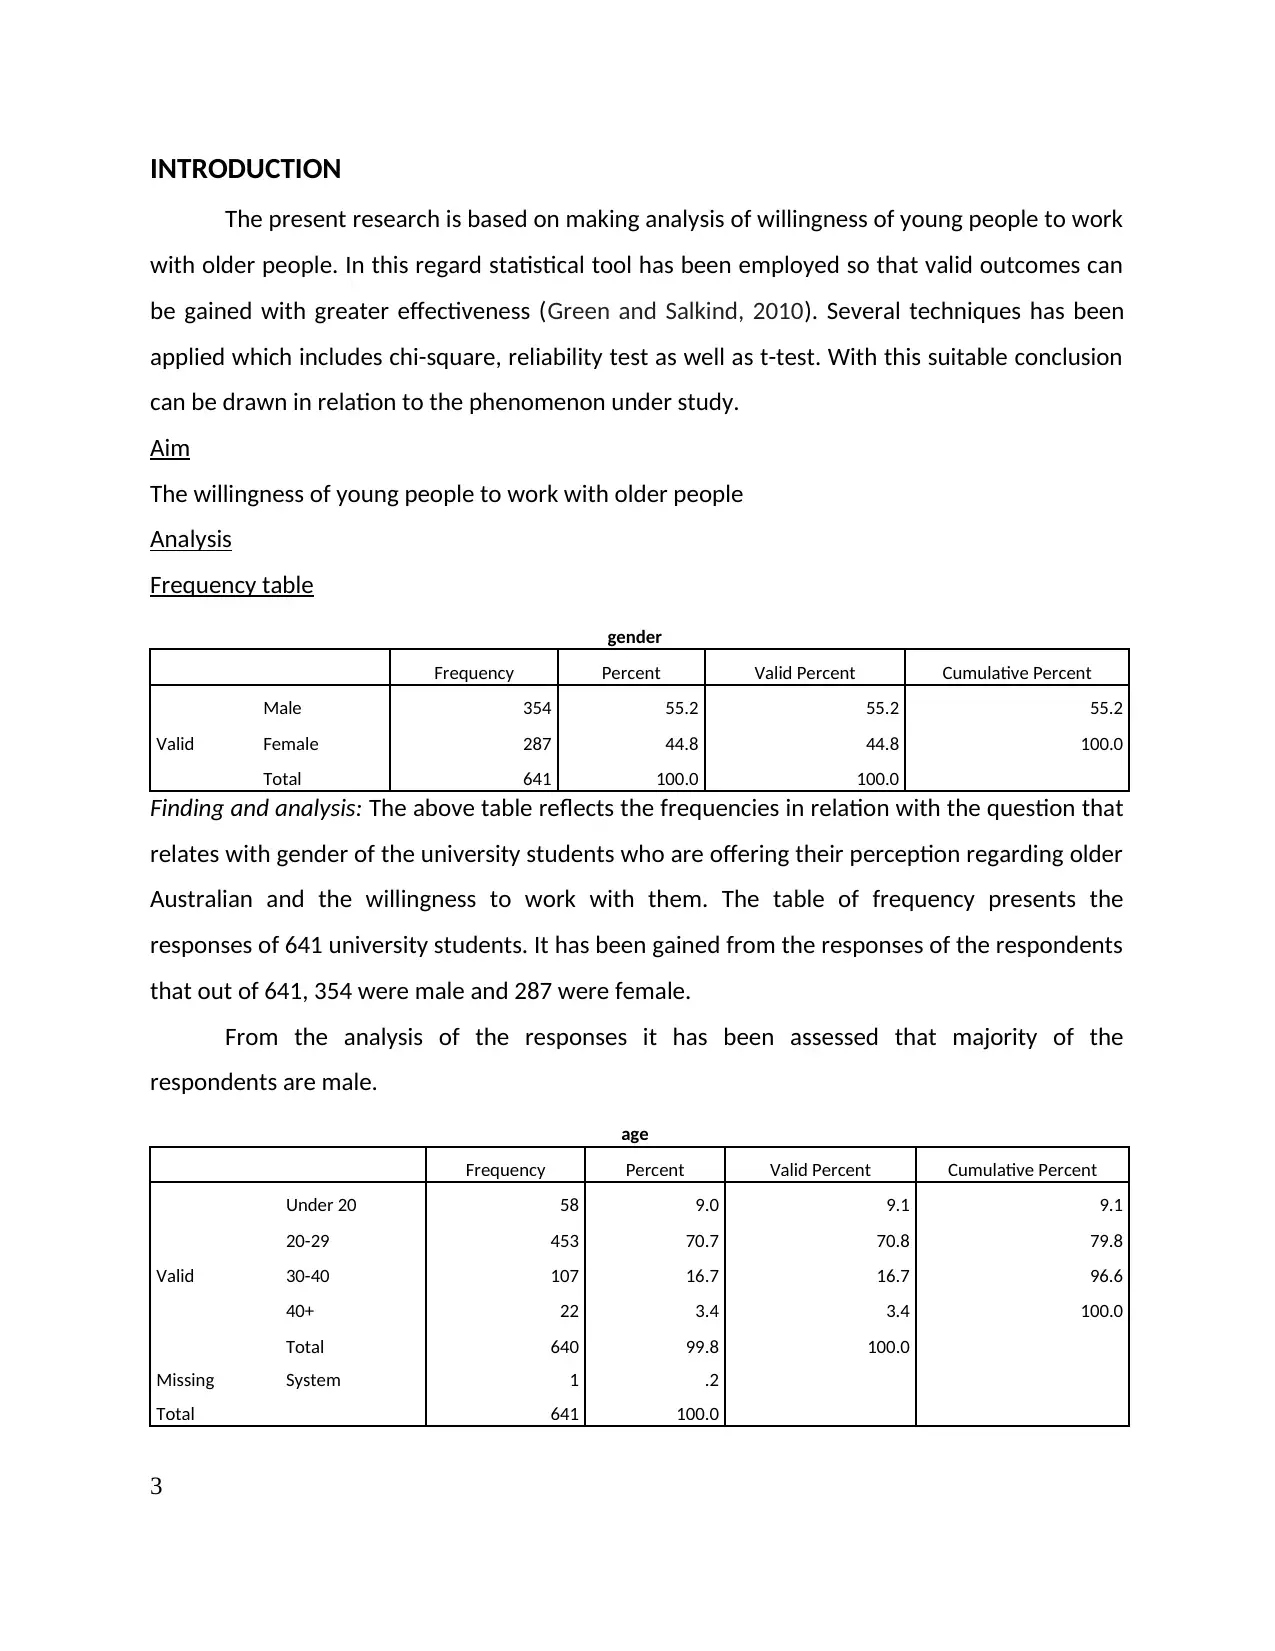
INTRODUCTION
The present research is based on making analysis of willingness of young people to work
with older people. In this regard statistical tool has been employed so that valid outcomes can
be gained with greater effectiveness (Green and Salkind, 2010). Several techniques has been
applied which includes chi-square, reliability test as well as t-test. With this suitable conclusion
can be drawn in relation to the phenomenon under study.
Aim
The willingness of young people to work with older people
Analysis
Frequency table
gender
Frequency Percent Valid Percent Cumulative Percent
Valid
Male 354 55.2 55.2 55.2
Female 287 44.8 44.8 100.0
Total 641 100.0 100.0
Finding and analysis: The above table reflects the frequencies in relation with the question that
relates with gender of the university students who are offering their perception regarding older
Australian and the willingness to work with them. The table of frequency presents the
responses of 641 university students. It has been gained from the responses of the respondents
that out of 641, 354 were male and 287 were female.
From the analysis of the responses it has been assessed that majority of the
respondents are male.
age
Frequency Percent Valid Percent Cumulative Percent
Valid
Under 20 58 9.0 9.1 9.1
20-29 453 70.7 70.8 79.8
30-40 107 16.7 16.7 96.6
40+ 22 3.4 3.4 100.0
Total 640 99.8 100.0
Missing System 1 .2
Total 641 100.0
3
⊘ This is a preview!⊘
Do you want full access?
Subscribe today to unlock all pages.
Trusted by 1+ million students worldwide
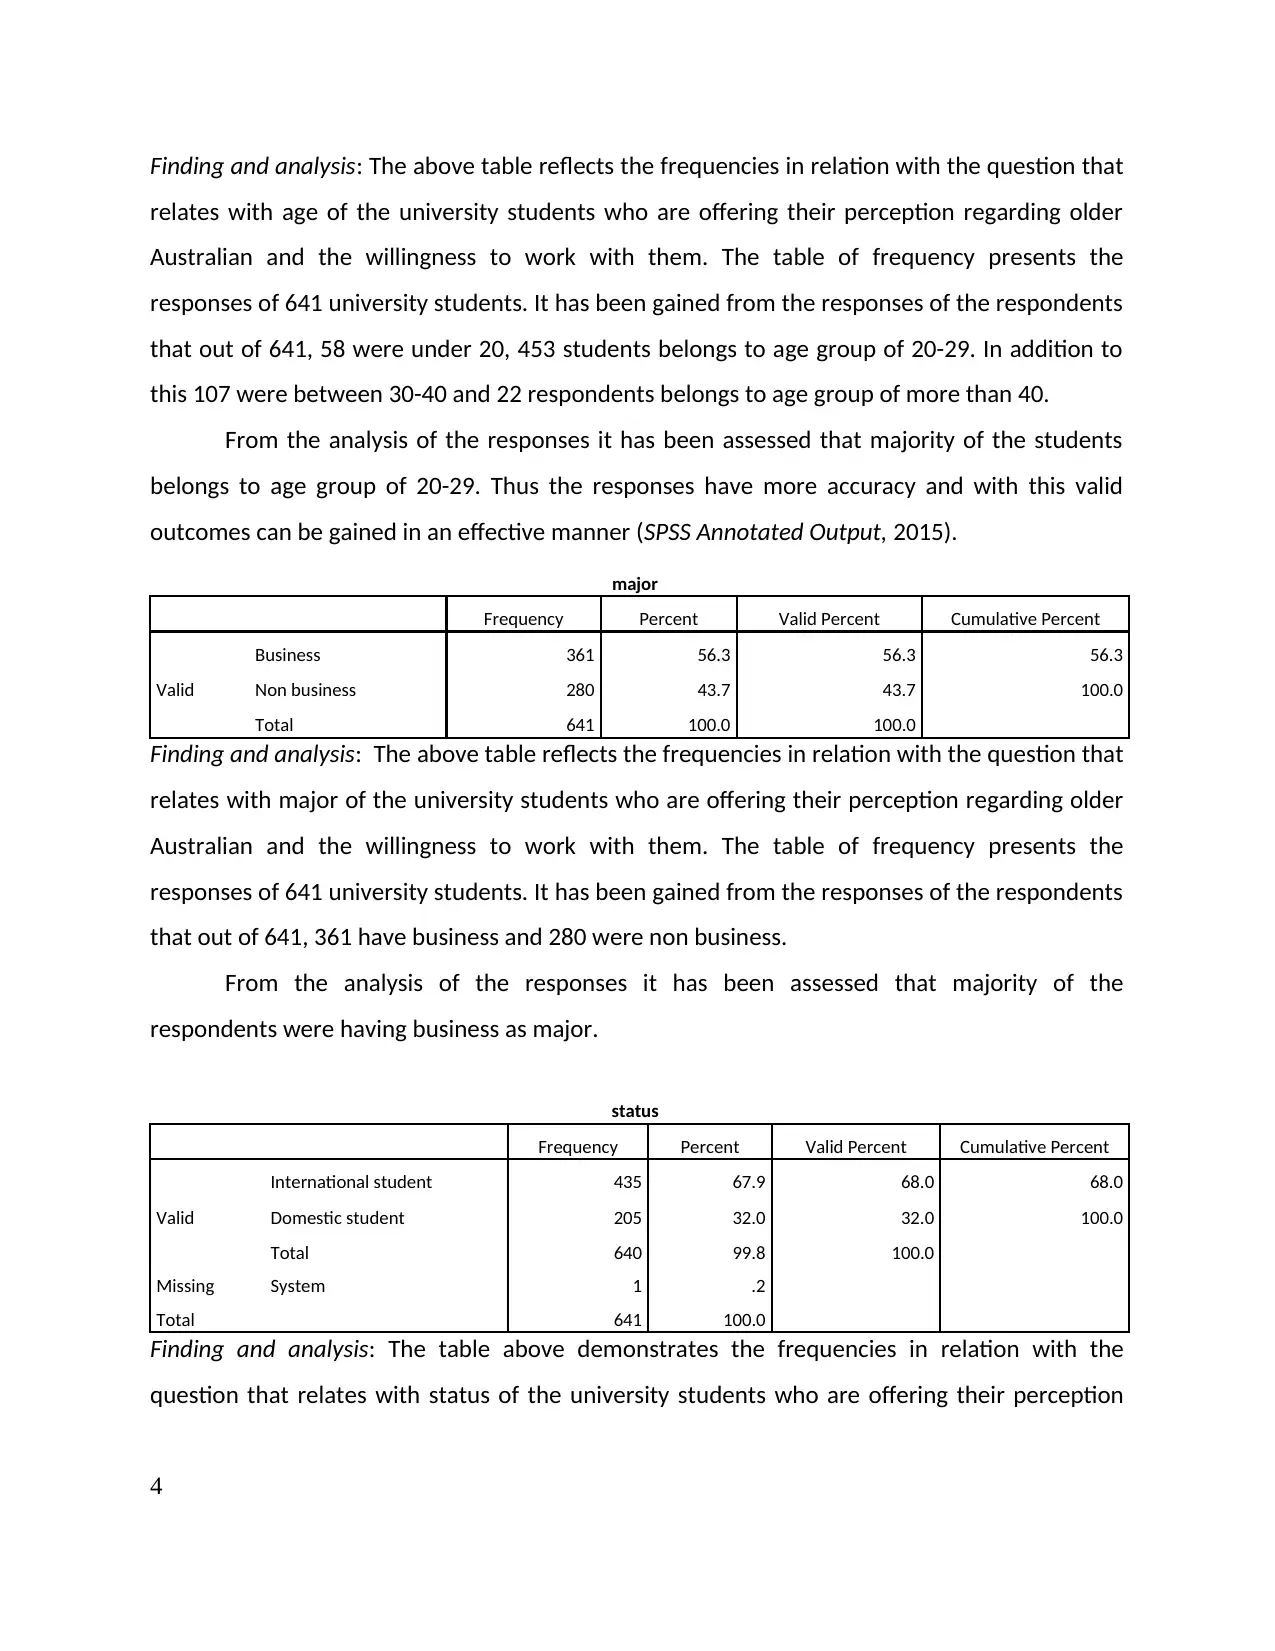
Finding and analysis: The above table reflects the frequencies in relation with the question that
relates with age of the university students who are offering their perception regarding older
Australian and the willingness to work with them. The table of frequency presents the
responses of 641 university students. It has been gained from the responses of the respondents
that out of 641, 58 were under 20, 453 students belongs to age group of 20-29. In addition to
this 107 were between 30-40 and 22 respondents belongs to age group of more than 40.
From the analysis of the responses it has been assessed that majority of the students
belongs to age group of 20-29. Thus the responses have more accuracy and with this valid
outcomes can be gained in an effective manner (SPSS Annotated Output, 2015).
major
Frequency Percent Valid Percent Cumulative Percent
Valid
Business 361 56.3 56.3 56.3
Non business 280 43.7 43.7 100.0
Total 641 100.0 100.0
Finding and analysis: The above table reflects the frequencies in relation with the question that
relates with major of the university students who are offering their perception regarding older
Australian and the willingness to work with them. The table of frequency presents the
responses of 641 university students. It has been gained from the responses of the respondents
that out of 641, 361 have business and 280 were non business.
From the analysis of the responses it has been assessed that majority of the
respondents were having business as major.
status
Frequency Percent Valid Percent Cumulative Percent
Valid
International student 435 67.9 68.0 68.0
Domestic student 205 32.0 32.0 100.0
Total 640 99.8 100.0
Missing System 1 .2
Total 641 100.0
Finding and analysis: The table above demonstrates the frequencies in relation with the
question that relates with status of the university students who are offering their perception
4
Paraphrase This Document
Need a fresh take? Get an instant paraphrase of this document with our AI Paraphraser
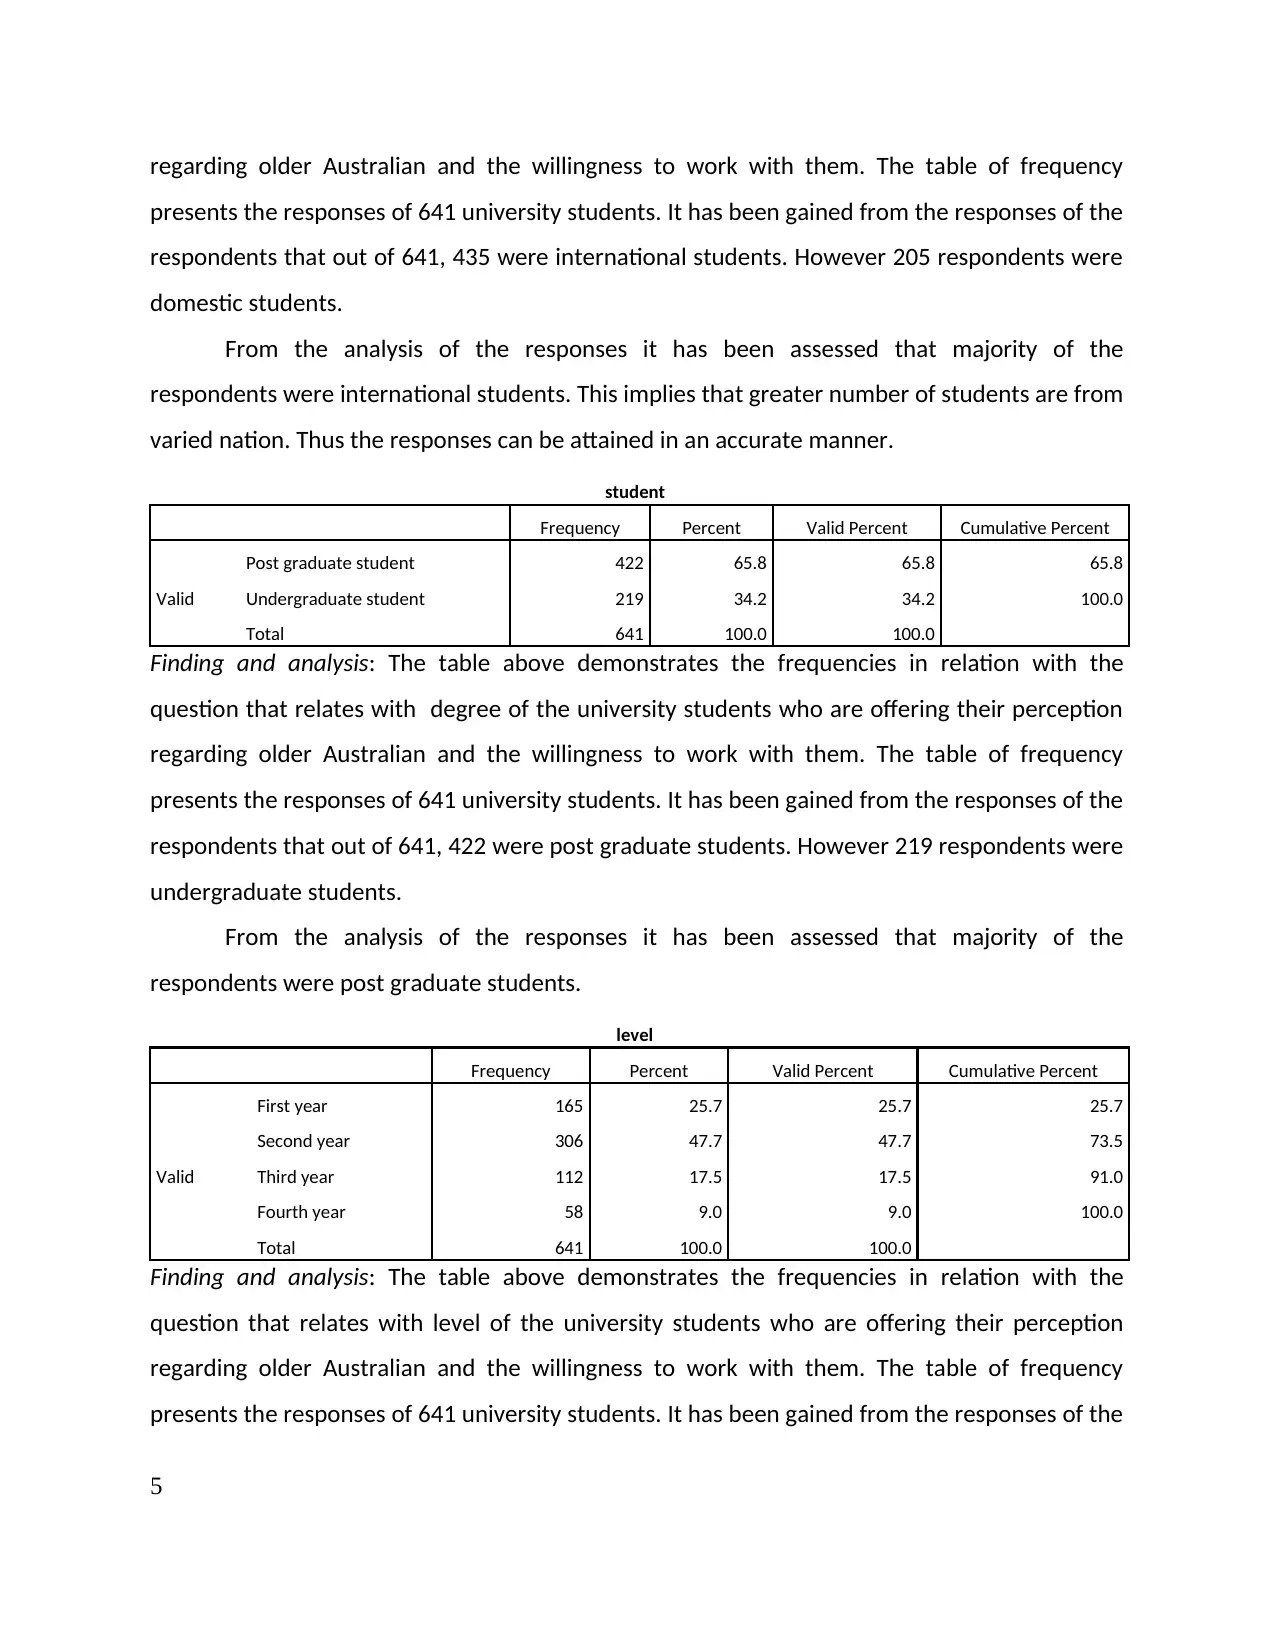
regarding older Australian and the willingness to work with them. The table of frequency
presents the responses of 641 university students. It has been gained from the responses of the
respondents that out of 641, 435 were international students. However 205 respondents were
domestic students.
From the analysis of the responses it has been assessed that majority of the
respondents were international students. This implies that greater number of students are from
varied nation. Thus the responses can be attained in an accurate manner.
student
Frequency Percent Valid Percent Cumulative Percent
Valid
Post graduate student 422 65.8 65.8 65.8
Undergraduate student 219 34.2 34.2 100.0
Total 641 100.0 100.0
Finding and analysis: The table above demonstrates the frequencies in relation with the
question that relates with degree of the university students who are offering their perception
regarding older Australian and the willingness to work with them. The table of frequency
presents the responses of 641 university students. It has been gained from the responses of the
respondents that out of 641, 422 were post graduate students. However 219 respondents were
undergraduate students.
From the analysis of the responses it has been assessed that majority of the
respondents were post graduate students.
level
Frequency Percent Valid Percent Cumulative Percent
Valid
First year 165 25.7 25.7 25.7
Second year 306 47.7 47.7 73.5
Third year 112 17.5 17.5 91.0
Fourth year 58 9.0 9.0 100.0
Total 641 100.0 100.0
Finding and analysis: The table above demonstrates the frequencies in relation with the
question that relates with level of the university students who are offering their perception
regarding older Australian and the willingness to work with them. The table of frequency
presents the responses of 641 university students. It has been gained from the responses of the
5
presents the responses of 641 university students. It has been gained from the responses of the
respondents that out of 641, 435 were international students. However 205 respondents were
domestic students.
From the analysis of the responses it has been assessed that majority of the
respondents were international students. This implies that greater number of students are from
varied nation. Thus the responses can be attained in an accurate manner.
student
Frequency Percent Valid Percent Cumulative Percent
Valid
Post graduate student 422 65.8 65.8 65.8
Undergraduate student 219 34.2 34.2 100.0
Total 641 100.0 100.0
Finding and analysis: The table above demonstrates the frequencies in relation with the
question that relates with degree of the university students who are offering their perception
regarding older Australian and the willingness to work with them. The table of frequency
presents the responses of 641 university students. It has been gained from the responses of the
respondents that out of 641, 422 were post graduate students. However 219 respondents were
undergraduate students.
From the analysis of the responses it has been assessed that majority of the
respondents were post graduate students.
level
Frequency Percent Valid Percent Cumulative Percent
Valid
First year 165 25.7 25.7 25.7
Second year 306 47.7 47.7 73.5
Third year 112 17.5 17.5 91.0
Fourth year 58 9.0 9.0 100.0
Total 641 100.0 100.0
Finding and analysis: The table above demonstrates the frequencies in relation with the
question that relates with level of the university students who are offering their perception
regarding older Australian and the willingness to work with them. The table of frequency
presents the responses of 641 university students. It has been gained from the responses of the
5
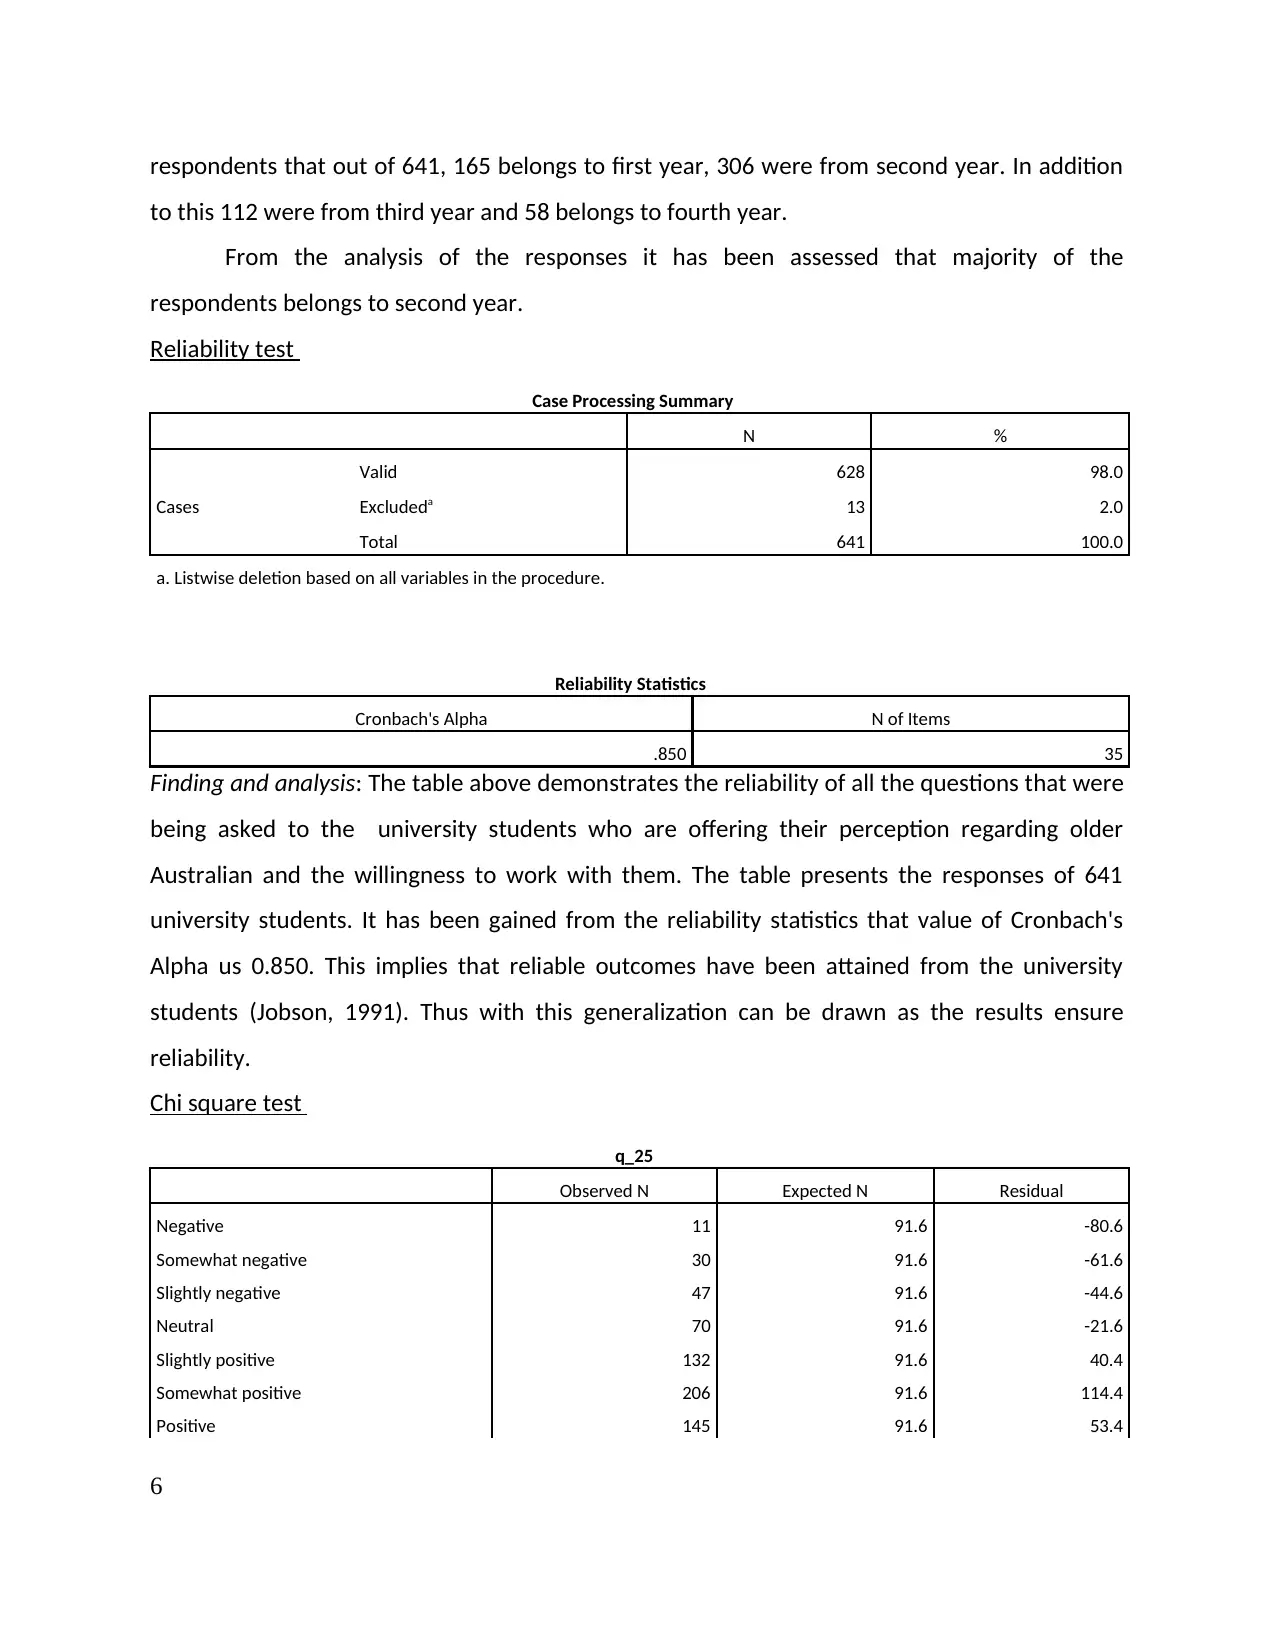
respondents that out of 641, 165 belongs to first year, 306 were from second year. In addition
to this 112 were from third year and 58 belongs to fourth year.
From the analysis of the responses it has been assessed that majority of the
respondents belongs to second year.
Reliability test
Case Processing Summary
N %
Cases
Valid 628 98.0
Excludeda 13 2.0
Total 641 100.0
a. Listwise deletion based on all variables in the procedure.
Reliability Statistics
Cronbach's Alpha N of Items
.850 35
Finding and analysis: The table above demonstrates the reliability of all the questions that were
being asked to the university students who are offering their perception regarding older
Australian and the willingness to work with them. The table presents the responses of 641
university students. It has been gained from the reliability statistics that value of Cronbach's
Alpha us 0.850. This implies that reliable outcomes have been attained from the university
students (Jobson, 1991). Thus with this generalization can be drawn as the results ensure
reliability.
Chi square test
q_25
Observed N Expected N Residual
Negative 11 91.6 -80.6
Somewhat negative 30 91.6 -61.6
Slightly negative 47 91.6 -44.6
Neutral 70 91.6 -21.6
Slightly positive 132 91.6 40.4
Somewhat positive 206 91.6 114.4
Positive 145 91.6 53.4
6
⊘ This is a preview!⊘
Do you want full access?
Subscribe today to unlock all pages.
Trusted by 1+ million students worldwide
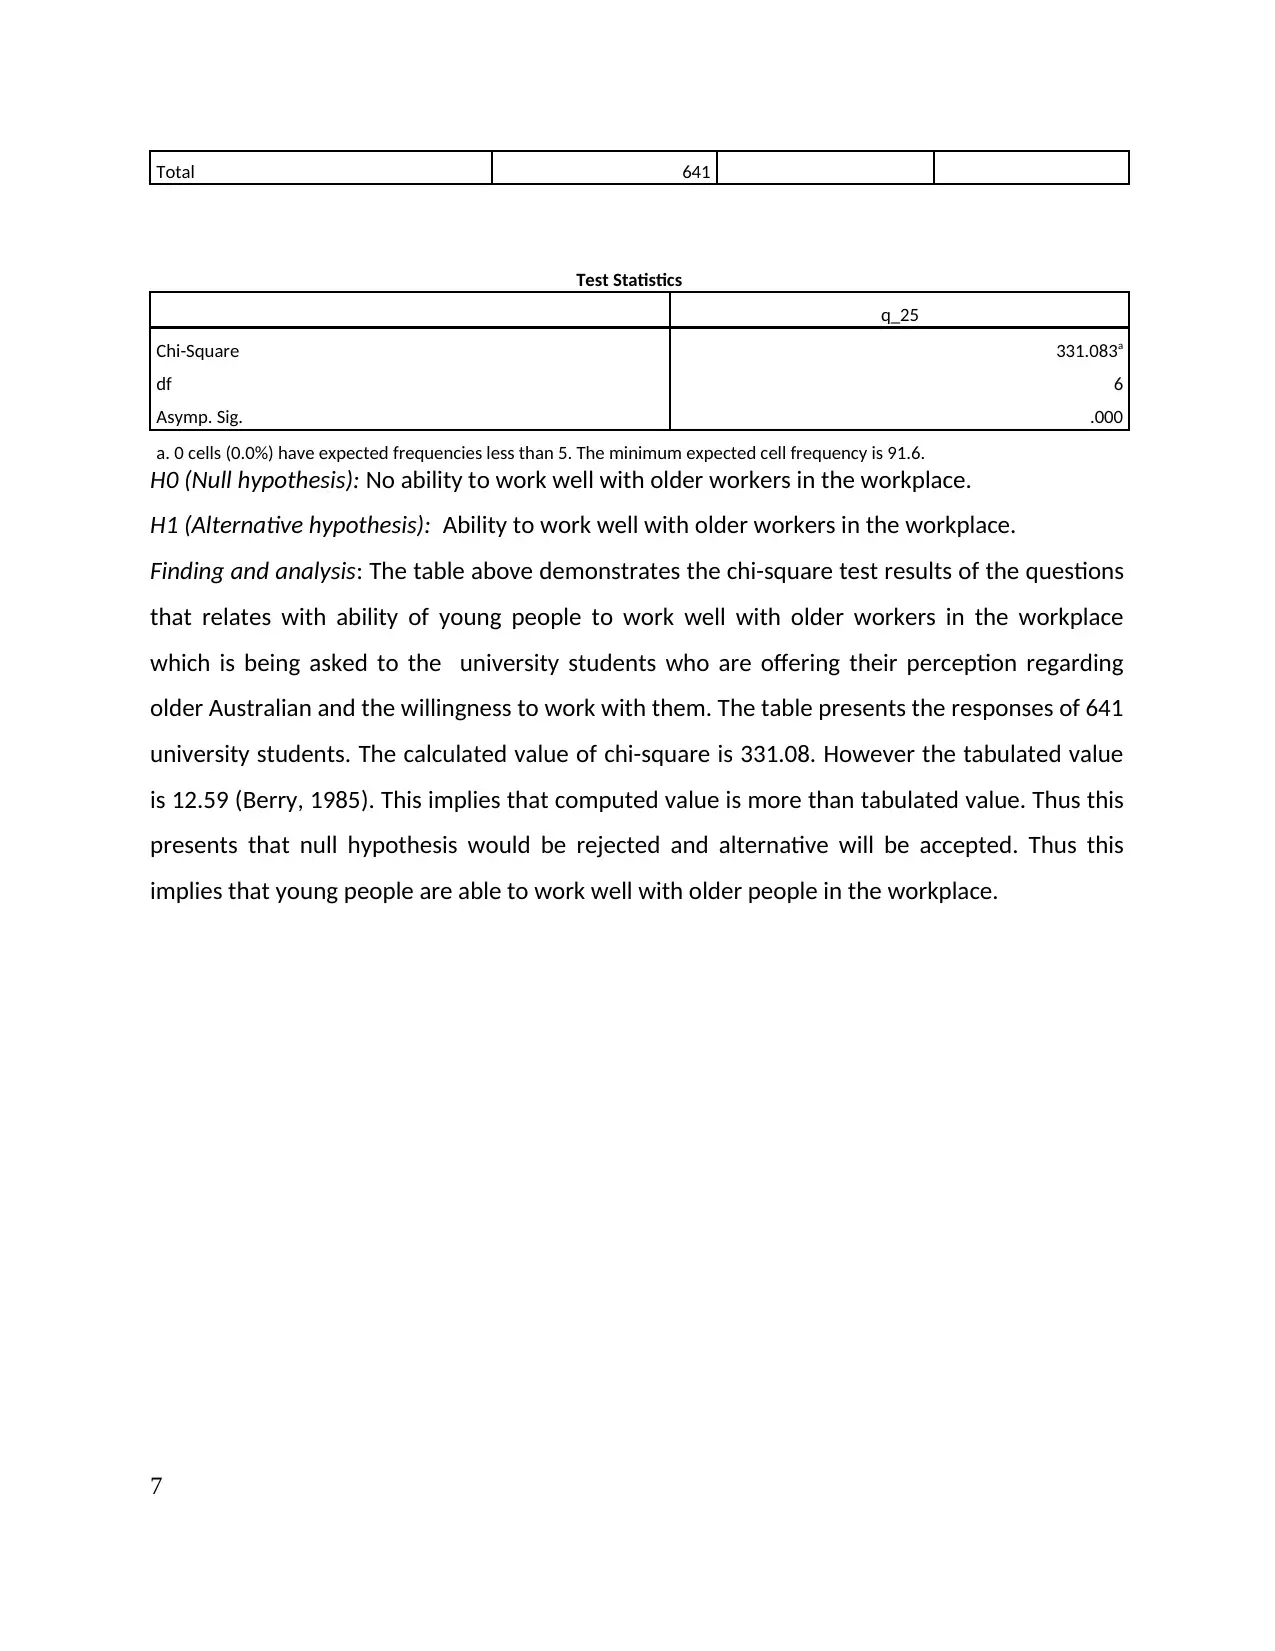
Total 641
Test Statistics
q_25
Chi-Square 331.083a
df 6
Asymp. Sig. .000
a. 0 cells (0.0%) have expected frequencies less than 5. The minimum expected cell frequency is 91.6.
H0 (Null hypothesis): No ability to work well with older workers in the workplace.
H1 (Alternative hypothesis): Ability to work well with older workers in the workplace.
Finding and analysis: The table above demonstrates the chi-square test results of the questions
that relates with ability of young people to work well with older workers in the workplace
which is being asked to the university students who are offering their perception regarding
older Australian and the willingness to work with them. The table presents the responses of 641
university students. The calculated value of chi-square is 331.08. However the tabulated value
is 12.59 (Berry, 1985). This implies that computed value is more than tabulated value. Thus this
presents that null hypothesis would be rejected and alternative will be accepted. Thus this
implies that young people are able to work well with older people in the workplace.
7
Paraphrase This Document
Need a fresh take? Get an instant paraphrase of this document with our AI Paraphraser
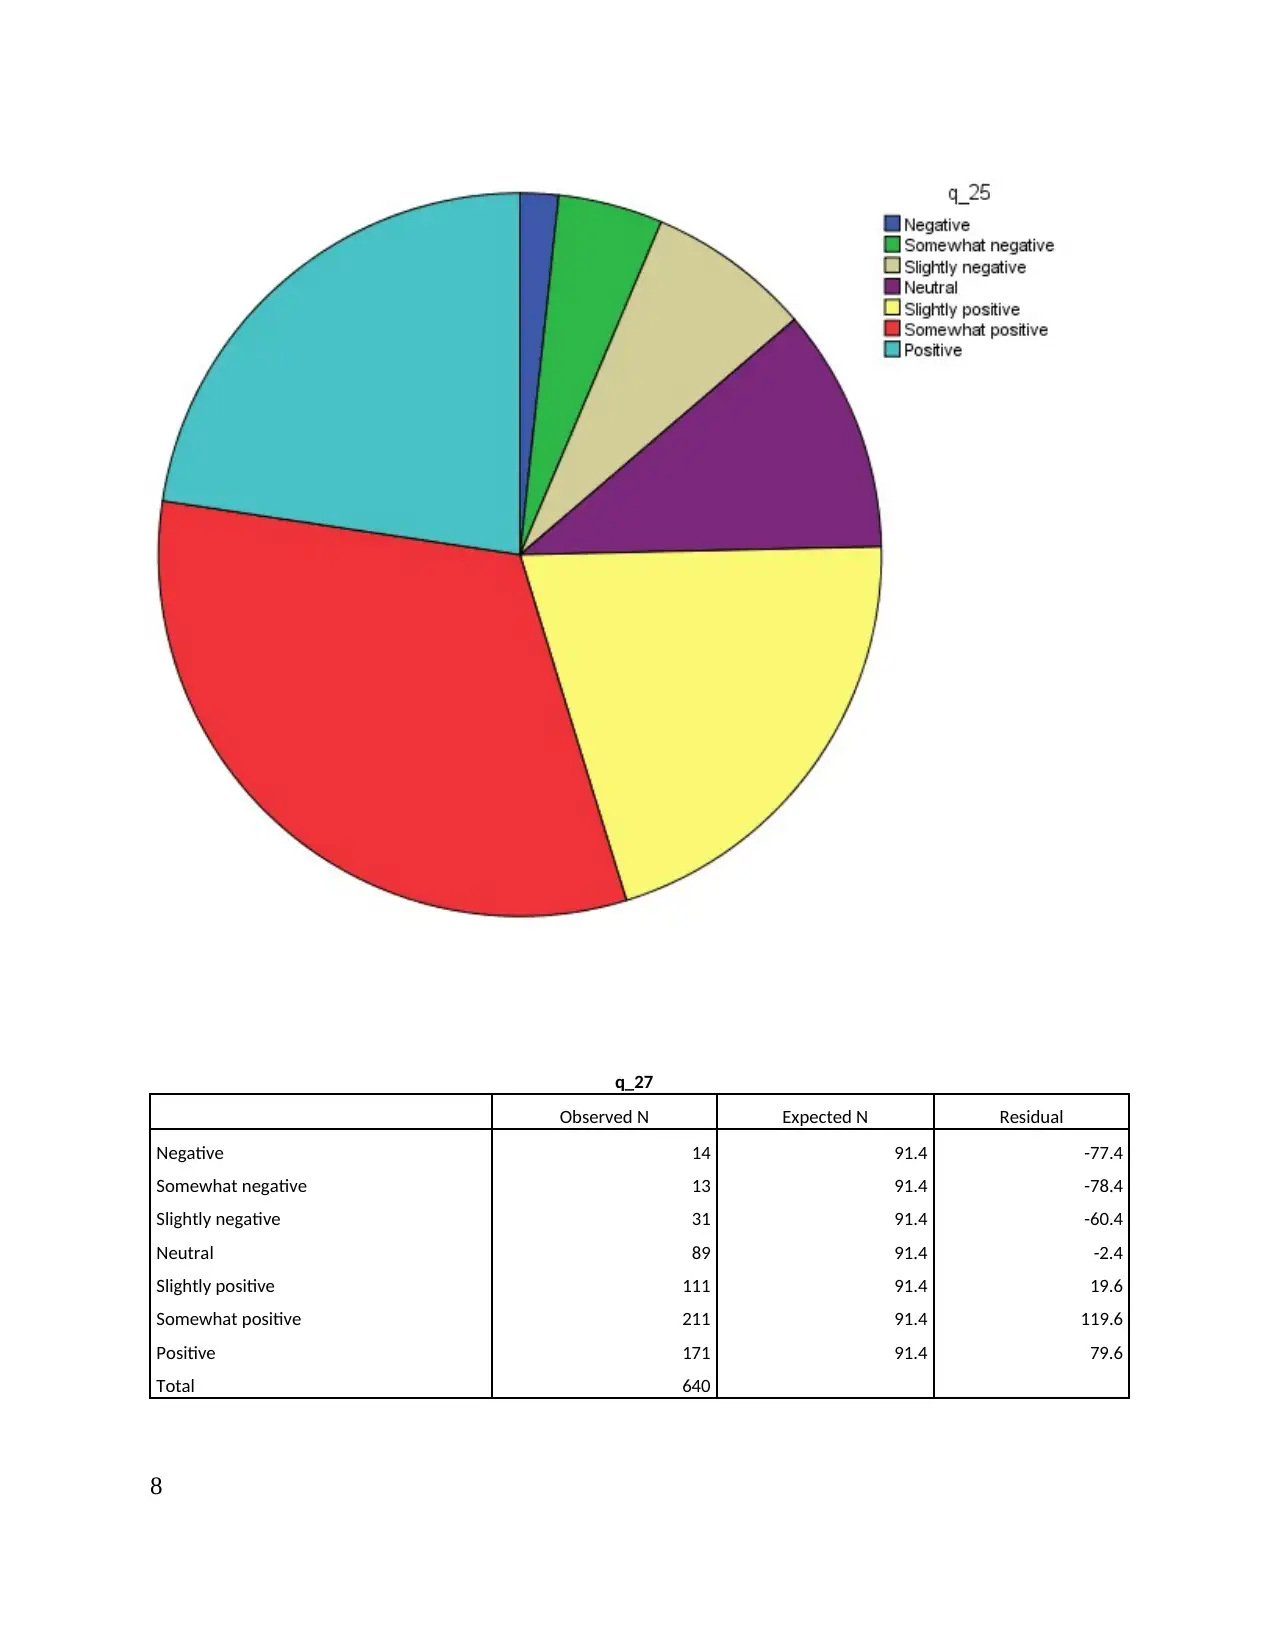
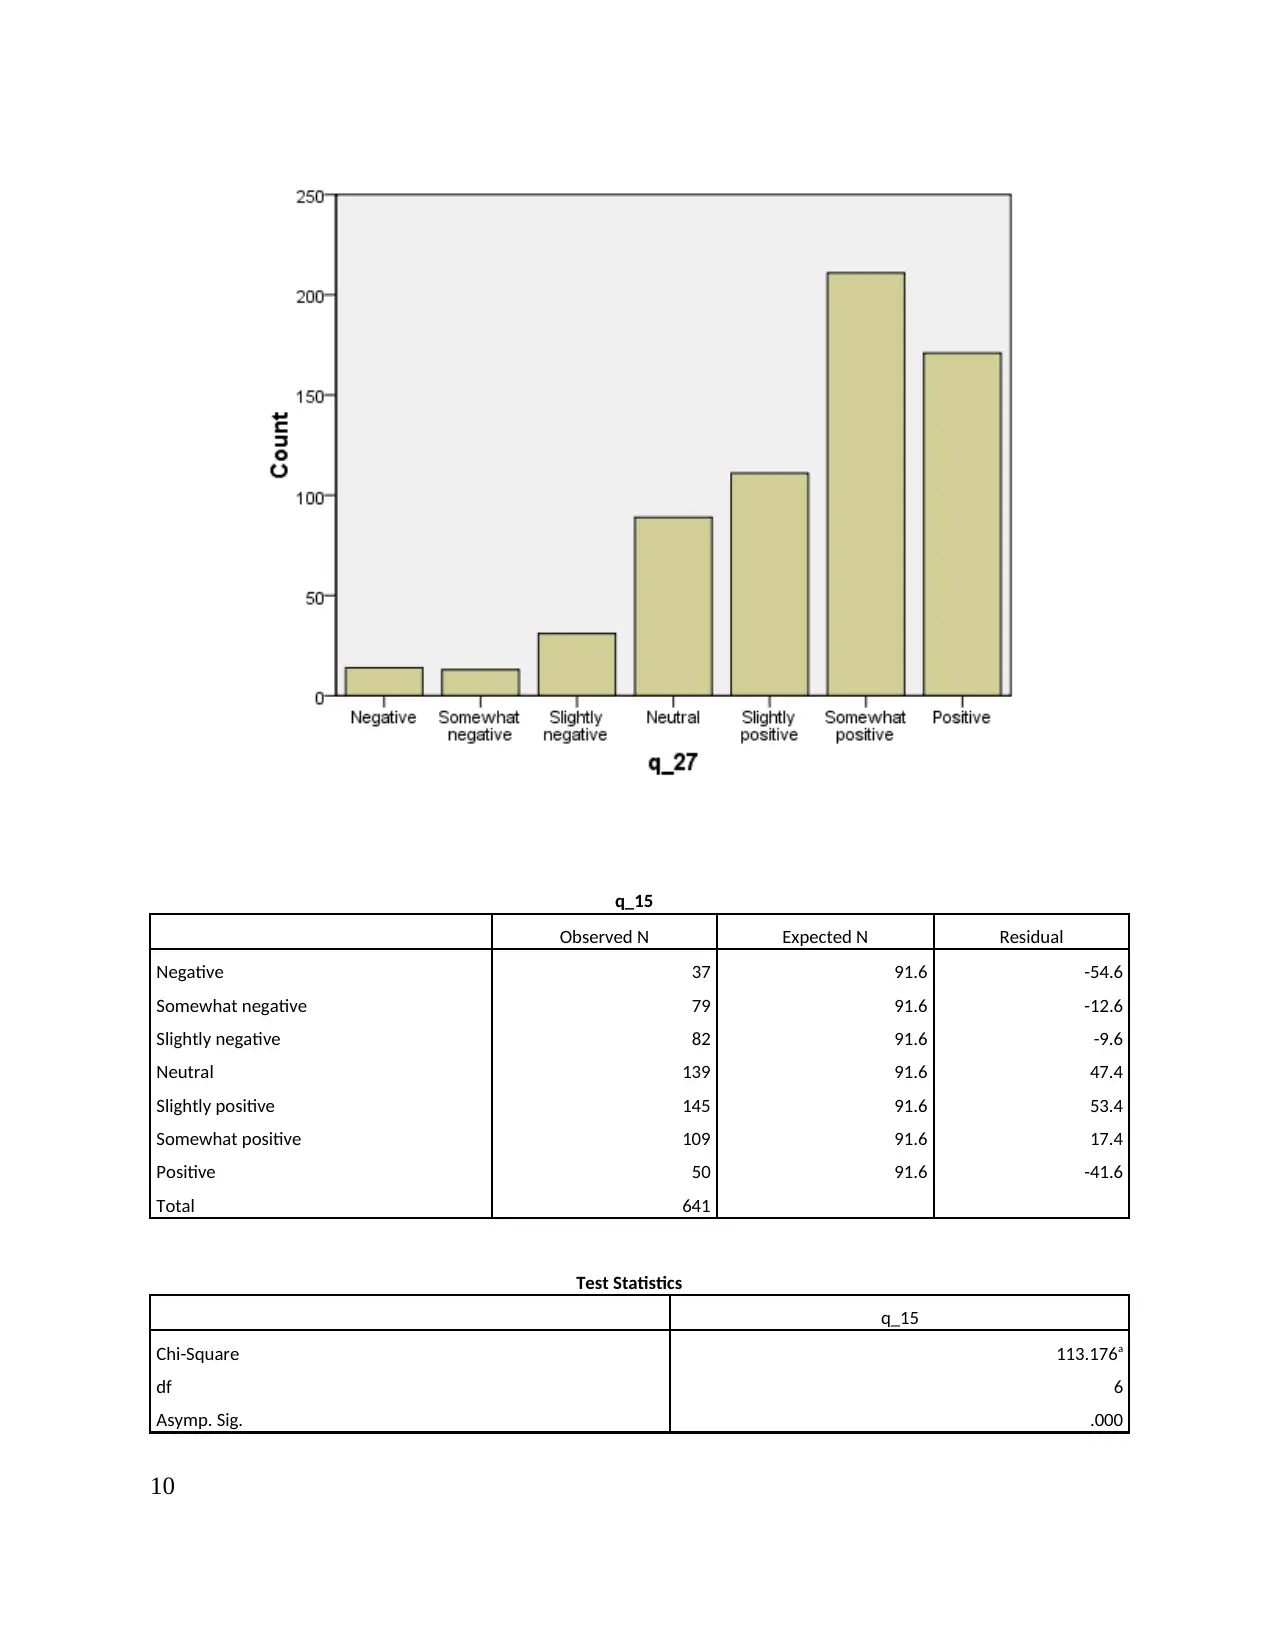
q_27
Observed N Expected N Residual
Negative 14 91.4 -77.4
Somewhat negative 13 91.4 -78.4
Slightly negative 31 91.4 -60.4
Neutral 89 91.4 -2.4
Slightly positive 111 91.4 19.6
Somewhat positive 211 91.4 119.6
Positive 171 91.4 79.6
Total 640
8
Observed N Expected N Residual
Negative 14 91.4 -77.4
Somewhat negative 13 91.4 -78.4
Slightly negative 31 91.4 -60.4
Neutral 89 91.4 -2.4
Slightly positive 111 91.4 19.6
Somewhat positive 211 91.4 119.6
Positive 171 91.4 79.6
Total 640
8
Test Statistics
q_27
Chi-Square 402.672a
df 6
Asymp. Sig. .000
a. 0 cells (0.0%) have expected frequencies less than 5. The minimum expected cell frequency is 91.4.
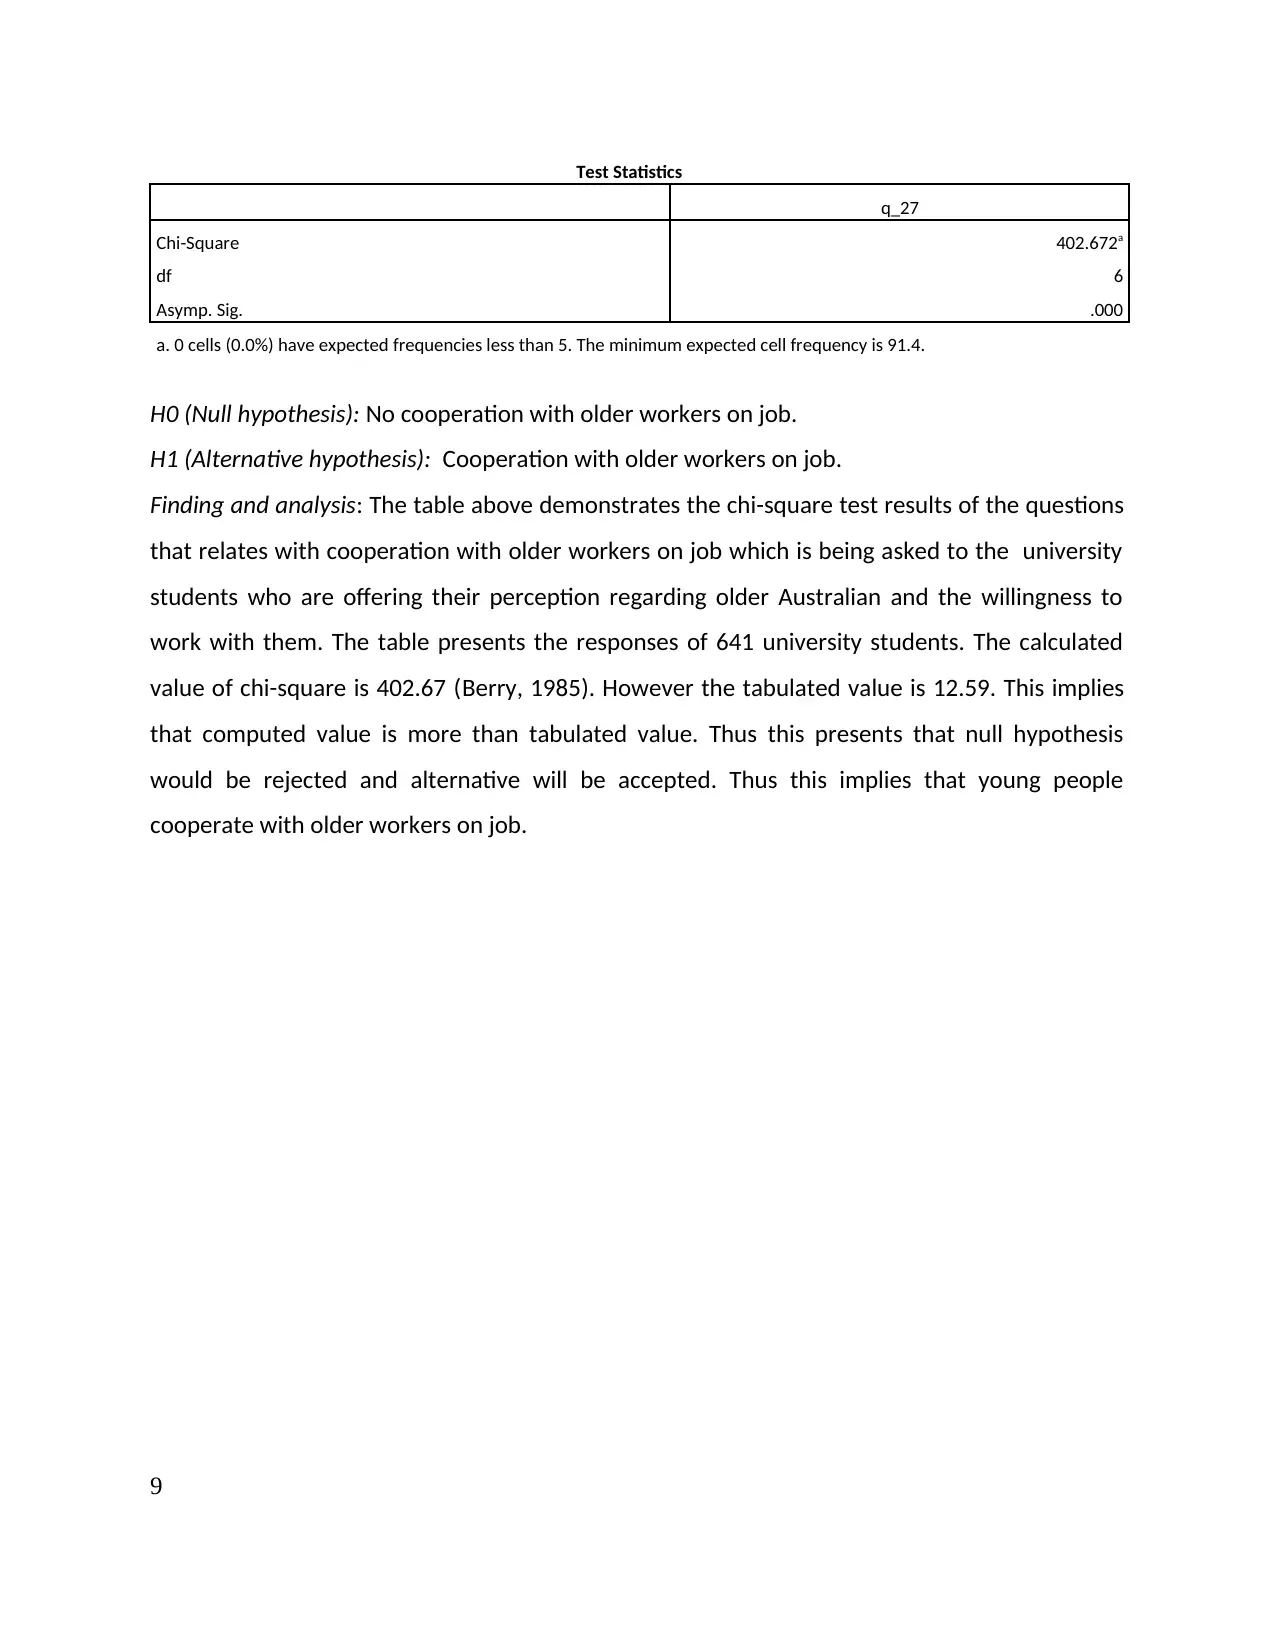
H0 (Null hypothesis): No cooperation with older workers on job.
H1 (Alternative hypothesis): Cooperation with older workers on job.
Finding and analysis: The table above demonstrates the chi-square test results of the questions
that relates with cooperation with older workers on job which is being asked to the university
students who are offering their perception regarding older Australian and the willingness to
work with them. The table presents the responses of 641 university students. The calculated
value of chi-square is 402.67 (Berry, 1985). However the tabulated value is 12.59. This implies
that computed value is more than tabulated value. Thus this presents that null hypothesis
would be rejected and alternative will be accepted. Thus this implies that young people
cooperate with older workers on job.
9
q_27
Chi-Square 402.672a
df 6
Asymp. Sig. .000
a. 0 cells (0.0%) have expected frequencies less than 5. The minimum expected cell frequency is 91.4.
H0 (Null hypothesis): No cooperation with older workers on job.
H1 (Alternative hypothesis): Cooperation with older workers on job.
Finding and analysis: The table above demonstrates the chi-square test results of the questions
that relates with cooperation with older workers on job which is being asked to the university
students who are offering their perception regarding older Australian and the willingness to
work with them. The table presents the responses of 641 university students. The calculated
value of chi-square is 402.67 (Berry, 1985). However the tabulated value is 12.59. This implies
that computed value is more than tabulated value. Thus this presents that null hypothesis
would be rejected and alternative will be accepted. Thus this implies that young people
cooperate with older workers on job.
9
⊘ This is a preview!⊘
Do you want full access?
Subscribe today to unlock all pages.
Trusted by 1+ million students worldwide
q_15
Observed N Expected N Residual
Negative 37 91.6 -54.6
Somewhat negative 79 91.6 -12.6
Slightly negative 82 91.6 -9.6
Neutral 139 91.6 47.4
Slightly positive 145 91.6 53.4
Somewhat positive 109 91.6 17.4
Positive 50 91.6 -41.6
Total 641
Test Statistics
q_15
Chi-Square 113.176a
df 6
Asymp. Sig. .000
10
Paraphrase This Document
Need a fresh take? Get an instant paraphrase of this document with our AI Paraphraser
a. 0 cells (0.0%) have expected frequencies less than 5. The minimum expected cell frequency is 91.6.
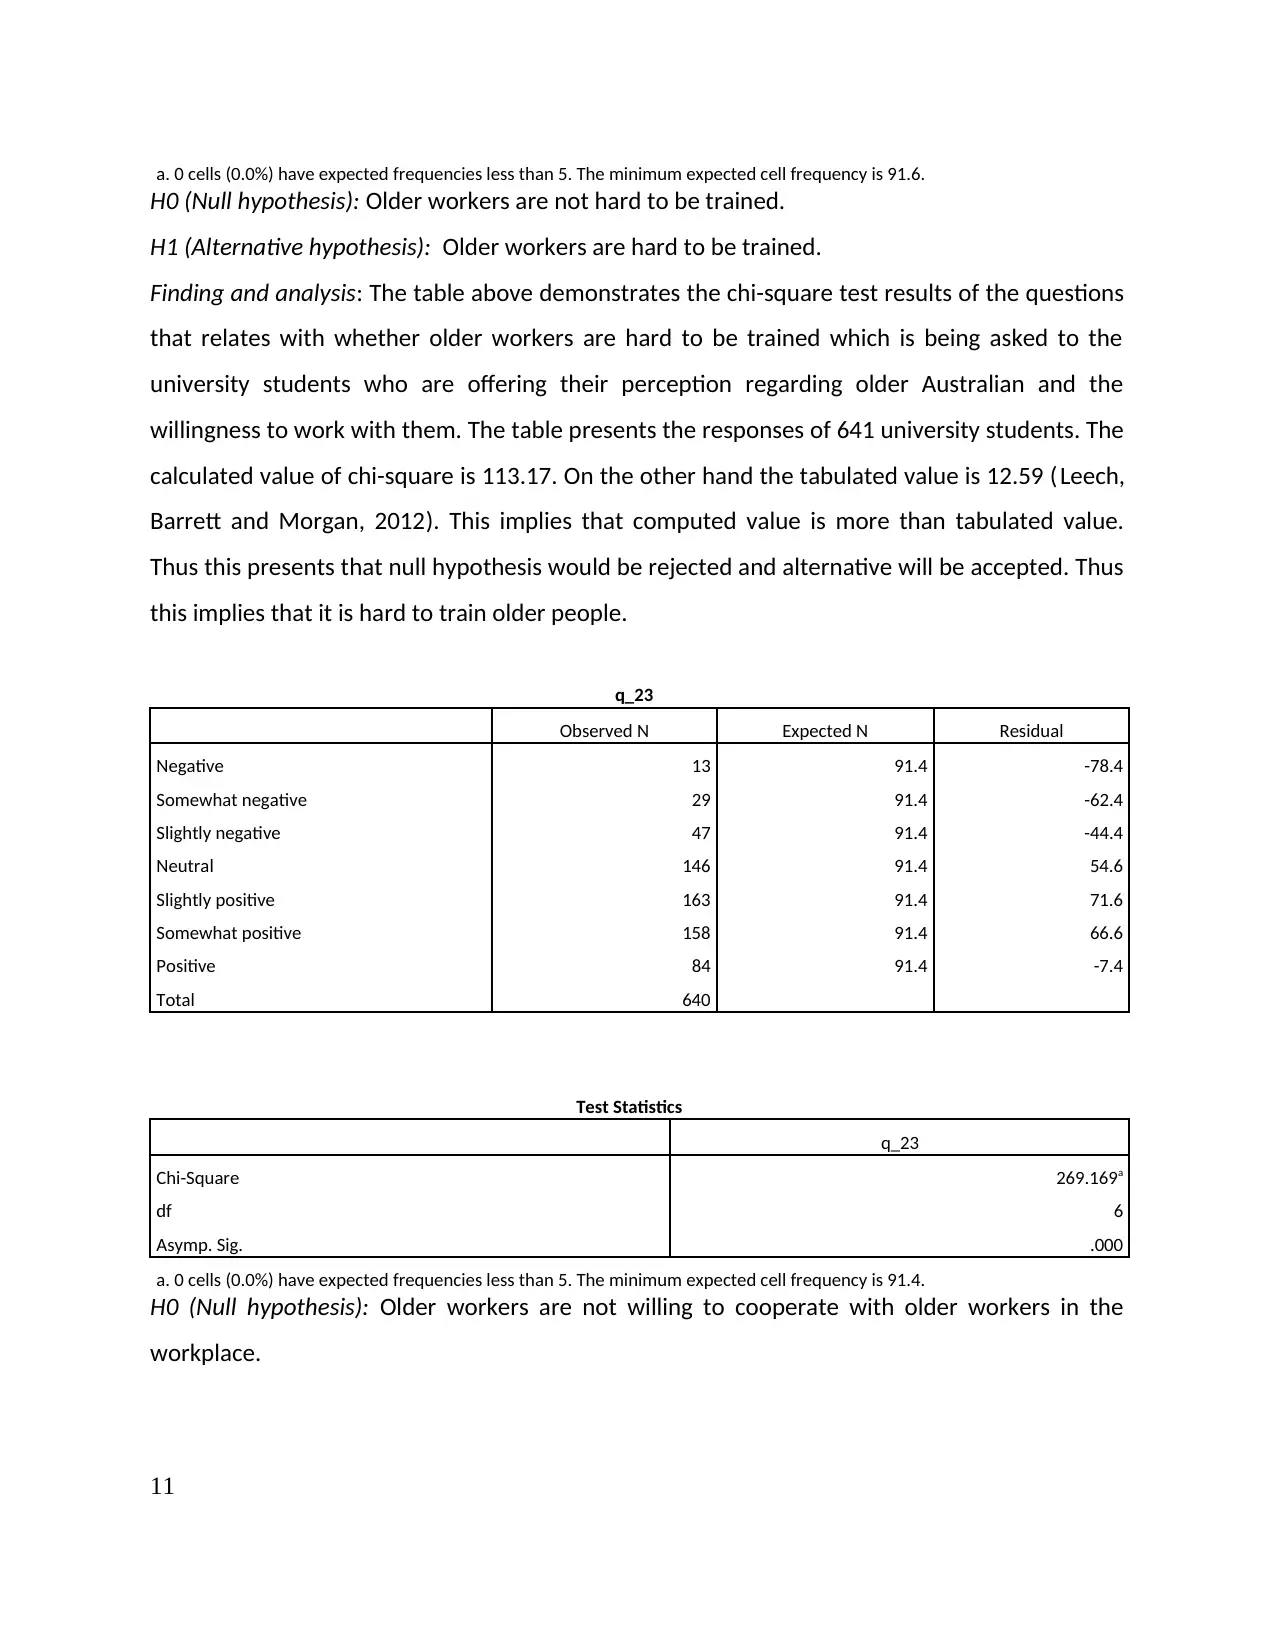
H0 (Null hypothesis): Older workers are not hard to be trained.
H1 (Alternative hypothesis): Older workers are hard to be trained.
Finding and analysis: The table above demonstrates the chi-square test results of the questions
that relates with whether older workers are hard to be trained which is being asked to the
university students who are offering their perception regarding older Australian and the
willingness to work with them. The table presents the responses of 641 university students. The
calculated value of chi-square is 113.17. On the other hand the tabulated value is 12.59 (Leech,
Barrett and Morgan, 2012). This implies that computed value is more than tabulated value.
Thus this presents that null hypothesis would be rejected and alternative will be accepted. Thus
this implies that it is hard to train older people.
q_23
Observed N Expected N Residual
Negative 13 91.4 -78.4
Somewhat negative 29 91.4 -62.4
Slightly negative 47 91.4 -44.4
Neutral 146 91.4 54.6
Slightly positive 163 91.4 71.6
Somewhat positive 158 91.4 66.6
Positive 84 91.4 -7.4
Total 640
Test Statistics
q_23
Chi-Square 269.169a
df 6
Asymp. Sig. .000
a. 0 cells (0.0%) have expected frequencies less than 5. The minimum expected cell frequency is 91.4.
H0 (Null hypothesis): Older workers are not willing to cooperate with older workers in the
workplace.
11
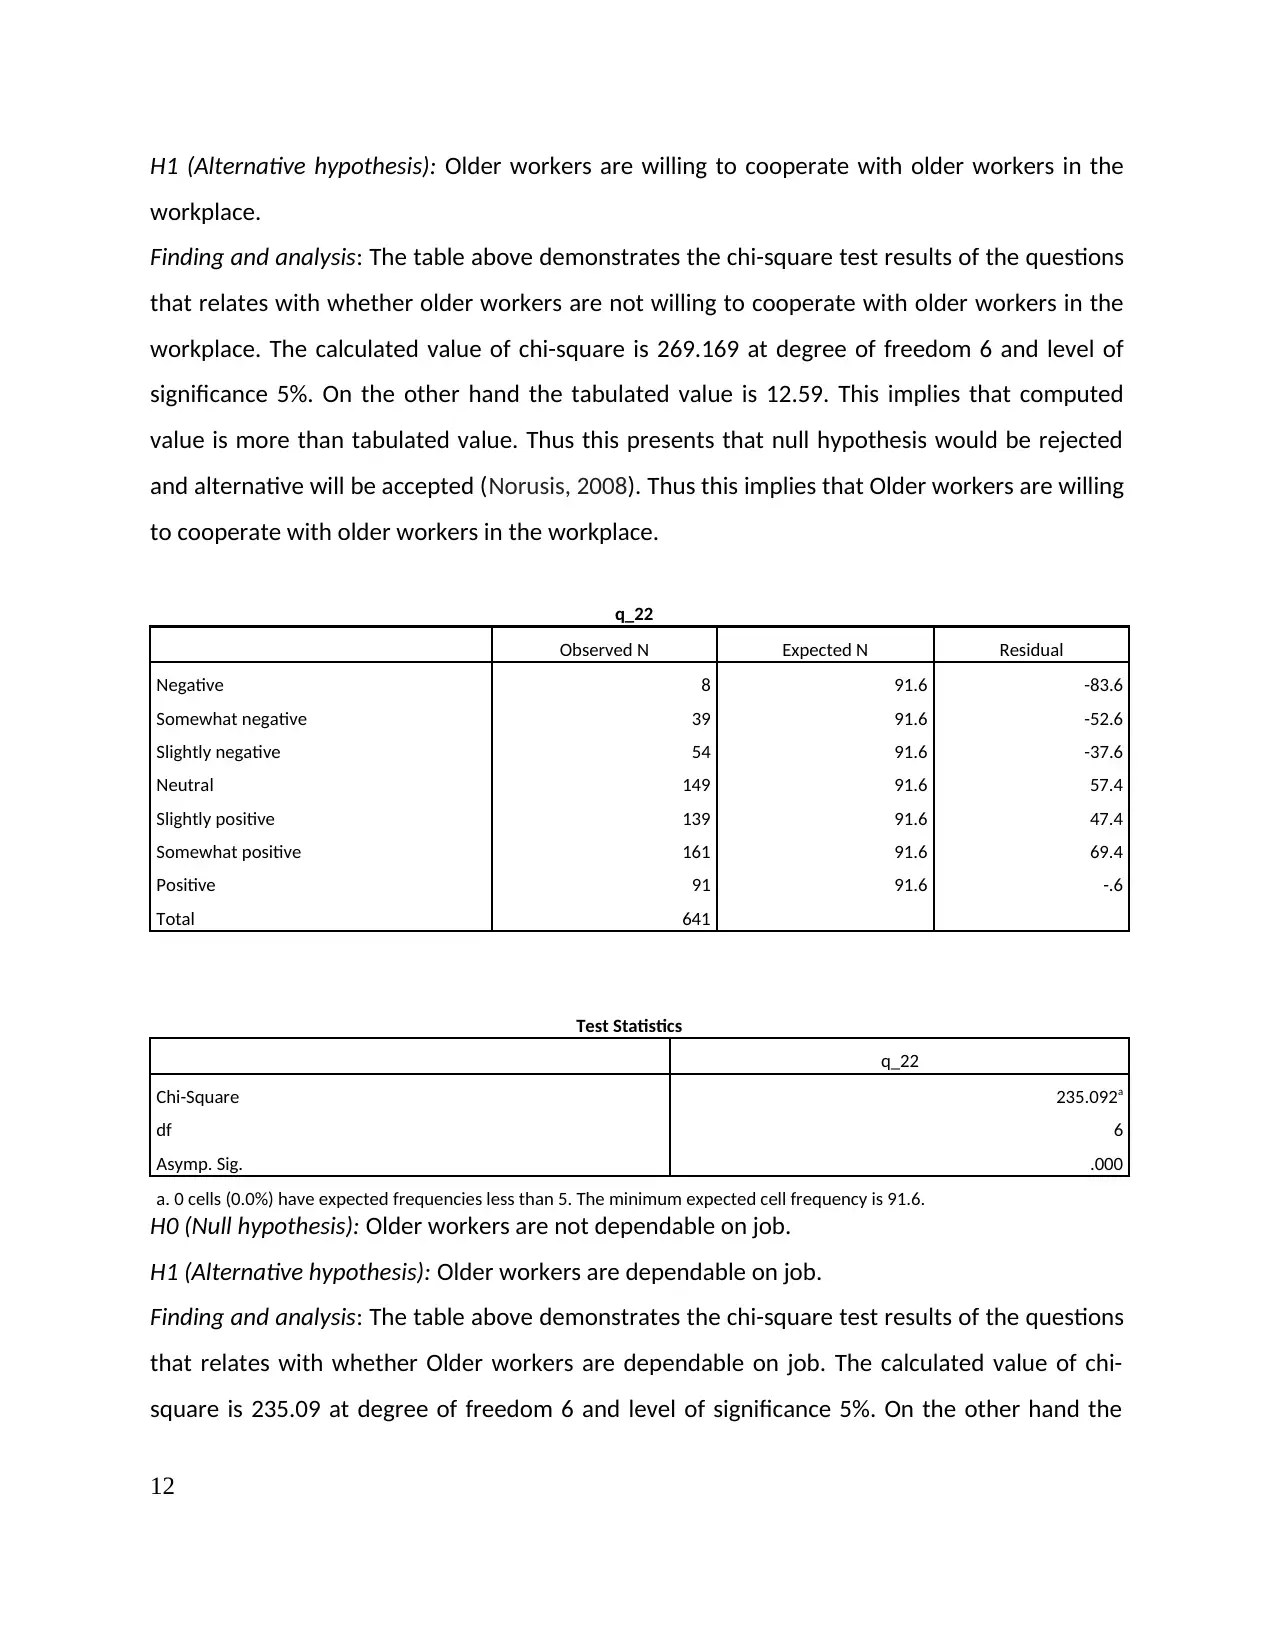
H1 (Alternative hypothesis): Older workers are willing to cooperate with older workers in the
workplace.
Finding and analysis: The table above demonstrates the chi-square test results of the questions
that relates with whether older workers are not willing to cooperate with older workers in the
workplace. The calculated value of chi-square is 269.169 at degree of freedom 6 and level of
significance 5%. On the other hand the tabulated value is 12.59. This implies that computed
value is more than tabulated value. Thus this presents that null hypothesis would be rejected
and alternative will be accepted (Norusis, 2008). Thus this implies that Older workers are willing
to cooperate with older workers in the workplace.
q_22
Observed N Expected N Residual
Negative 8 91.6 -83.6
Somewhat negative 39 91.6 -52.6
Slightly negative 54 91.6 -37.6
Neutral 149 91.6 57.4
Slightly positive 139 91.6 47.4
Somewhat positive 161 91.6 69.4
Positive 91 91.6 -.6
Total 641
Test Statistics
q_22
Chi-Square 235.092a
df 6
Asymp. Sig. .000
a. 0 cells (0.0%) have expected frequencies less than 5. The minimum expected cell frequency is 91.6.
H0 (Null hypothesis): Older workers are not dependable on job.
H1 (Alternative hypothesis): Older workers are dependable on job.
Finding and analysis: The table above demonstrates the chi-square test results of the questions
that relates with whether Older workers are dependable on job. The calculated value of chi-
square is 235.09 at degree of freedom 6 and level of significance 5%. On the other hand the
12
⊘ This is a preview!⊘
Do you want full access?
Subscribe today to unlock all pages.
Trusted by 1+ million students worldwide
1 out of 18

Your All-in-One AI-Powered Toolkit for Academic Success.
+13062052269
info@desklib.com
Available 24*7 on WhatsApp / Email
![[object Object]](/_next/static/media/star-bottom.7253800d.svg)
Unlock your academic potential
Copyright © 2020–2026 A2Z Services. All Rights Reserved. Developed and managed by ZUCOL.