Explain the Perfect Substitute and Indifference Curve

Introduction to Indifference Curve and Perfect Substitutes
An Indifference curve shows potential combinations of two items or commodities that, when bought in any order along the curve, leave the buyer equally well off or satisfied.
For Example:
If you enjoy both pizza and pasta, for example, you might not care whether you purchase 20 pizzas and no pasta, 35 pizza, and no pasta, or some combination of the two, such as 14 pasta and 10 pizzas. Either combination is equally useful.
A straightforward two-dimensional chart is used to operate in the standard indifference curve analysis. Each axis depicts a certain class of economic goods. Because every combination of commodities represented by a point on the indifference curve offers the same level of utility to the consumer, the consumer is indifferent along the whole length of the curve.
What is explained by an Indifference Curve?
Economists use an indifference curve to describe the compromises people make when they are presented with two products they want to purchase. People are limited by their ability to spend money, so they cannot buy everything. A cost-benefit analysis must be taken into account instead. Indifference curves visually represent this tradeoff by displaying the quantities of two alternative products that give a consumer the same utility (i.e., where they remain indifferent).
Definition of Perfect Substitute
A perfect substitute is a good or service that, regardless of the business that provides it, customers view as being exactly the same no matter which business provides it. The business from whom a buyer purchases a good is irrelevant to them. Standardized goods are excellent replacements.
Goods that can be substituted for another to satisfy a person's want or need are those that are equivalent to or similar to the original. Imperfect substitutes, in contrast to perfect substitutes, do not deliver the same amount of enjoyment. These could fall under the same category or a distinct one.
For instance, a bicycle can serve as an alternative to a car because both satisfy the requirement for transportation, even though they may fall under different product categories depending on how they were made, etc. Another illustration that belongs in the same genre as Pepsi and Coca-Cola. If Coca-Cola is unavailable, Pepsi may be consumed, and vice versa.
“ From the Reference “
Recognizing preferences
All of the money that rational consumers earn will be spent, which means that they will create somewhere along the line of their budget. Their output ultimately depends on personal choices. Remember John, who had the option to purchase movies or T-shirts?
"John’s Budget Line - Diagram"
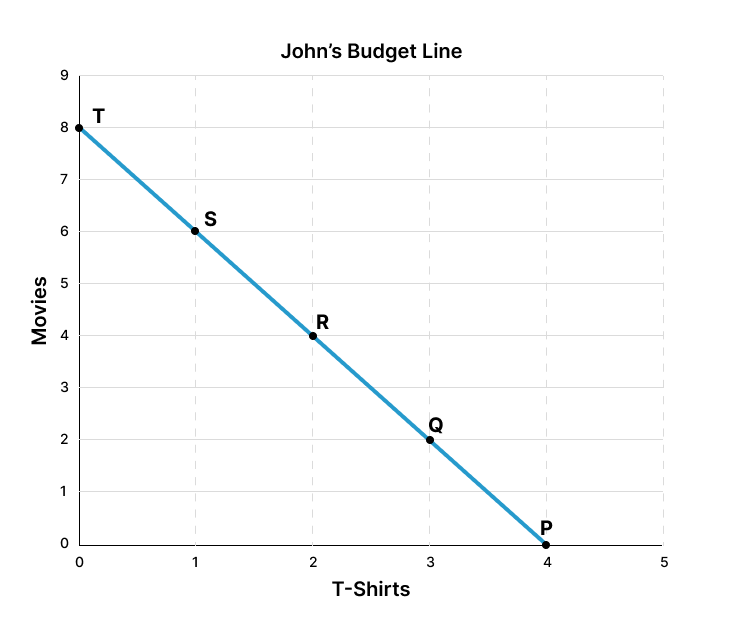
John would spend all of his money on T-shirts and nothing on movies if he loved T-shirts but hated movies. To put it another way, he will choose bundle P.
John will spend all of his money on movies and none on T-shirts if he enjoys movies but despises T-shirts. To put it another way, he will choose bundle T.
Customers typically favor a combination of both things. The intensity of their preferences, as determined by the idea of utility, determines where people choose to consume. Daniel Bernoulli coined the term "utility," which describes the overall satisfaction one feels after consuming a good or service. Utility gauges how happy we are as consumers. We can graph our preferences using the idea of utility.
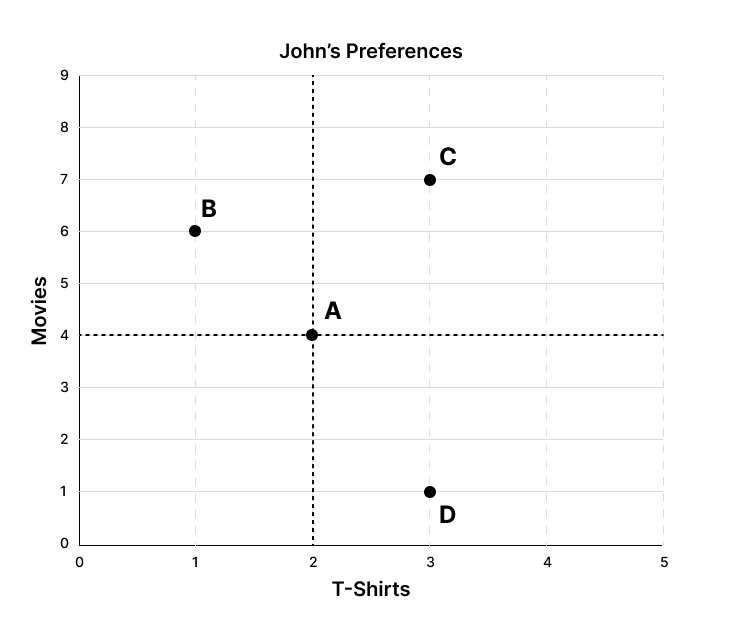
The consumption bundles that the customer regards as being equal are represented by an indifference curve. Anywhere on the indifference curve, the consumer is equally content to consume.
Take a look at the above diagram to have a better understanding of this, which shows a number of potential consumption places. What can we infer about John's consumption habits based on the information we currently possess? Would John like another bundle more if he were at point A?
Point C - John continues to see more movies and buy more t-shirts at point C. John is better off in point C because having more things makes him happier.
Point B - John watches more movies but fewer T-shirts at point B. We cannot determine whether John is better or worse off because we are unsure of his preferences.
Point D - At point D, John consumes more T-shirts than movies. We cannot determine whether John is better or worse off because we are unsure of his preferences.
"John’s Preferences Diagram"
Perfect Substitutes -
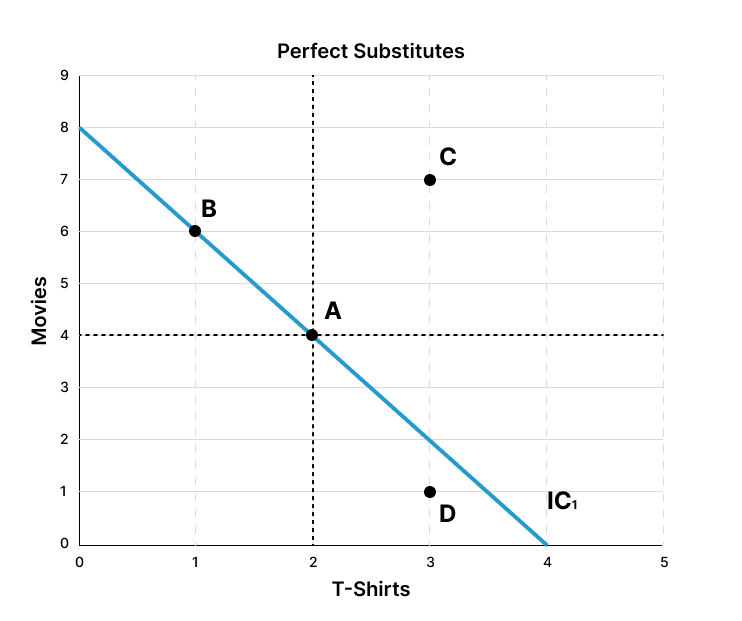
Let's start with a straightforward illustration of John's choices and say he sees T-shirts and movies as almost ideal replacements. John wouldn't care whether he got movies or t-shirts if the two products were a perfect substitute for one another. Let's instead imagine that John enjoys T-shirts twice as much as he does movies, in which case he would be just as content with 4 T-shirts as he would be with 8 films.
If John were to lose 1 T-shirt at point A, he would need to obtain 2 movies in order to maintain his utility level and remain on the same indifference curve.
If John were to lose 1 T-shirt at point A, he would need to obtain 2 movies in order to maintain his utility level and remain on the same indifference curve.
What details about John's choices between A, B, C, and D does this provide?
Point C: Once more, John’s utility has improved and he is on a higher indifference curve at point C since he has more movies and T-shirts.
Point B - At point B, John has two more movies but one fewer T-shirt. This implies that he is still on the same indifference curve and thus his utility is unaffected.
Point D: At point D, John has 3 fewer movies but 1 more T-shirt. John's utility has reduced and he is on a lower indifference curve since he only thinks T-shirts are worth twice as much as movies.
"Perfect Substitutes - Diagram"
It's crucial to understand that there are an endless number of indifference curves. Both an IC for point D and an IC for point C can be graphed.
We can be sure that every point on IC2 is superior to every point on IC1, and every point on IC1 is preferable to every point on IC0 since every position on an indifference curve reflects equal utility.
"Perfect Substitutes - Diagram 2"
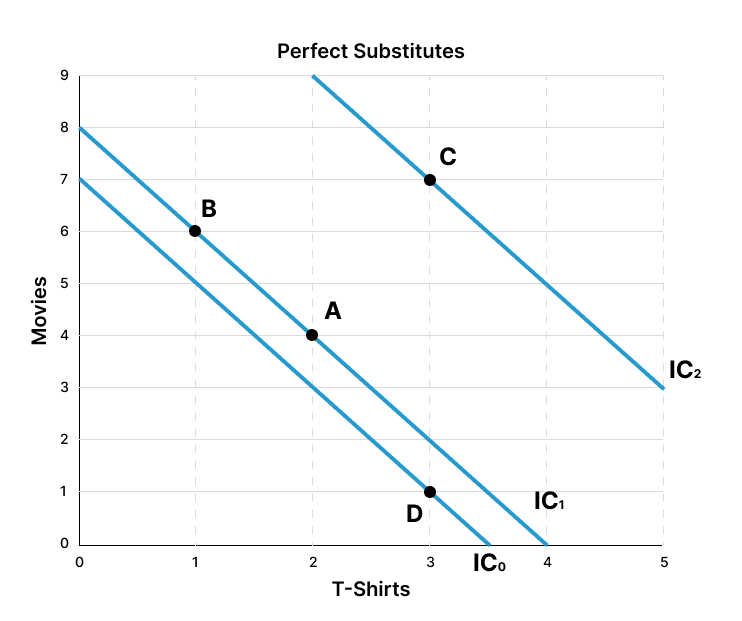 John will decide to consume on the steepest indifference curve he can afford in order to maximize his utility.
Conclusion -
As we previously stated, John wants to be as high on the indifference curve as he can be given his financial situation. We can determine exactly where John will consume by plotting our budget line and indifference curve on the same diagram and maximizing John's utility given his limits.
References:
Partial Content Ideas taken from the website mentioned below -
https://pressbooks.bccampus.ca/uvicecon103/chapter/6-3-how-changes-in-income-and-prices-affect-consumption-choices/


Category
Business Management
Homework
Writing & Compare Documents
Computer Science
Teaching and Learning
Technology
Personal Development
Research Topics
Geography
Recruitment
NVQ Level 3 Diploma in health & social care
Social
Digital Marketing
Assignment Writing
Economics
International
Speech Topics
Travel And Lifestyle
Health
Project Proposals
Writing
Case Study