logo

Foundation Skills in Data Analysis

Evaluate the presentation of information in an organization's annual report, focusing on the suitability of charts, tables, and graphs used to represent data.

18 Pages2335 Words52 Views
   

Added on  2023-01-12

About This Document

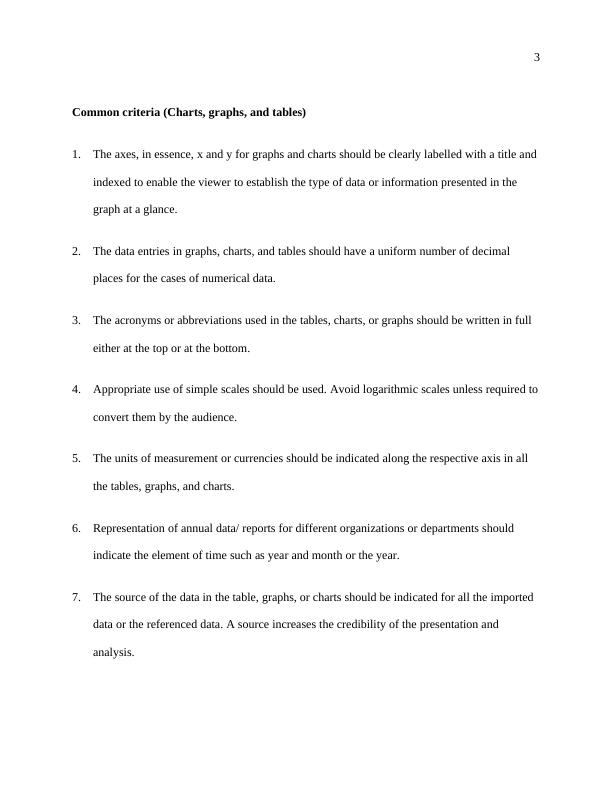
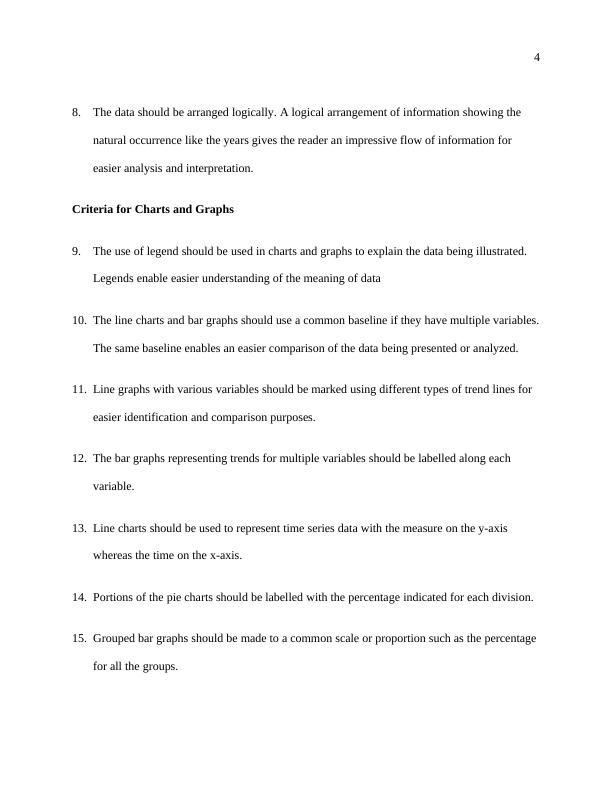
This document discusses the foundation skills in data analysis, focusing on the evaluation criteria for suitable charts, graphs, and tables. It explores the common criteria for data presentation and provides examples of evaluated charts, graphs, and tables in different reports. The document also includes references for further reading.

Foundation Skills in Data Analysis

Evaluate the presentation of information in an organization's annual report, focusing on the suitability of charts, tables, and graphs used to represent data.

   Added on 2023-01-12

ShareRelated Documents
1
Foundation skills in data analysis
Student’s Name
Course
Professor’s Name
Institution’s Name
Institution’s Location
Date
Foundation Skills in Data Analysis_1
2
Foundation skills in data analysis
The basic knowledge of analysing and presentation of statistical data is centred on the
ability to evaluate the suitability of the charts, tables, and graphs (Gregr et al., 2019, 428-443).
An appropriate presentation of data using these common means is the foundation for an easier
and faster understanding of the information by the consumers of different reports such as the
stakeholders, managers, or any relevant recipients of the reports. The report would evaluate the
criteria for suitable charts, graphs and tables and their application in different public reports.
Part A
Developing an evaluation criteria
Foundation Skills in Data Analysis_2
3
Common criteria (Charts, graphs, and tables)
1. The axes, in essence, x and y for graphs and charts should be clearly labelled with a title and
indexed to enable the viewer to establish the type of data or information presented in the
graph at a glance.
2. The data entries in graphs, charts, and tables should have a uniform number of decimal
places for the cases of numerical data.
3. The acronyms or abbreviations used in the tables, charts, or graphs should be written in full
either at the top or at the bottom.
4. Appropriate use of simple scales should be used. Avoid logarithmic scales unless required to
convert them by the audience.
5. The units of measurement or currencies should be indicated along the respective axis in all
the tables, graphs, and charts.
6. Representation of annual data/ reports for different organizations or departments should
indicate the element of time such as year and month or the year.
7. The source of the data in the table, graphs, or charts should be indicated for all the imported
data or the referenced data. A source increases the credibility of the presentation and
analysis.
Foundation Skills in Data Analysis_3
4
8. The data should be arranged logically. A logical arrangement of information showing the
natural occurrence like the years gives the reader an impressive flow of information for
easier analysis and interpretation.
Criteria for Charts and Graphs
9. The use of legend should be used in charts and graphs to explain the data being illustrated.
Legends enable easier understanding of the meaning of data
10. The line charts and bar graphs should use a common baseline if they have multiple variables.
The same baseline enables an easier comparison of the data being presented or analyzed.
11. Line graphs with various variables should be marked using different types of trend lines for
easier identification and comparison purposes.
12. The bar graphs representing trends for multiple variables should be labelled along each
variable.
13. Line charts should be used to represent time series data with the measure on the y-axis
whereas the time on the x-axis.
14. Portions of the pie charts should be labelled with the percentage indicated for each division.
15. Grouped bar graphs should be made to a common scale or proportion such as the percentage
for all the groups.
Foundation Skills in Data Analysis_4

End of preview

Want to access all the pages? Upload your documents or become a member.

Related Documents
Foundation Skills in Data Analysis
|16
|2604
|93

Data visualization Research 2022
|17
|2750
|24

MIS770A – Foundation Skills in Data Analysis
|18
|3089
|81

Applied Statistical Methods | Assignment
|7
|701
|14

Foundation Skills in Data Analysis
|18
|3015
|327

Foundation Skills in Data Analysis!
|16
|2667
|278