Regression Analysis and Statistical Techniques
VerifiedAdded on 2020/10/05
|11
|1458
|98
AI Summary
This assignment involves a regression analysis project that includes calculating large numbers of data using statistical techniques to find overall cumulative frequency and percentage of different classes. The project also focuses on various statistical calculations to determine the regression equation and price of different overall projects. The conclusion highlights the importance of statistical techniques in calculating large numbers of data and providing insights into regression analysis.
Contribute Materials
Your contribution can guide someone’s learning journey. Share your
documents today.
Statistics
Secure Best Marks with AI Grader
Need help grading? Try our AI Grader for instant feedback on your assignments.
Table of Contents
INTRODUCTION...........................................................................................................................1
TASK1.............................................................................................................................................1
Q1) Calculation of frequencies. .............................................................................................1
A)............................................................................................................................................1
TASK2.............................................................................................................................................2
Q2) .........................................................................................................................................2
A)Calculation of sample size..................................................................................................2
B) Determination of supply and unit price.............................................................................2
C) Coefficient of correlation and relation..............................................................................3
D) Relationship between supply and unit price......................................................................3
E) Total Supply prediction.....................................................................................................3
TASK3.............................................................................................................................................4
A) Calculation of ANOVA and presentation in tabular form................................................4
B) Advise to Allied using relevant significance ....................................................................4
TASK4.............................................................................................................................................4
A) Estimated regression equation...........................................................................................4
B) Determination of significant model...................................................................................5
C) Relationship between sales, price and advertising............................................................6
D) Re-estimate the model.......................................................................................................6
E) slope coefficient.................................................................................................................8
CONCLUSION................................................................................................................................8
REFERENCES................................................................................................................................9
INTRODUCTION
Statistical is concerned to the calculation and presentation of large numerical data in
tabular form. It is basically collection of data, summarizing information that help in
understanding, drawing conclusion form those data and estimating the present condition or
predicting the future.
In this project report different methods of statistic are begin implemented to develop
understanding about complexity of statistics. This includes calculation of cumulative and
relative frequency, and sums based on regression analysis and important calculation on price
determination is done in this report.
TASK1
Q1) Calculation of frequencies.
A)
Class interval Frequency CF
Relative
freq.
cumulative
relative freq.
% Freq.
Distribution
99-90 5 20 0.25 1 100
89-80 4 15 0.1 0.75 75
79-70 6 11 0.3 0.55 55
69-60 2 5 0.1 0.25 25
59-50 3 3 0.15 0.15 15
B)
1
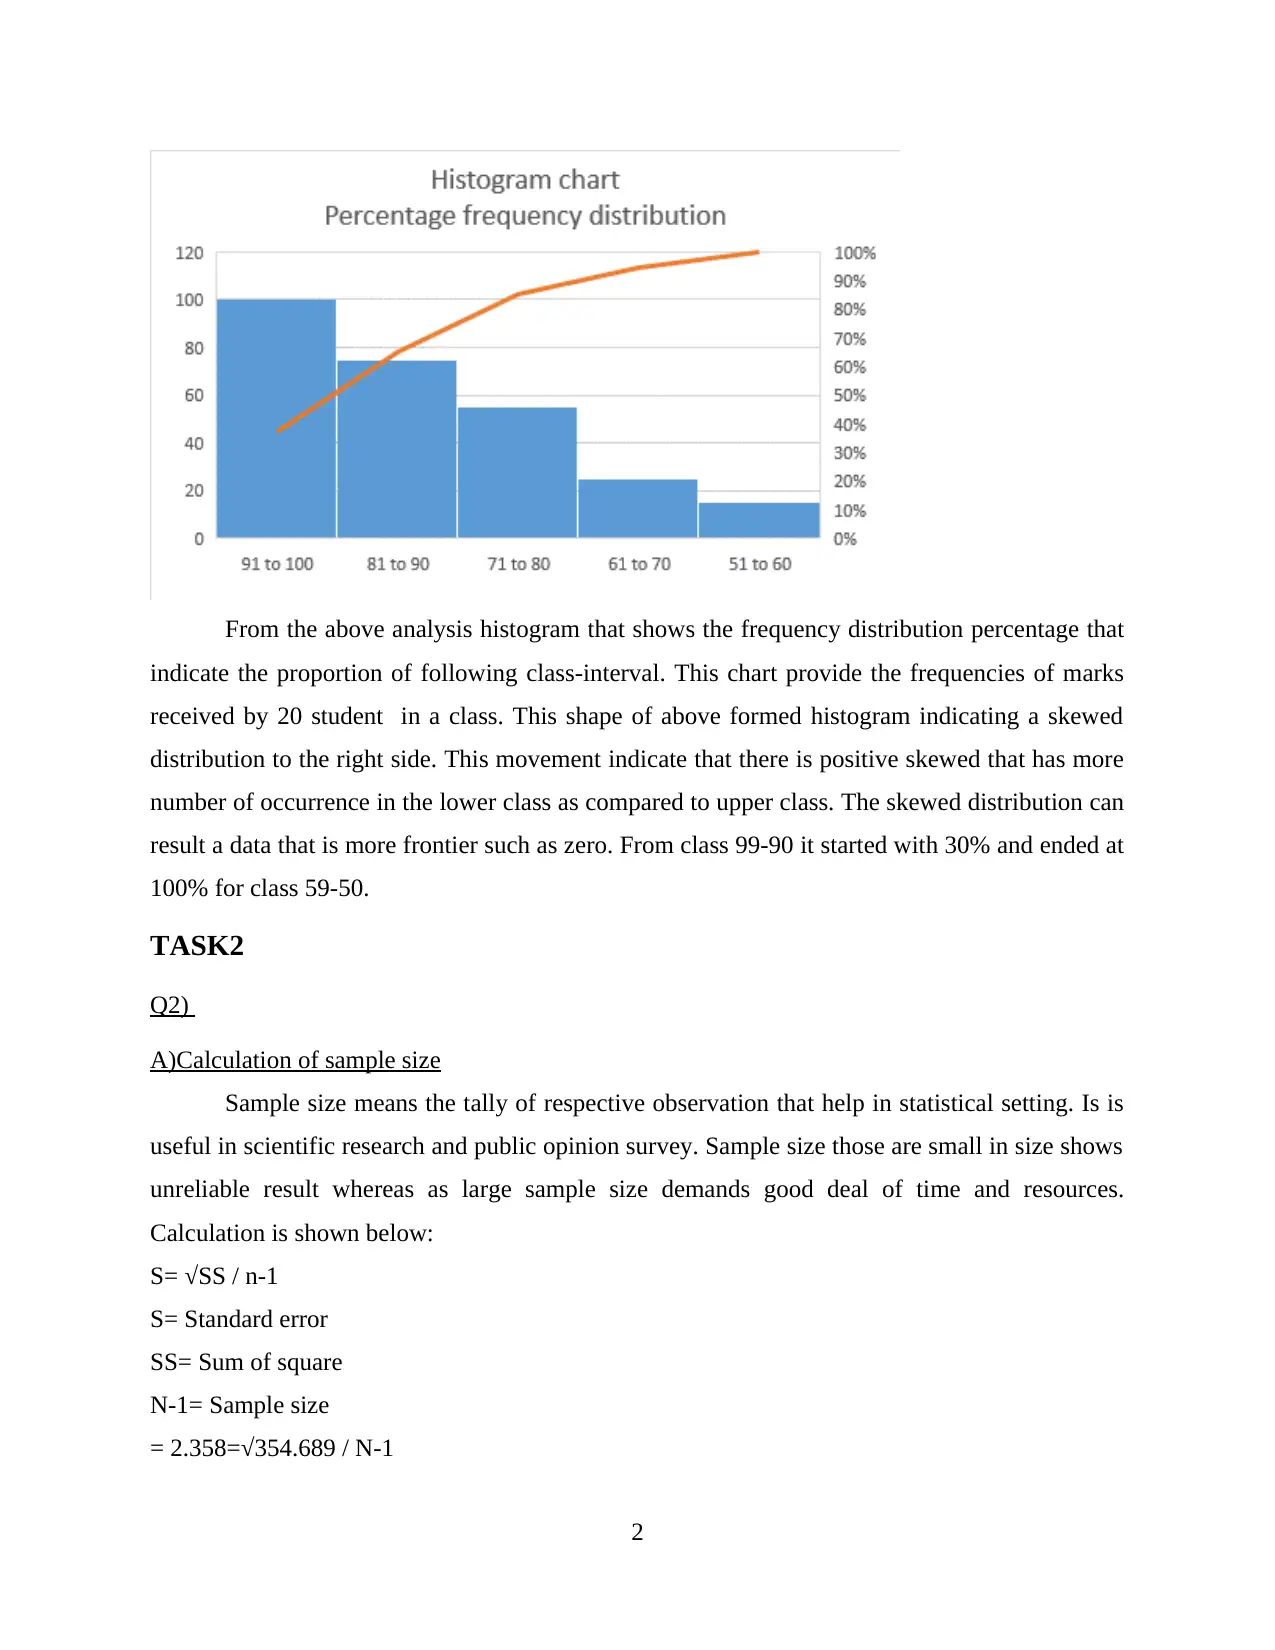
From the above analysis histogram that shows the frequency distribution percentage that
indicate the proportion of following class-interval. This chart provide the frequencies of marks
received by 20 student in a class. This shape of above formed histogram indicating a skewed
distribution to the right side. This movement indicate that there is positive skewed that has more
number of occurrence in the lower class as compared to upper class. The skewed distribution can
result a data that is more frontier such as zero. From class 99-90 it started with 30% and ended at
100% for class 59-50.
TASK2
Q2)
A)Calculation of sample size
Sample size means the tally of respective observation that help in statistical setting. Is is
useful in scientific research and public opinion survey. Sample size those are small in size shows
unreliable result whereas as large sample size demands good deal of time and resources.
Calculation is shown below:
S= √SS / n-1
S= Standard error
SS= Sum of square
N-1= Sample size
= 2.358=√354.689 / N-1
2
Secure Best Marks with AI Grader
Need help grading? Try our AI Grader for instant feedback on your assignments.
(2.358)2 = 354.689 / N-1
5.560.16(N-1) =354.689
5.560.16N=360.24916 N= 64.79 approx.
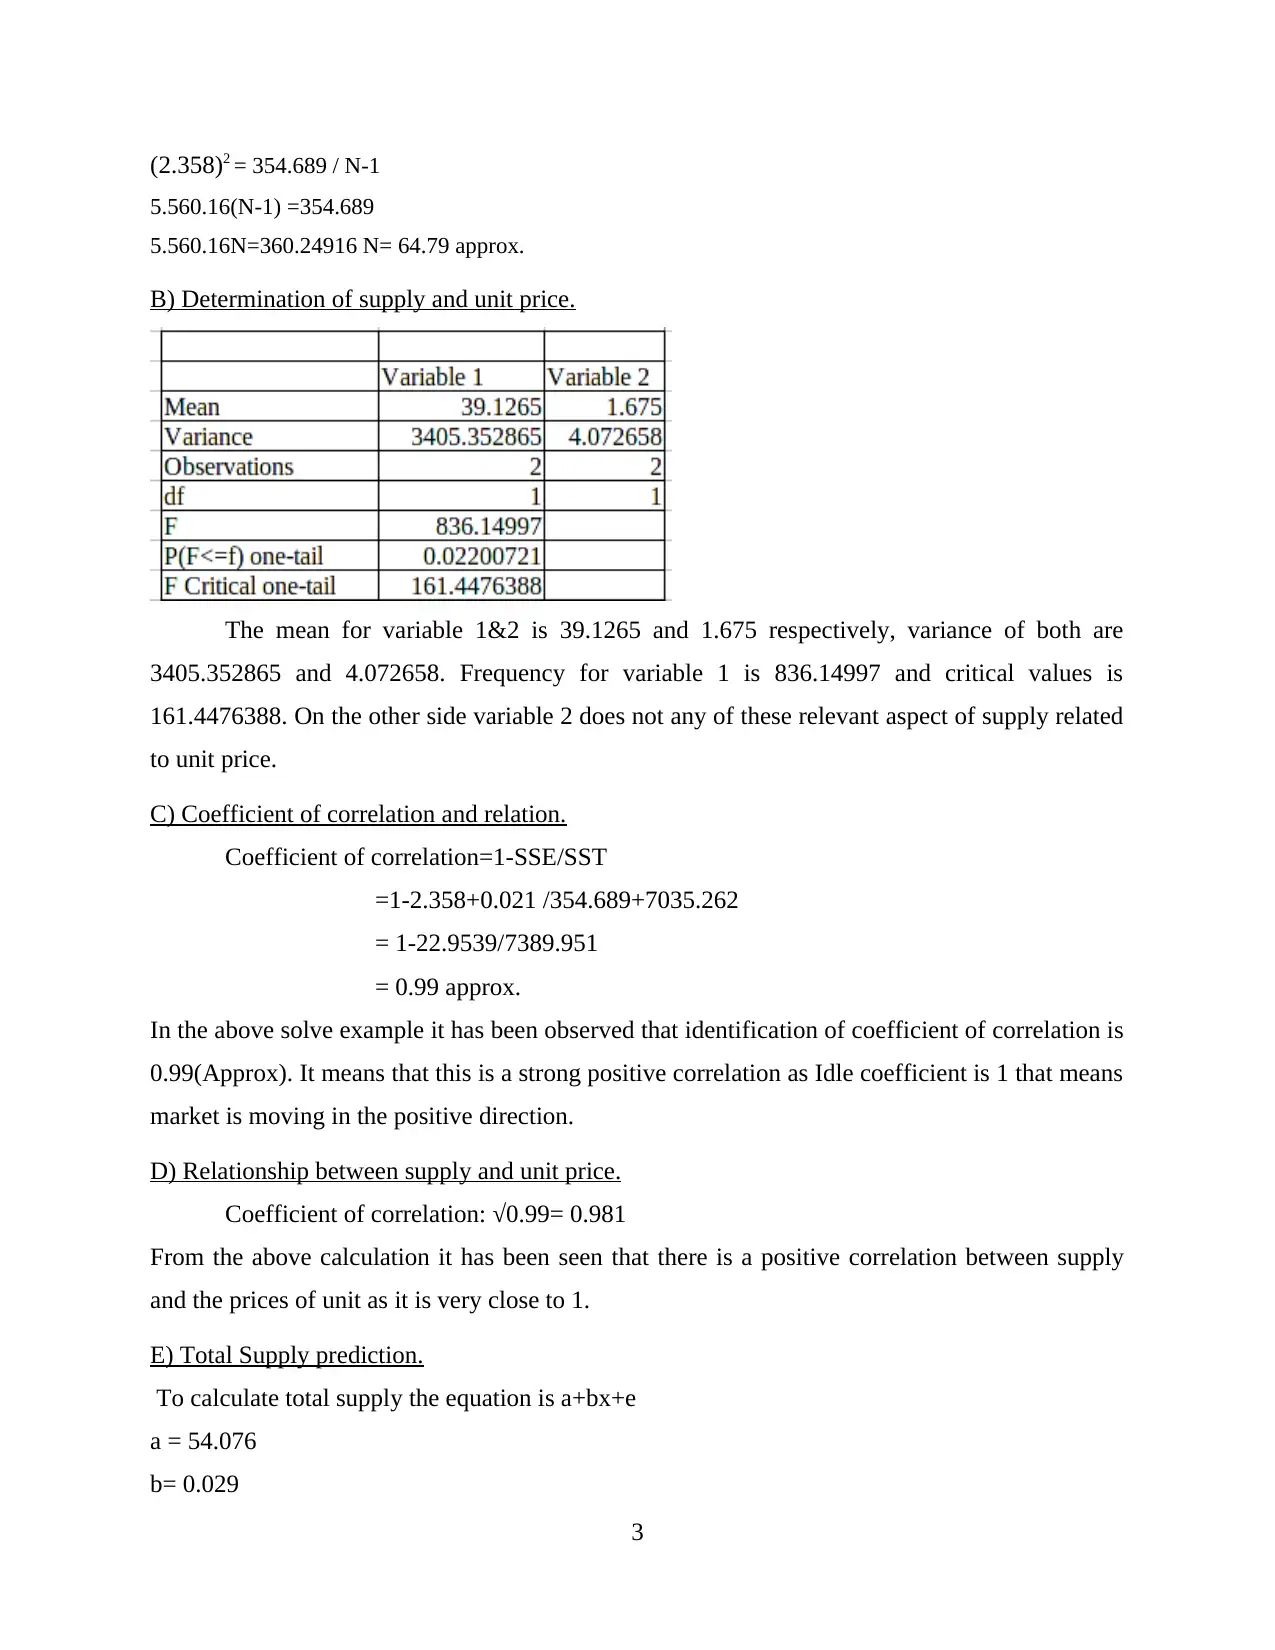
B) Determination of supply and unit price.
The mean for variable 1&2 is 39.1265 and 1.675 respectively, variance of both are
3405.352865 and 4.072658. Frequency for variable 1 is 836.14997 and critical values is
161.4476388. On the other side variable 2 does not any of these relevant aspect of supply related
to unit price.
C) Coefficient of correlation and relation.
Coefficient of correlation=1-SSE/SST
=1-2.358+0.021 /354.689+7035.262
= 1-22.9539/7389.951
= 0.99 approx.
In the above solve example it has been observed that identification of coefficient of correlation is
0.99(Approx). It means that this is a strong positive correlation as Idle coefficient is 1 that means
market is moving in the positive direction.
D) Relationship between supply and unit price.
Coefficient of correlation: √0.99= 0.981
From the above calculation it has been seen that there is a positive correlation between supply
and the prices of unit as it is very close to 1.
E) Total Supply prediction.
To calculate total supply the equation is a+bx+e
a = 54.076
b= 0.029
3
5.560.16(N-1) =354.689
5.560.16N=360.24916 N= 64.79 approx.
B) Determination of supply and unit price.
The mean for variable 1&2 is 39.1265 and 1.675 respectively, variance of both are
3405.352865 and 4.072658. Frequency for variable 1 is 836.14997 and critical values is
161.4476388. On the other side variable 2 does not any of these relevant aspect of supply related
to unit price.
C) Coefficient of correlation and relation.
Coefficient of correlation=1-SSE/SST
=1-2.358+0.021 /354.689+7035.262
= 1-22.9539/7389.951
= 0.99 approx.
In the above solve example it has been observed that identification of coefficient of correlation is
0.99(Approx). It means that this is a strong positive correlation as Idle coefficient is 1 that means
market is moving in the positive direction.
D) Relationship between supply and unit price.
Coefficient of correlation: √0.99= 0.981
From the above calculation it has been seen that there is a positive correlation between supply
and the prices of unit as it is very close to 1.
E) Total Supply prediction.
To calculate total supply the equation is a+bx+e
a = 54.076
b= 0.029
3
e = expected unit price = 50000 54.076+0.029*X+50000
X = 54.076+50000/0.029 and Supply = 1724192 unit
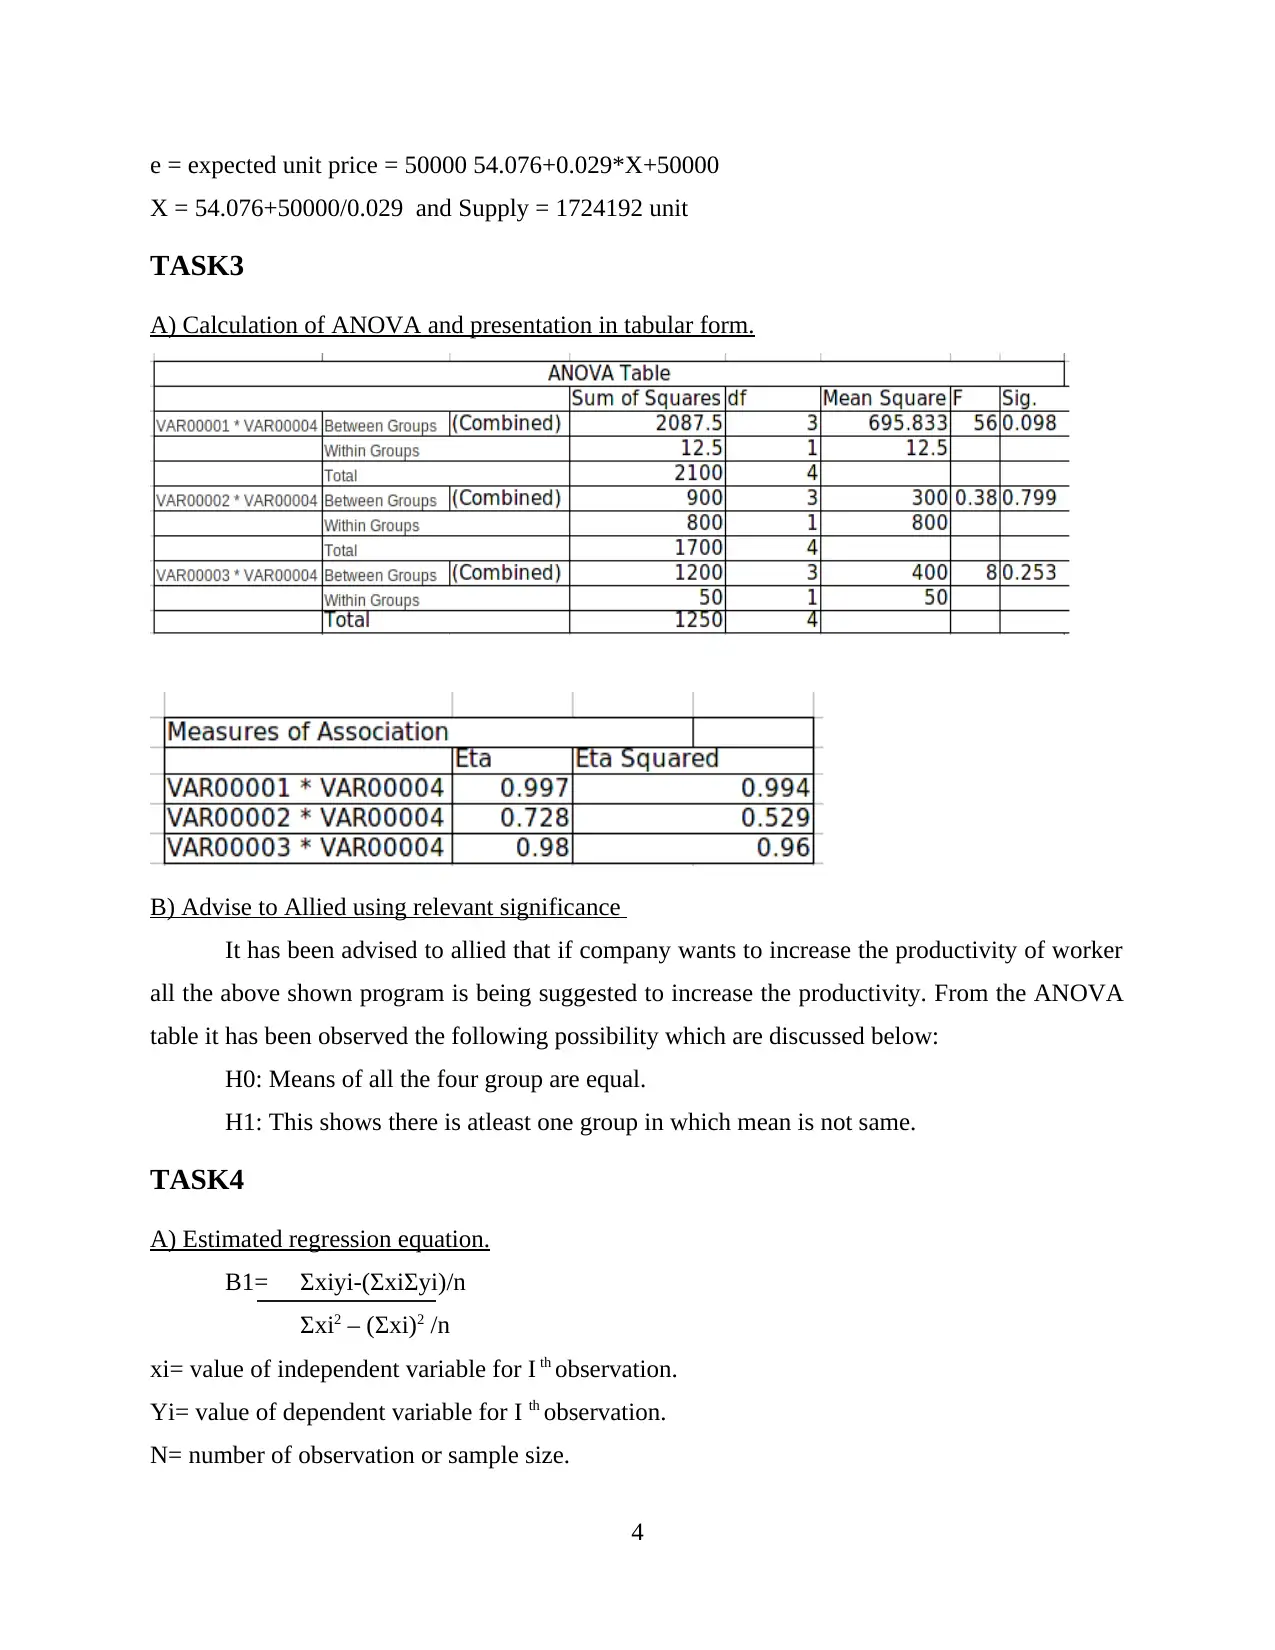
TASK3
A) Calculation of ANOVA and presentation in tabular form.
B) Advise to Allied using relevant significance
It has been advised to allied that if company wants to increase the productivity of worker
all the above shown program is being suggested to increase the productivity. From the ANOVA
table it has been observed the following possibility which are discussed below:
H0: Means of all the four group are equal.
H1: This shows there is atleast one group in which mean is not same.
TASK4
A) Estimated regression equation.
B1= Σxiyi-(ΣxiΣyi)/n
Σxi2 – (Σxi)2 /n
xi= value of independent variable for I th observation.
Yi= value of dependent variable for I th observation.
N= number of observation or sample size.
4
X = 54.076+50000/0.029 and Supply = 1724192 unit
TASK3
A) Calculation of ANOVA and presentation in tabular form.
B) Advise to Allied using relevant significance
It has been advised to allied that if company wants to increase the productivity of worker
all the above shown program is being suggested to increase the productivity. From the ANOVA
table it has been observed the following possibility which are discussed below:
H0: Means of all the four group are equal.
H1: This shows there is atleast one group in which mean is not same.
TASK4
A) Estimated regression equation.
B1= Σxiyi-(ΣxiΣyi)/n
Σxi2 – (Σxi)2 /n
xi= value of independent variable for I th observation.
Yi= value of dependent variable for I th observation.
N= number of observation or sample size.
4
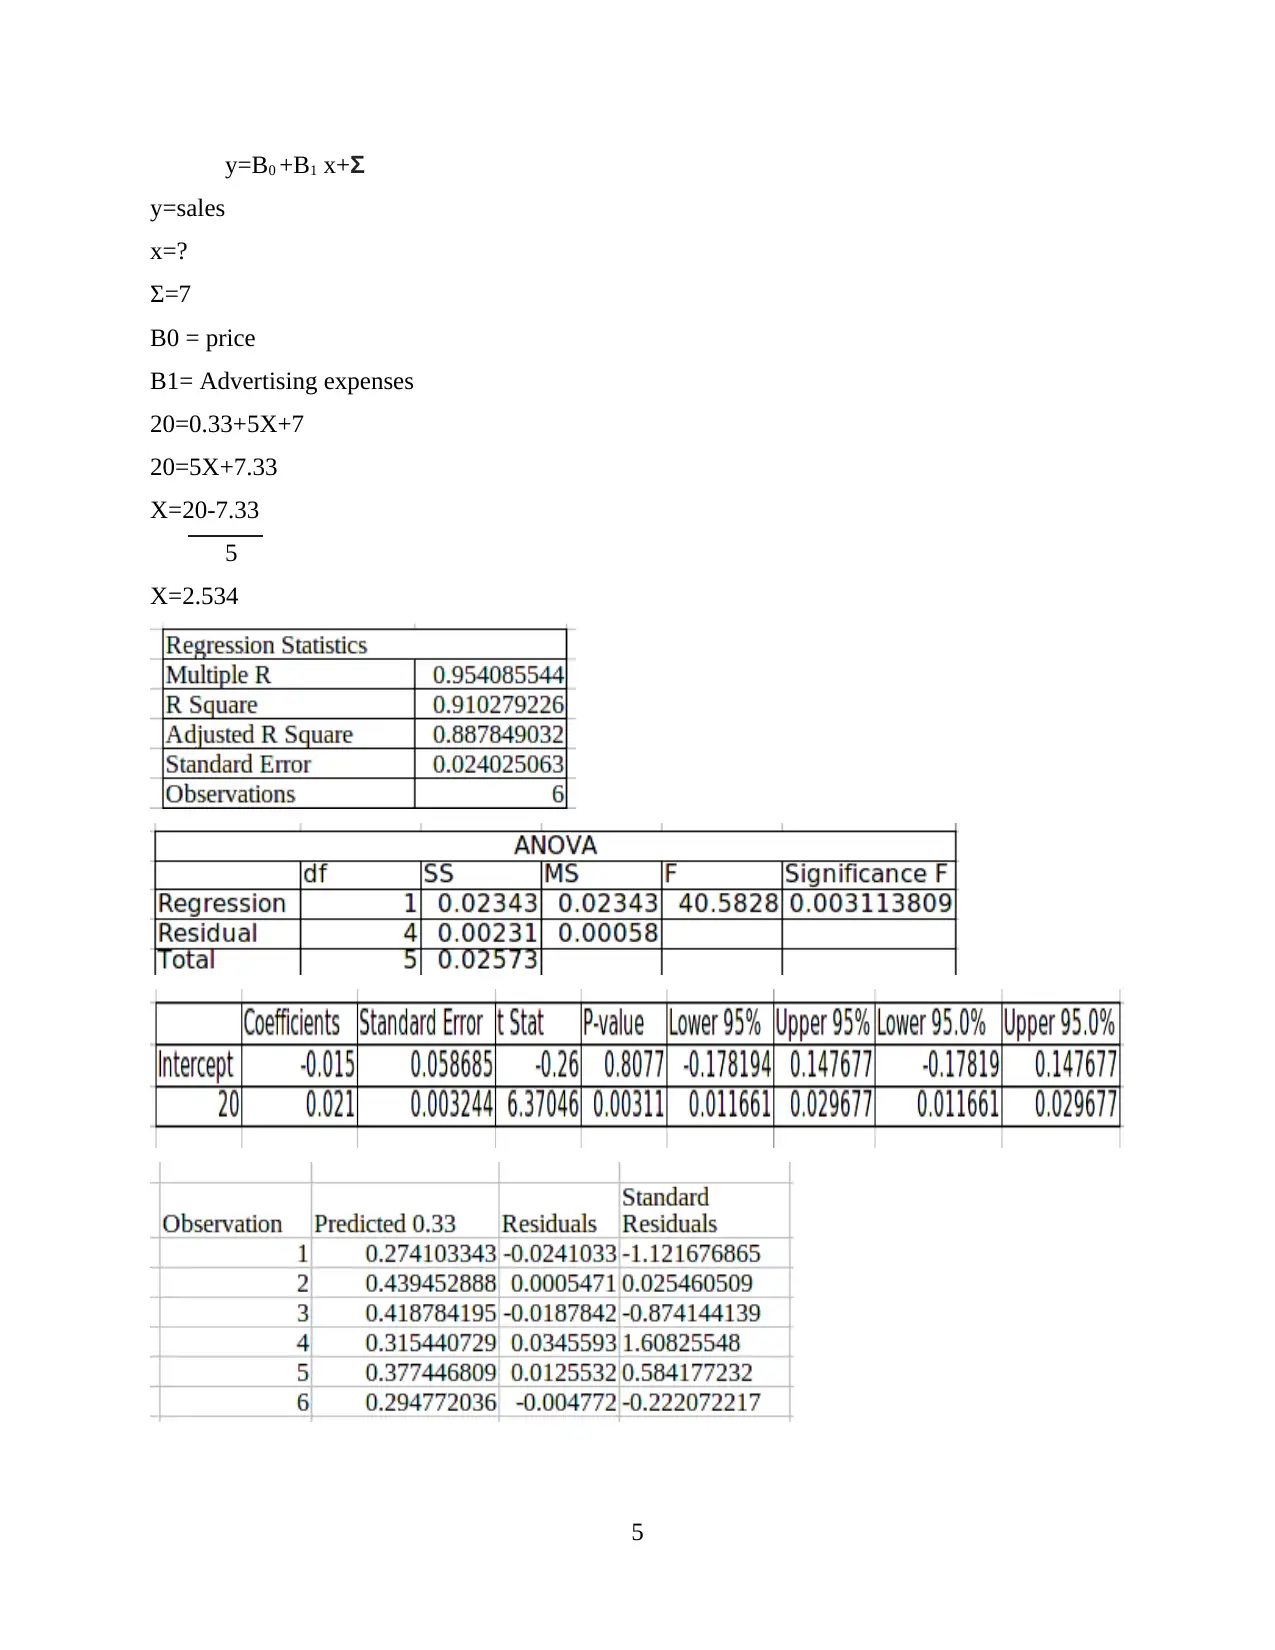
y=B0 +B1 x+Σ
y=sales
x=?
Σ=7
B0 = price
B1= Advertising expenses
20=0.33+5X+7
20=5X+7.33
X=20-7.33
5
X=2.534
5
y=sales
x=?
Σ=7
B0 = price
B1= Advertising expenses
20=0.33+5X+7
20=5X+7.33
X=20-7.33
5
X=2.534
5
Paraphrase This Document
Need a fresh take? Get an instant paraphrase of this document with our AI Paraphraser
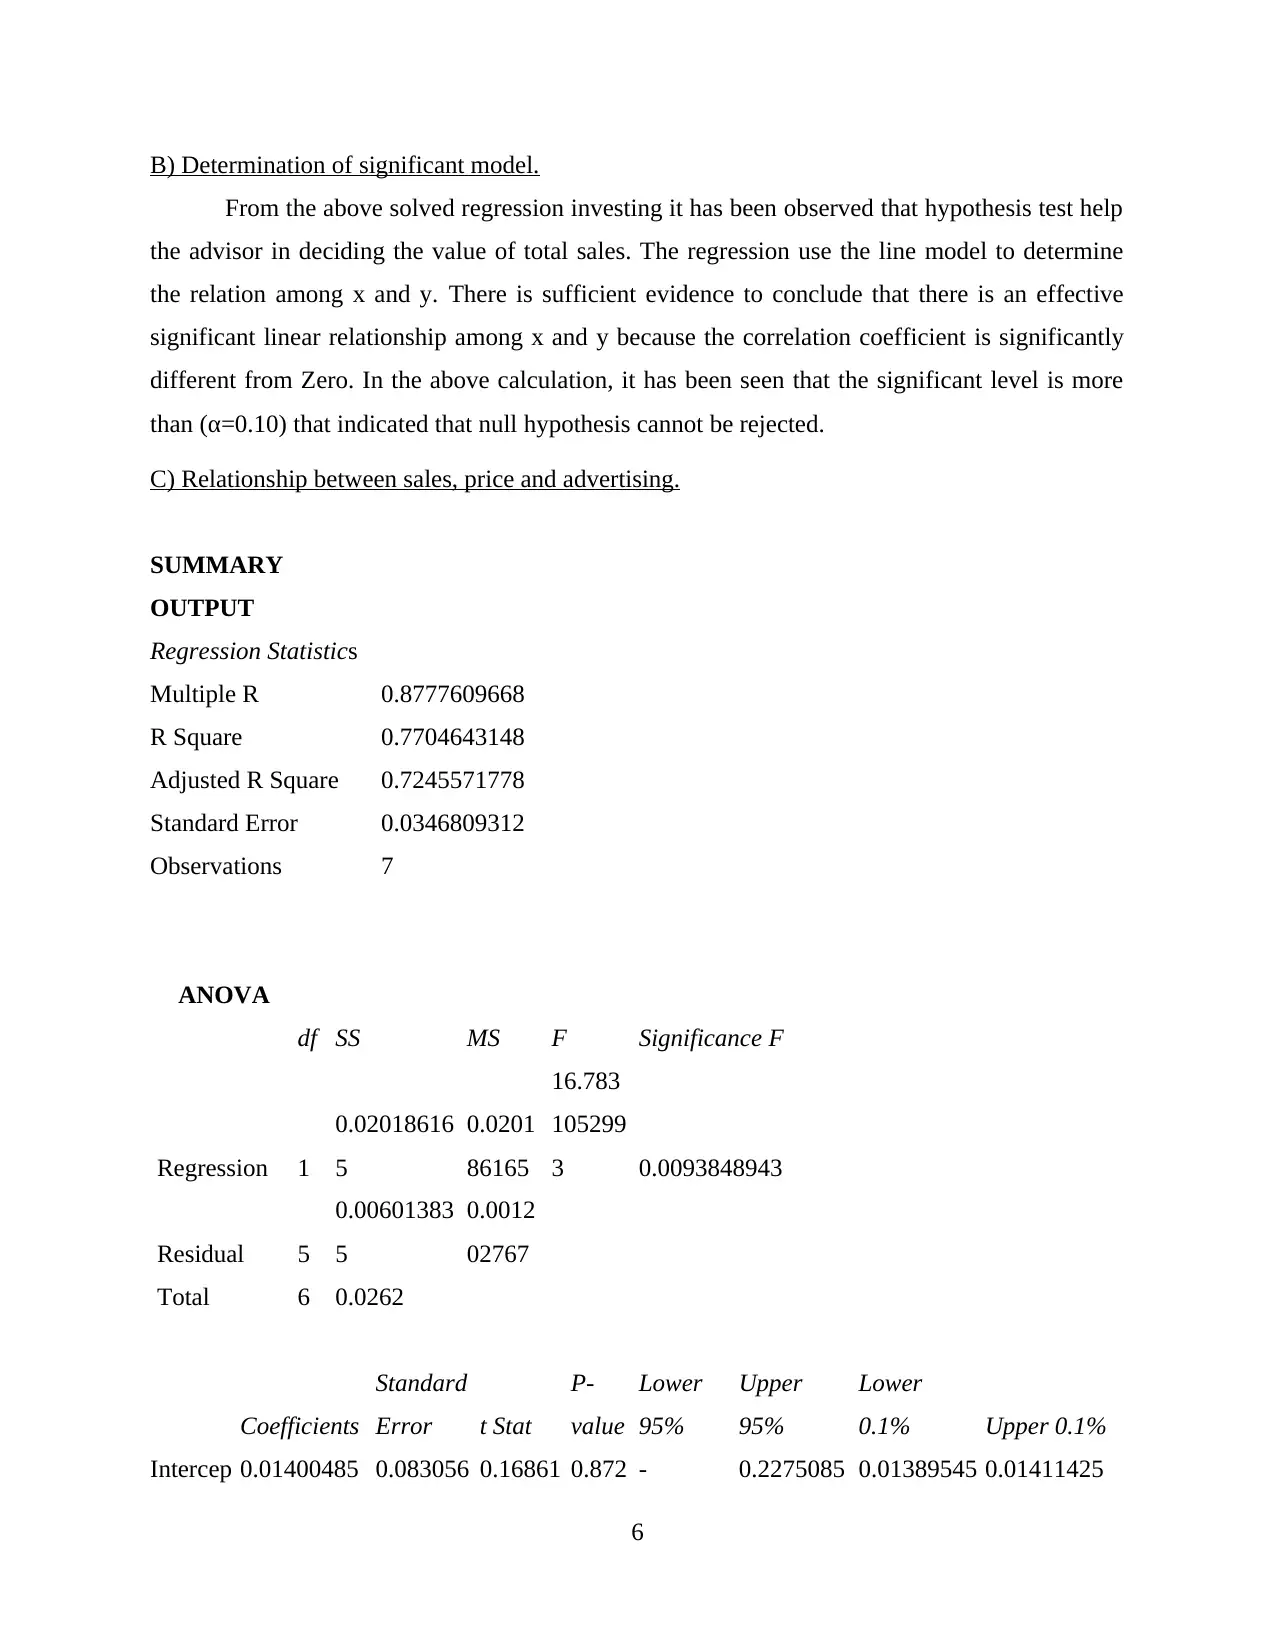
B) Determination of significant model.
From the above solved regression investing it has been observed that hypothesis test help
the advisor in deciding the value of total sales. The regression use the line model to determine
the relation among x and y. There is sufficient evidence to conclude that there is an effective
significant linear relationship among x and y because the correlation coefficient is significantly
different from Zero. In the above calculation, it has been seen that the significant level is more
than (α=0.10) that indicated that null hypothesis cannot be rejected.
C) Relationship between sales, price and advertising.
SUMMARY
OUTPUT
Regression Statistics
Multiple R 0.8777609668
R Square 0.7704643148
Adjusted R Square 0.7245571778
Standard Error 0.0346809312
Observations 7
ANOVA
df SS MS F Significance F
Regression 1
0.02018616
5
0.0201
86165
16.783
105299
3 0.0093848943
Residual 5
0.00601383
5
0.0012
02767
Total 6 0.0262
Coefficients
Standard
Error t Stat
P-
value
Lower
95%
Upper
95%
Lower
0.1% Upper 0.1%
Intercep 0.01400485 0.083056 0.16861 0.872 - 0.2275085 0.01389545 0.01411425
6
t 44 5721 82564
7057
899
0.199498
8612 7 61 26
X
Variabl
e 1
0.01851941
75
0.004520
5488
4.09671
88455
0.009
3848
943
0.006898
9768
0.0301398
581
0.01851346
32
0.01852537
17
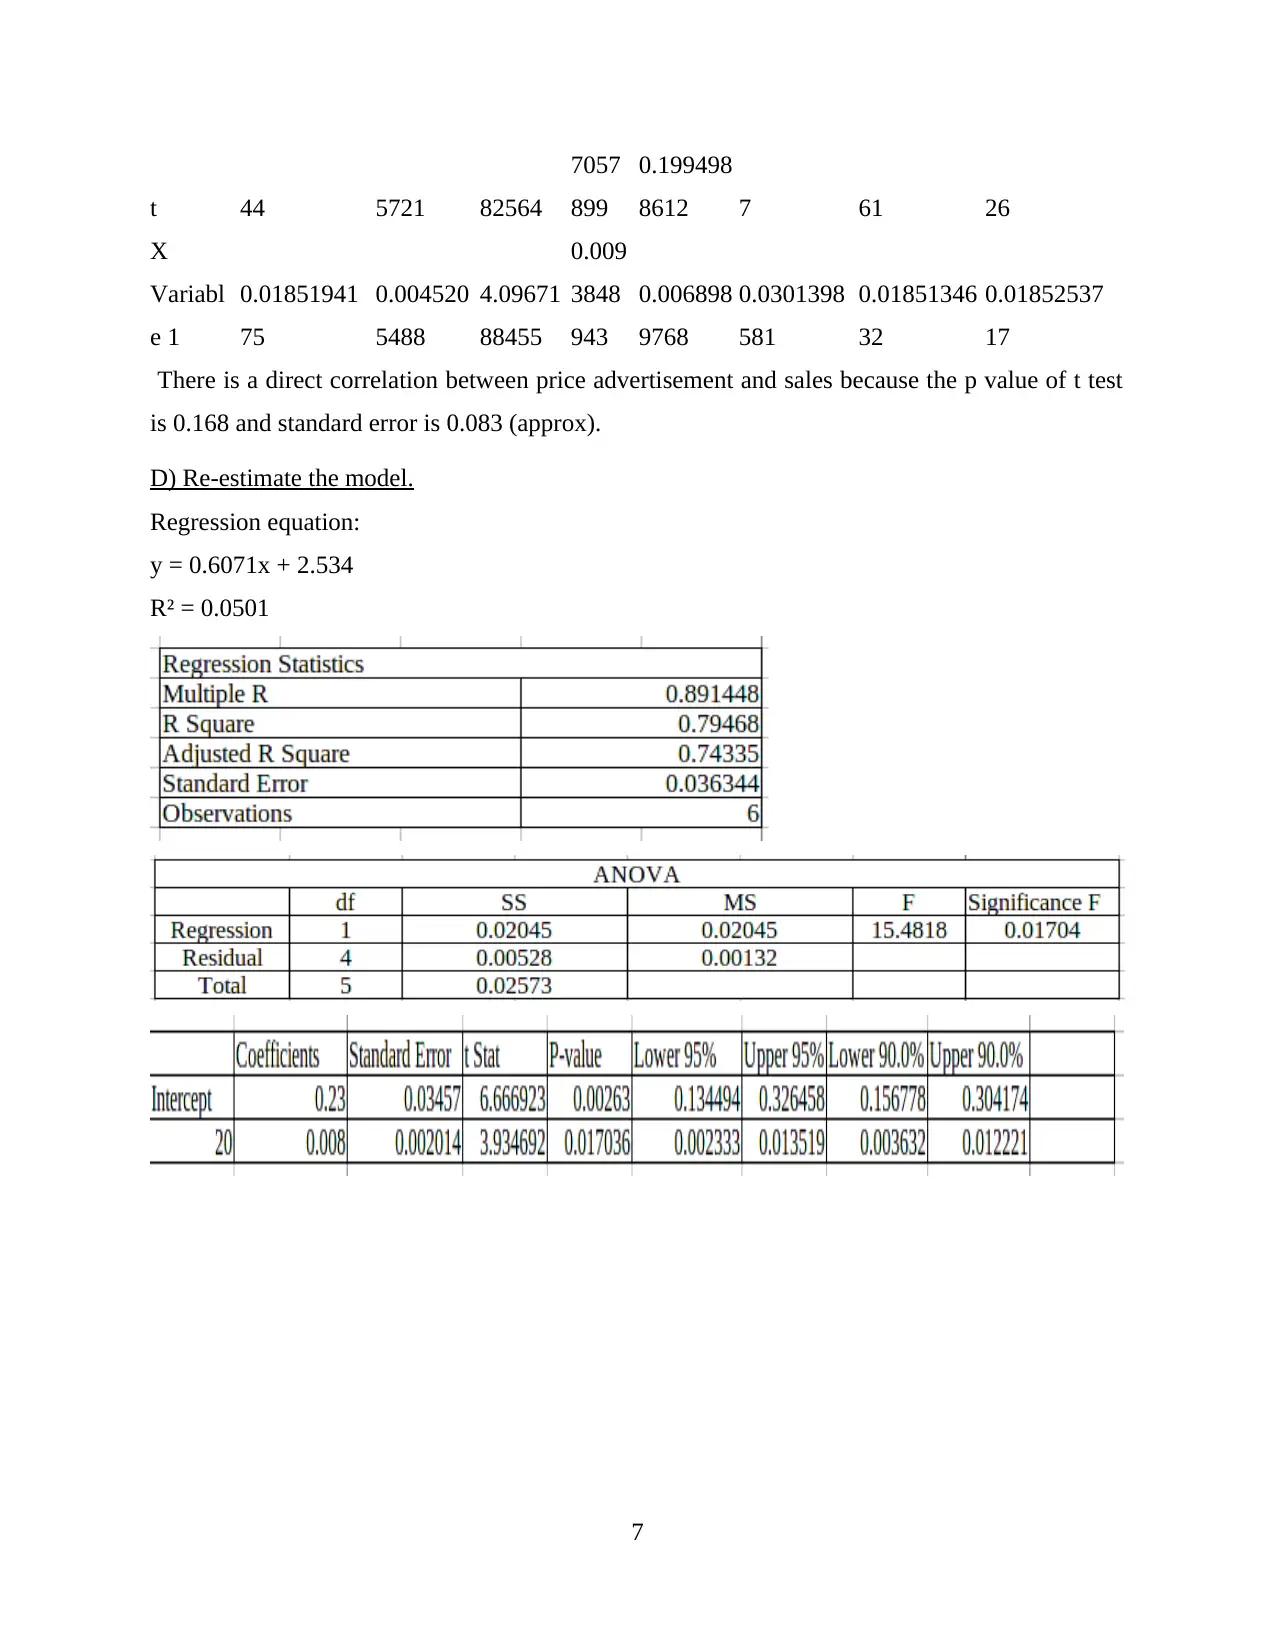
There is a direct correlation between price advertisement and sales because the p value of t test
is 0.168 and standard error is 0.083 (approx).
D) Re-estimate the model.
Regression equation:
y = 0.6071x + 2.534
R² = 0.0501
7
7057
899
0.199498
8612 7 61 26
X
Variabl
e 1
0.01851941
75
0.004520
5488
4.09671
88455
0.009
3848
943
0.006898
9768
0.0301398
581
0.01851346
32
0.01852537
17
There is a direct correlation between price advertisement and sales because the p value of t test
is 0.168 and standard error is 0.083 (approx).
D) Re-estimate the model.
Regression equation:
y = 0.6071x + 2.534
R² = 0.0501
7

E) slope coefficient
From the above analysis it is observed that the coefficient of regression are useful for any
researcher that can easily be able to calculate the amount of variation in y that would be expected
to results from a units increase in x. This particular chances occur because y is dependent on x
variable.
CONCLUSION
In the above project, it is concluded that to calculate large number of data statistical
techniques are useful. Project focus on various statistical calculation to find out overall
cumulative frequency and percentage of different class. These calculation help in figuring out
regression analysis and price of different overall project.
8
Secure Best Marks with AI Grader
Need help grading? Try our AI Grader for instant feedback on your assignments.
REFERENCES
Books and Journals:
Altman, D., Machin, D., Bryant, T. and Gardner, M. eds., 2013. Statistics with confidence:
confidence intervals and statistical guidelines. John Wiley & Sons.
Chatfield, C., 2018. Statistics for technology: a course in applied statistics. Routledge.
Cumming, G., 2013. Understanding the new statistics: Effect sizes, confidence intervals, and
meta-analysis. Routledge.
Natrella, M. G., 2013. Experimental statistics. Courier Corporation.
Rohatgi, V. K. and Saleh, A. M. E., 2015. An introduction to probability and statistics. John
Wiley & Sons.
9
1 out of 11
Related Documents


Your All-in-One AI-Powered Toolkit for Academic Success.
+13062052269
info@desklib.com
Available 24*7 on WhatsApp / Email
![[object Object]](/_next/static/media/star-bottom.7253800d.svg)
Unlock your academic potential
© 2024 | Zucol Services PVT LTD | All rights reserved.