Can the Earth feed 9 billion people? Predicting population growth and its impact on food availability
VerifiedAdded on 2022/08/13
|26
|6110
|16
AI Summary
In this study, I have decided to use two formulas for predicting world population growth: one based on an exponential growth model (Hathout, 2013) and the other on a logistic growth model (Hillen, 2016). In this study, I have decided to use two formulas for predicting world population growth: one based on an exponential growth model (Hathout, 2013) and the other on a logistic growth model (Hillen, 2016). I will compare my projections with the UN (2015) forecast that world population is
Contribute Materials
Your contribution can guide someone’s learning journey. Share your
documents today.
1
Can the Earth feed 9 billion people? Predicting population growth and its impact
on food availability?
Name:
Institution:
Course number and name:
Instructor’s name:
3rd March 2020
Can the Earth feed 9 billion people? Predicting population growth and its impact
on food availability?
Name:
Institution:
Course number and name:
Instructor’s name:
3rd March 2020
Secure Best Marks with AI Grader
Need help grading? Try our AI Grader for instant feedback on your assignments.
2
Can the Earth feed 9 billion people? Predicting population growth and its impact
on food availability
1. Introduction
Usually, we have seen images in the media, especially children, suffering from
hunger and poverty. More than one billion of today’s seven billion people suffer from
hunger (UNICEF, 2015). Will it be enough food to feed the increasing global
population in the future? Feeding the world will be a huge challenge for humanity.
The issues of hunger and poverty are dealt in the framework of Sustainable
Development Goals and more specifically in SDG1 and SDG2. In this context,
concepts such as exponential growth, human carrying capacity and food availability
are extremely relevant in this context. Exponential growth "only occurs when a
species lives under optimal conditions, with enough food, water and space... and
above a certain population size, the growth rate slows down gradually" (Rutherford,
2009, p. 160-161). Population sizes are usually close to the carrying capacity, defined
as the maximum of human population that, the Earth can sustainably carry or support
(ibid.). This is a complex issue for a number of reasons. Among these reasons are that
humans use much more natural resources than any other animal. Also, the use of
resources varies according to differences in economic situation, culture and lifestyles.
Consequently, the question, how many people can the Earth support, cannot be easily
answered numerically. This means, that any estimates of human carrying capacity
depend on the choices we are going to make in the future as well as natural events.
We have also to keep in mind that population is increasing at a higher rate than
agricultural production (FAO, 2007) as well as that a lot of food is wasted. Reaching a
balance between the agricultural production and the rate of population growth can
limit the risks associated with a lack of food.
3
In this study, I have decided to use two formulas for predicting world
population growth: one based on an exponential growth model (Hathout, 2013) and
the other on a logistic growth model (Hillen, 2016). I will compare my projections
with the UN (2015) forecast that world population is going to grow from 7.3 billion to
more than 9.6 billion by 2050. Next, my objective is to explore if the Earth can feed
the population growth projected through these two models, using data related to food
availability. Upon finding out the rate of the population growth and the food
production levels, I will delve more in to the question whether the earth can feed a
large population. In the discussion, I will also provide suggestions and solutions to
take care of the looming food crisis due to overpopulation.
2. Predicting World Population Growth
Global population has grown exponentially. However, most of this growth will
take place in developing countries as well as in urban areas (FAO, 2016). By 2050,
66% of the world‘s population is expected to live in urban areas, especially in Africa
and Asia (UN, 2014). To my mind, predicting population growth and being able to
answer the impacts of population growth on global hunger seems to be a very
important issue to explore. There are now more than 7 billion of people on Earth and
as world population continues to grow, the need for far more water, food, land,
transport and energy will also continue to increase (Crist, Mora, & Engelman, 2017).
As a result, we are accelerating the rate at which we're using our natural resources. It
is, thus, important to understand how all this is connected. Upon attaining the
necessary understanding of how things work we will be able to find solutions to the
problem of the depletion of the available natural resources.
2.1. Applying an Exponential Growth Model
Based on the growth model of population
P=Po∙ert
4
Where,
P=final population
Po=initial population
r=rate of growth
t=time (years)
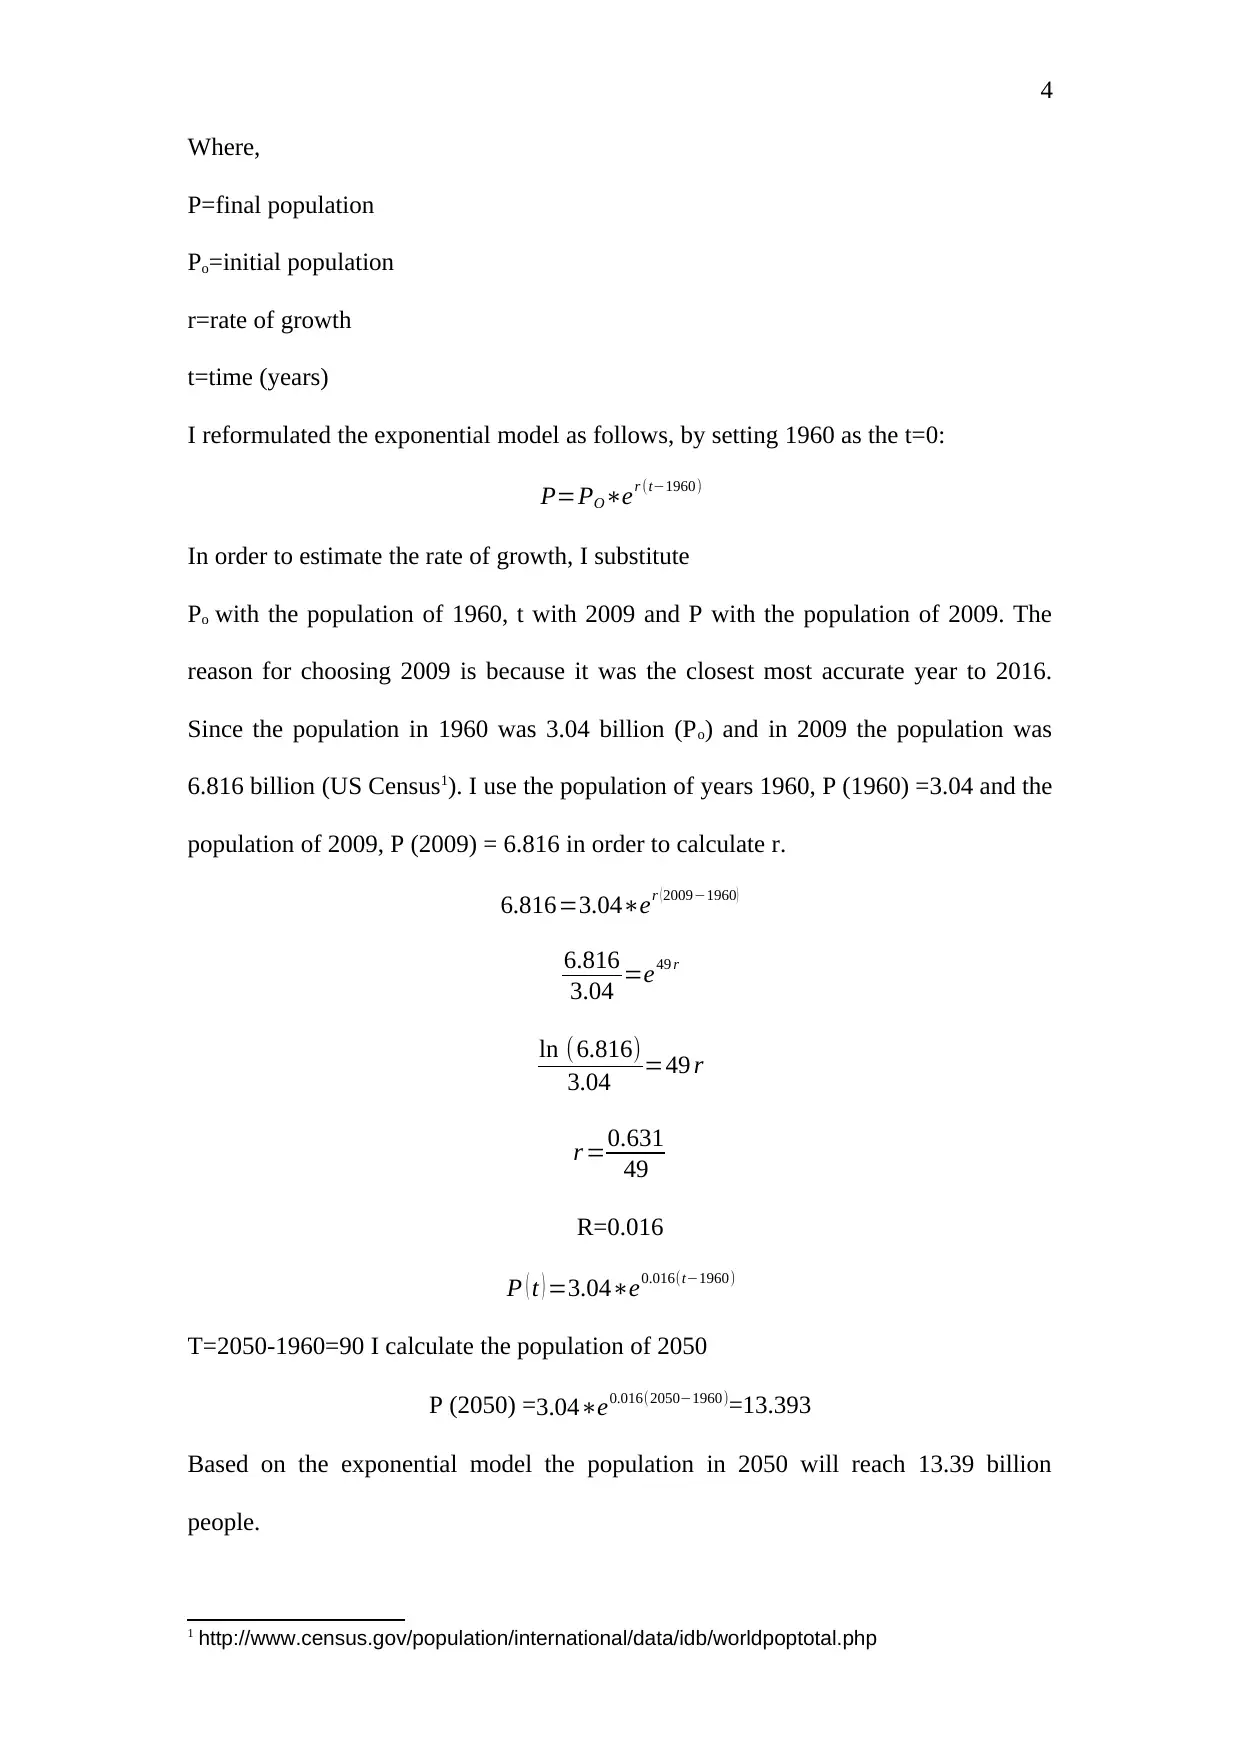
I reformulated the exponential model as follows, by setting 1960 as the t=0:
P=PO∗er (t−1960)
In order to estimate the rate of growth, I substitute
Po with the population of 1960, t with 2009 and P with the population of 2009. The
reason for choosing 2009 is because it was the closest most accurate year to 2016.
Since the population in 1960 was 3.04 billion (Po) and in 2009 the population was
6.816 billion (US Census1). I use the population of years 1960, P (1960) =3.04 and the
population of 2009, P (2009) = 6.816 in order to calculate r.
6.816=3.04∗er ( 2009−1960)
6.816
3.04 =e49 r
ln (6.816)
3.04 =49 r
r =0.631
49
R=0.016
P ( t ) =3.04∗e0.016(t−1960)
T=2050-1960=90 I calculate the population of 2050
P (2050) =3.04∗e0.016(2050−1960)=13.393
Based on the exponential model the population in 2050 will reach 13.39 billion
people.
1 http://www.census.gov/population/international/data/idb/worldpoptotal.php
Where,
P=final population
Po=initial population
r=rate of growth
t=time (years)
I reformulated the exponential model as follows, by setting 1960 as the t=0:
P=PO∗er (t−1960)
In order to estimate the rate of growth, I substitute
Po with the population of 1960, t with 2009 and P with the population of 2009. The
reason for choosing 2009 is because it was the closest most accurate year to 2016.
Since the population in 1960 was 3.04 billion (Po) and in 2009 the population was
6.816 billion (US Census1). I use the population of years 1960, P (1960) =3.04 and the
population of 2009, P (2009) = 6.816 in order to calculate r.
6.816=3.04∗er ( 2009−1960)
6.816
3.04 =e49 r
ln (6.816)
3.04 =49 r
r =0.631
49
R=0.016
P ( t ) =3.04∗e0.016(t−1960)
T=2050-1960=90 I calculate the population of 2050
P (2050) =3.04∗e0.016(2050−1960)=13.393
Based on the exponential model the population in 2050 will reach 13.39 billion
people.
1 http://www.census.gov/population/international/data/idb/worldpoptotal.php
Secure Best Marks with AI Grader
Need help grading? Try our AI Grader for instant feedback on your assignments.
5
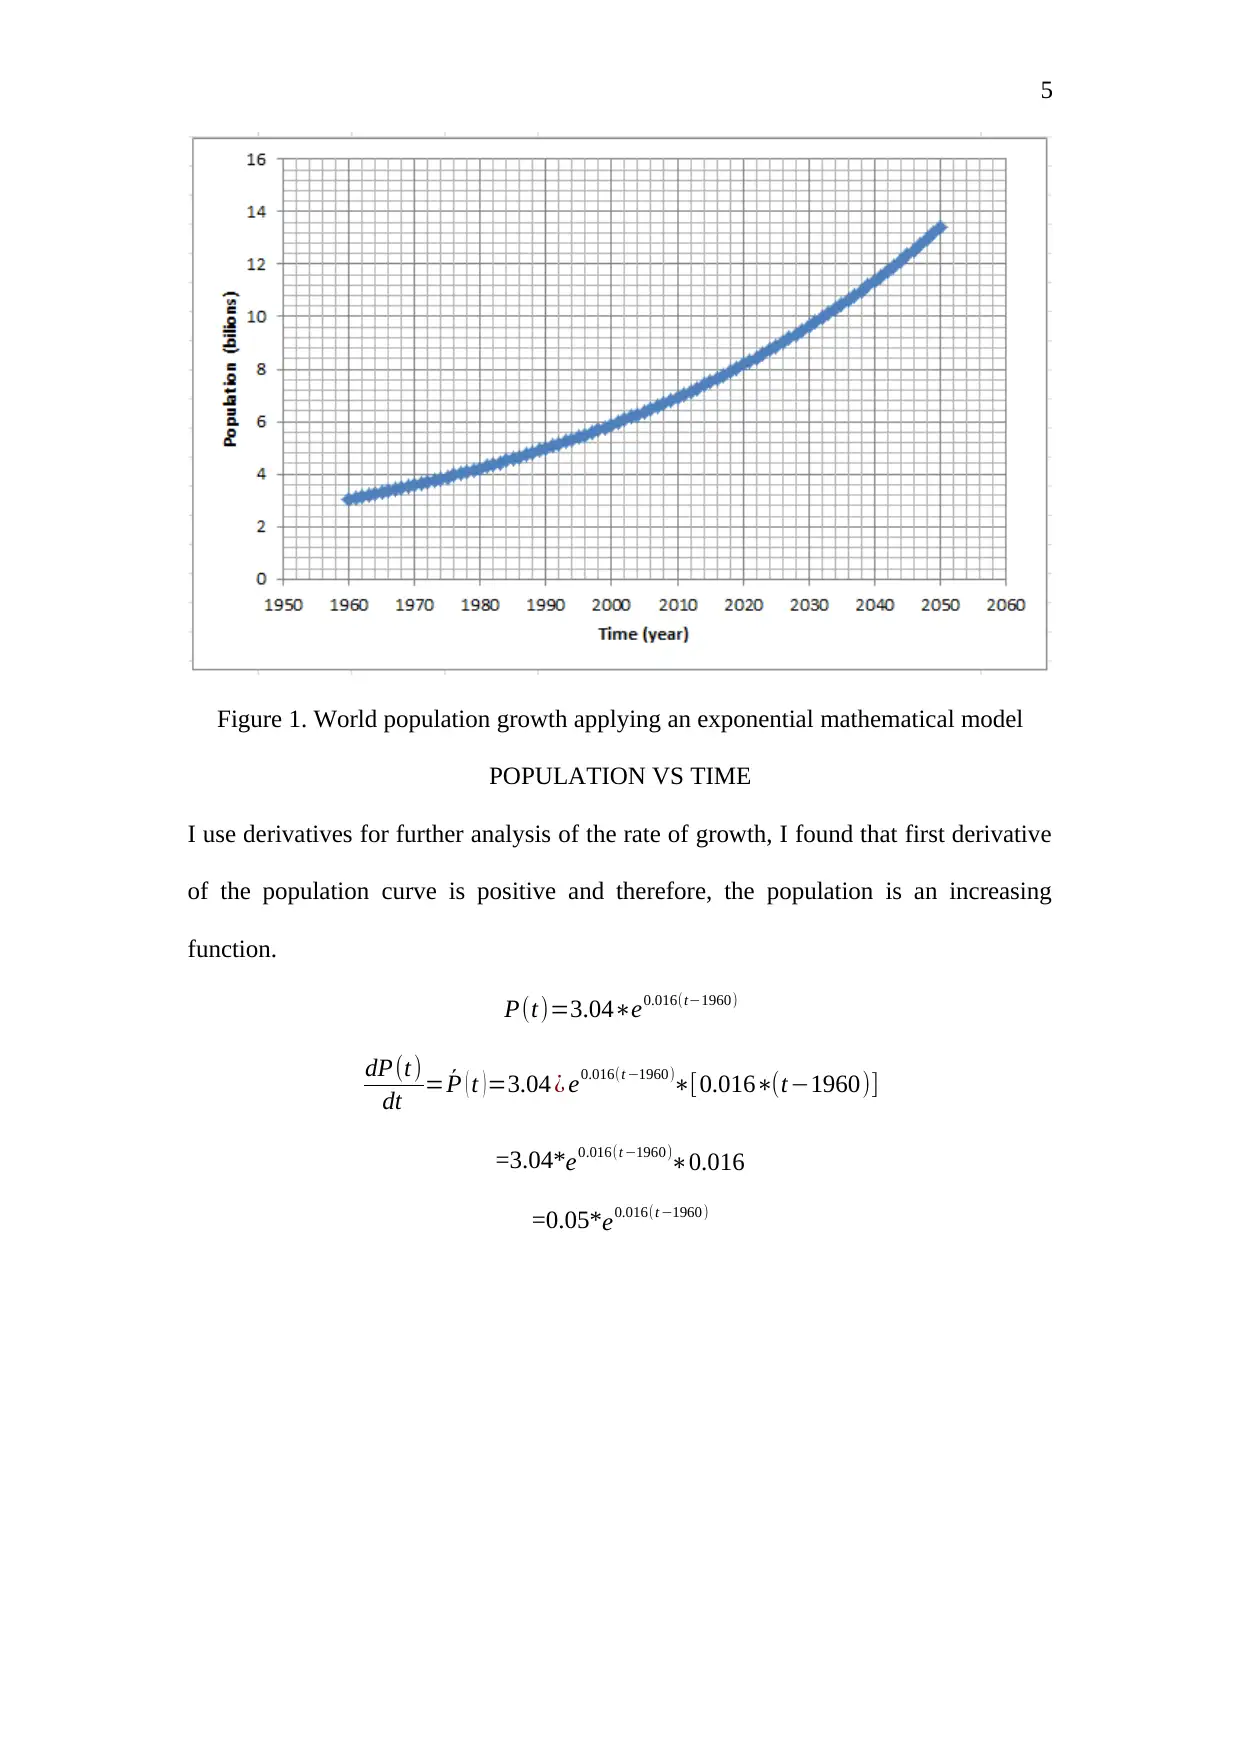
Figure 1. World population growth applying an exponential mathematical model
POPULATION VS TIME
I use derivatives for further analysis of the rate of growth, I found that first derivative
of the population curve is positive and therefore, the population is an increasing
function.
P(t)=3.04∗e0.016(t−1960)
dP(t)
dt = ´P ( t )=3.04 ¿ e0.016(t −1960)∗[0.016∗(t−1960)]
=3.04*e0.016(t −1960)∗0.016
=0.05*e0.016(t −1960)
6
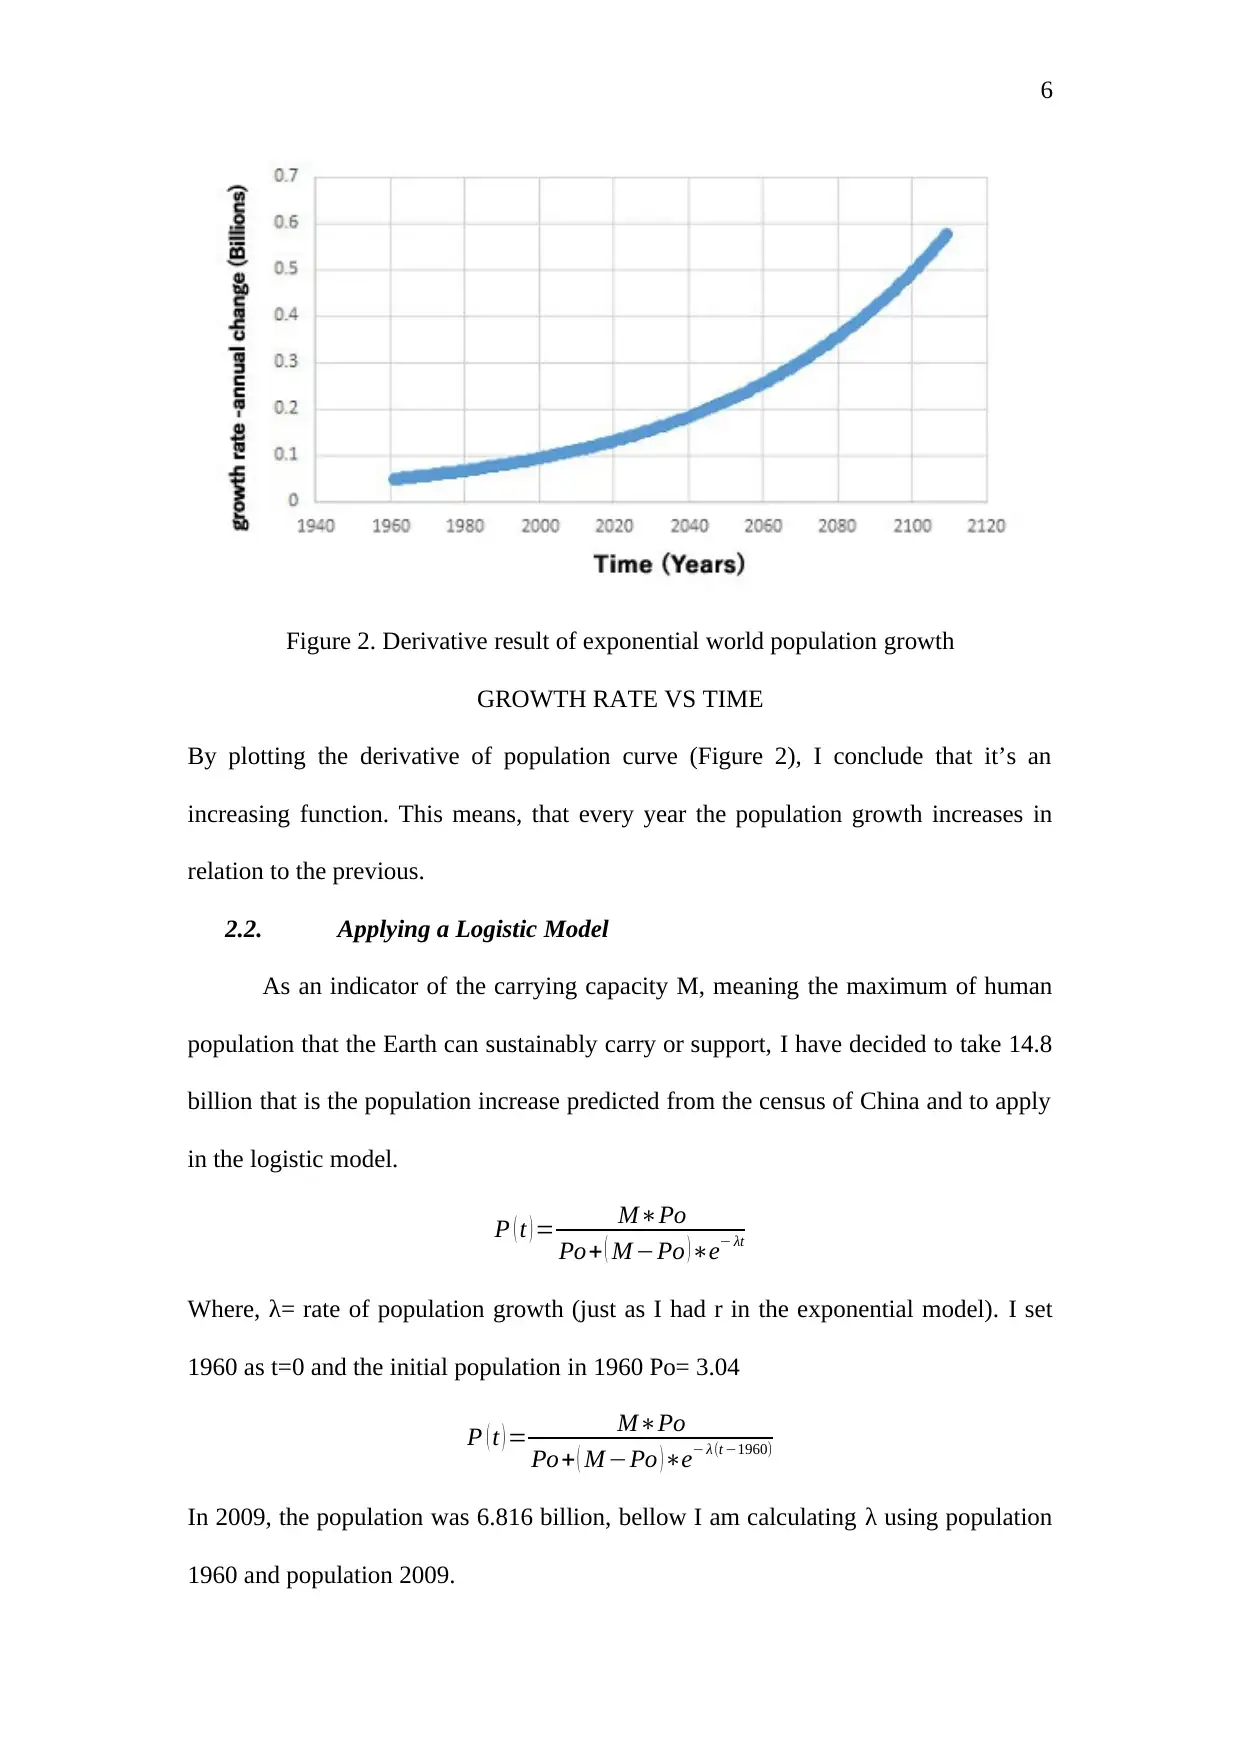
Figure 2. Derivative result of exponential world population growth
GROWTH RATE VS TIME
By plotting the derivative of population curve (Figure 2), I conclude that it’s an
increasing function. This means, that every year the population growth increases in
relation to the previous.
2.2. Applying a Logistic Model
As an indicator of the carrying capacity M, meaning the maximum of human
population that the Earth can sustainably carry or support, I have decided to take 14.8
billion that is the population increase predicted from the census of China and to apply
in the logistic model.
P ( t ) = M∗Po
Po+ ( M −Po ) ∗e− λt
Where, λ= rate of population growth (just as I had r in the exponential model). I set
1960 as t=0 and the initial population in 1960 Po= 3.04
P ( t ) = M∗Po
Po+ ( M −Po ) ∗e− λ(t −1960)
In 2009, the population was 6.816 billion, bellow I am calculating λ using population
1960 and population 2009.
7
6.816= 44.995
3.04 +11.76∗e−49 λ
3.04+11.76∗e−49 λ= 6.602
11.76∗e−49 λ= 6.602-3.04
e−49 λ= 6.602−3.04
11.76
e−49 λ=0.303
lne−49 λ=ln 0.303
−49 λ=−1.195
λ=−1.195
−49
λ=0.024
P(t)= 44.326
3.04 +11.759∗e−0.024(t−1960)
P(2050)= 44.326
3.04+11.759∗e−0.024 (2050 −1960)
P ( t ) = 44.326
3.04 +11.759∗e−0.024∗90 =10.18
Thus, according to the logistic model, the projection for the global population is
10.187 billion, a figure that is close to the UN projection (9.6) in 2050. The global
population growth trend from the 1960s to 2050s is projected in Figure 3.
Paraphrase This Document
Need a fresh take? Get an instant paraphrase of this document with our AI Paraphraser
8
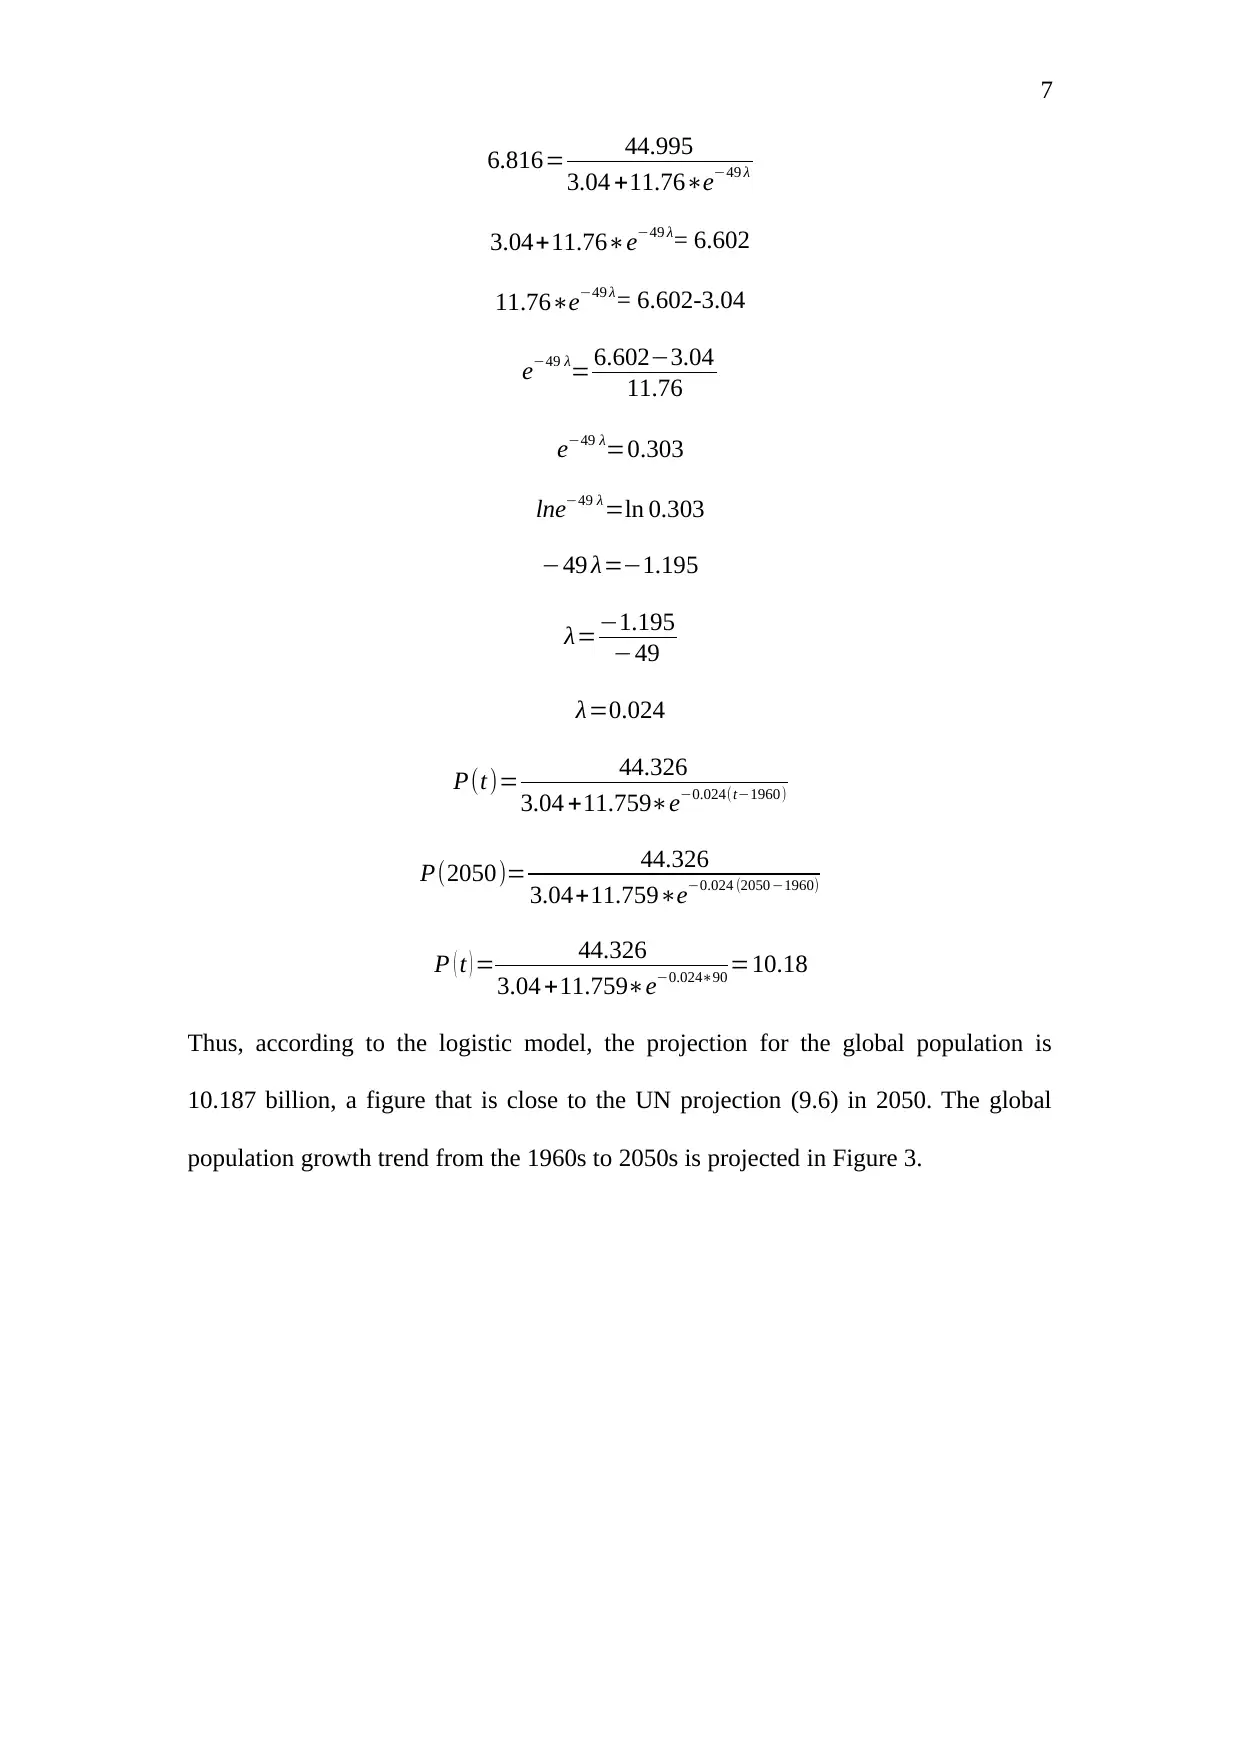
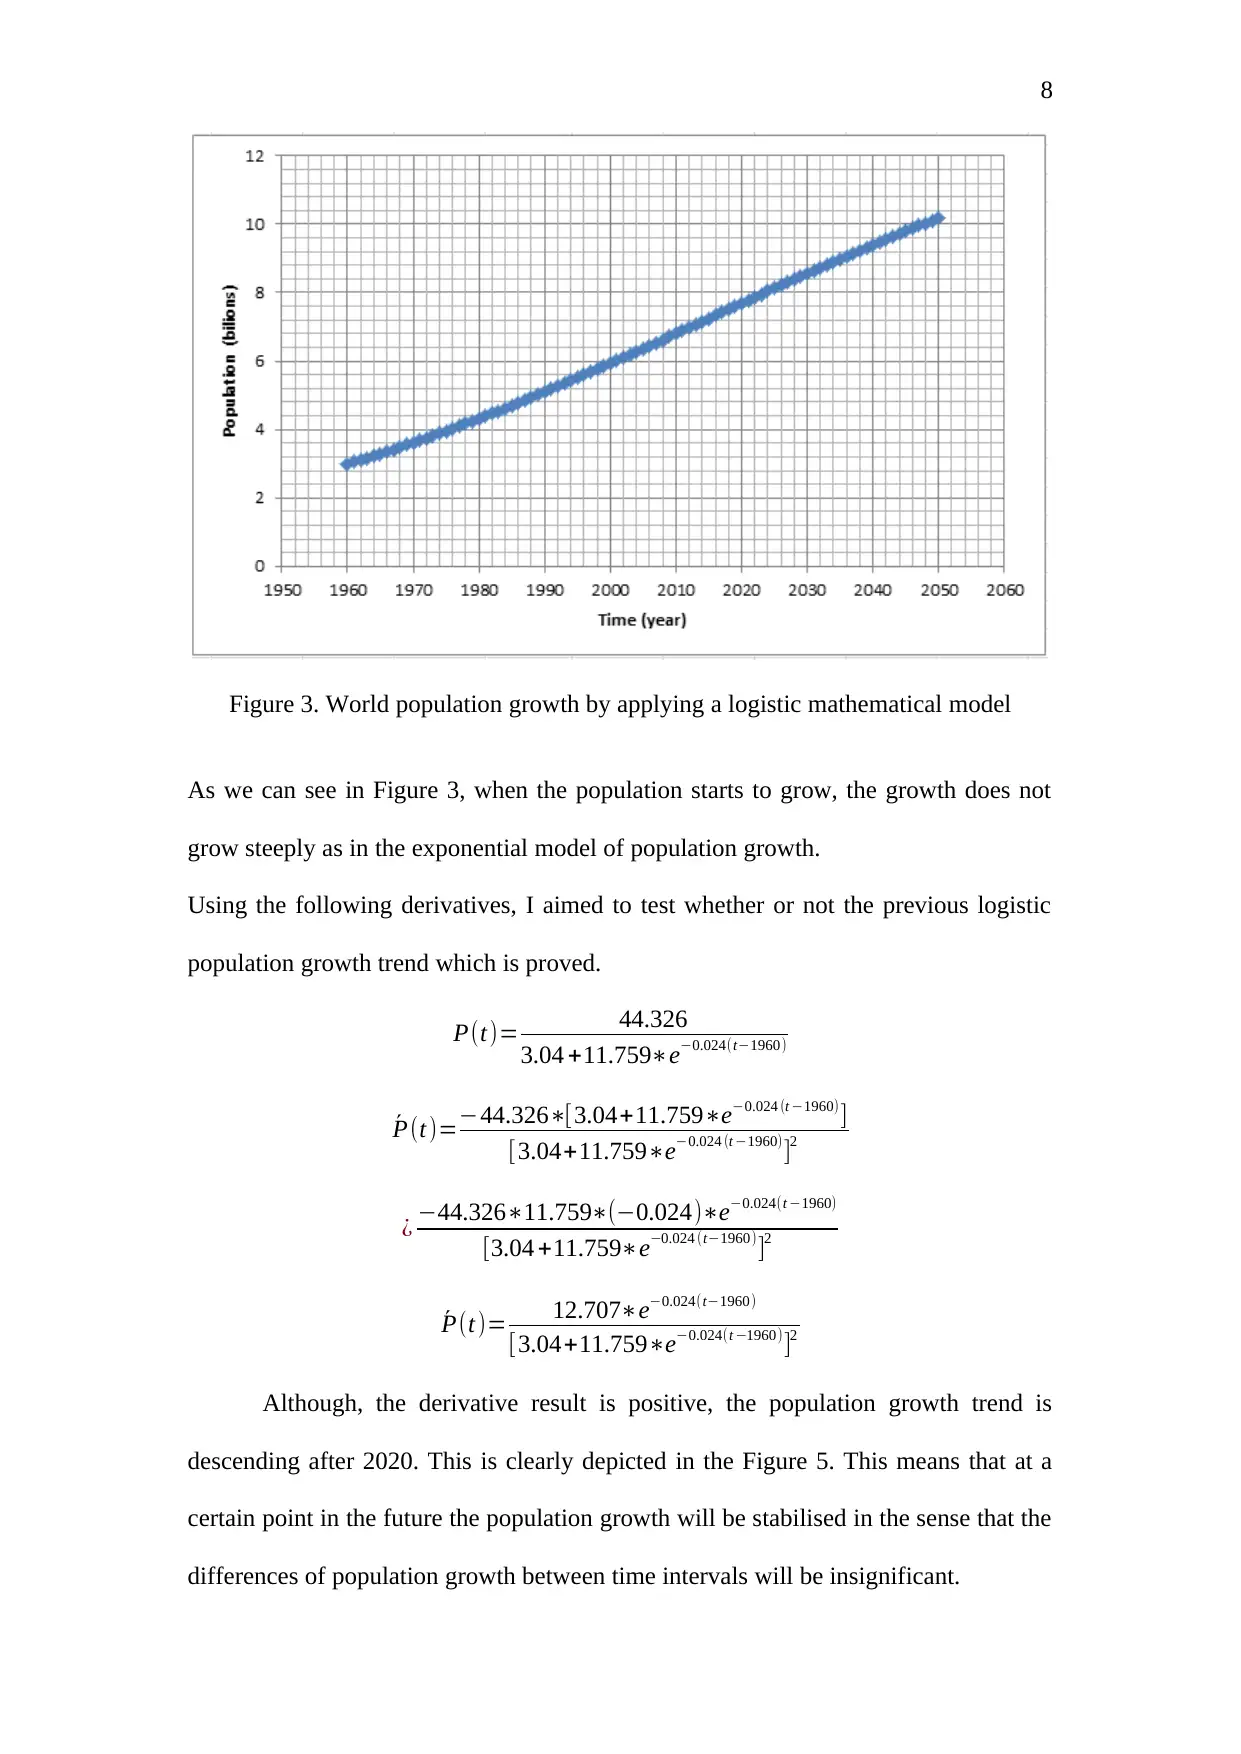
Figure 3. World population growth by applying a logistic mathematical model
As we can see in Figure 3, when the population starts to grow, the growth does not
grow steeply as in the exponential model of population growth.
Using the following derivatives, I aimed to test whether or not the previous logistic
population growth trend which is proved.
P(t)= 44.326
3.04 +11.759∗e−0.024(t−1960)
´P(t)=−44.326∗[3.04+11.759∗e−0.024 (t −1960)]
[3.04+11.759∗e−0.024 (t −1960)]2
¿ −44.326∗11.759∗(−0.024)∗e−0.024(t −1960)
[3.04 +11.759∗e−0.024 (t−1960)]2
´P(t)= 12.707∗e−0.024(t−1960)
[3.04+11.759∗e−0.024(t −1960)]2
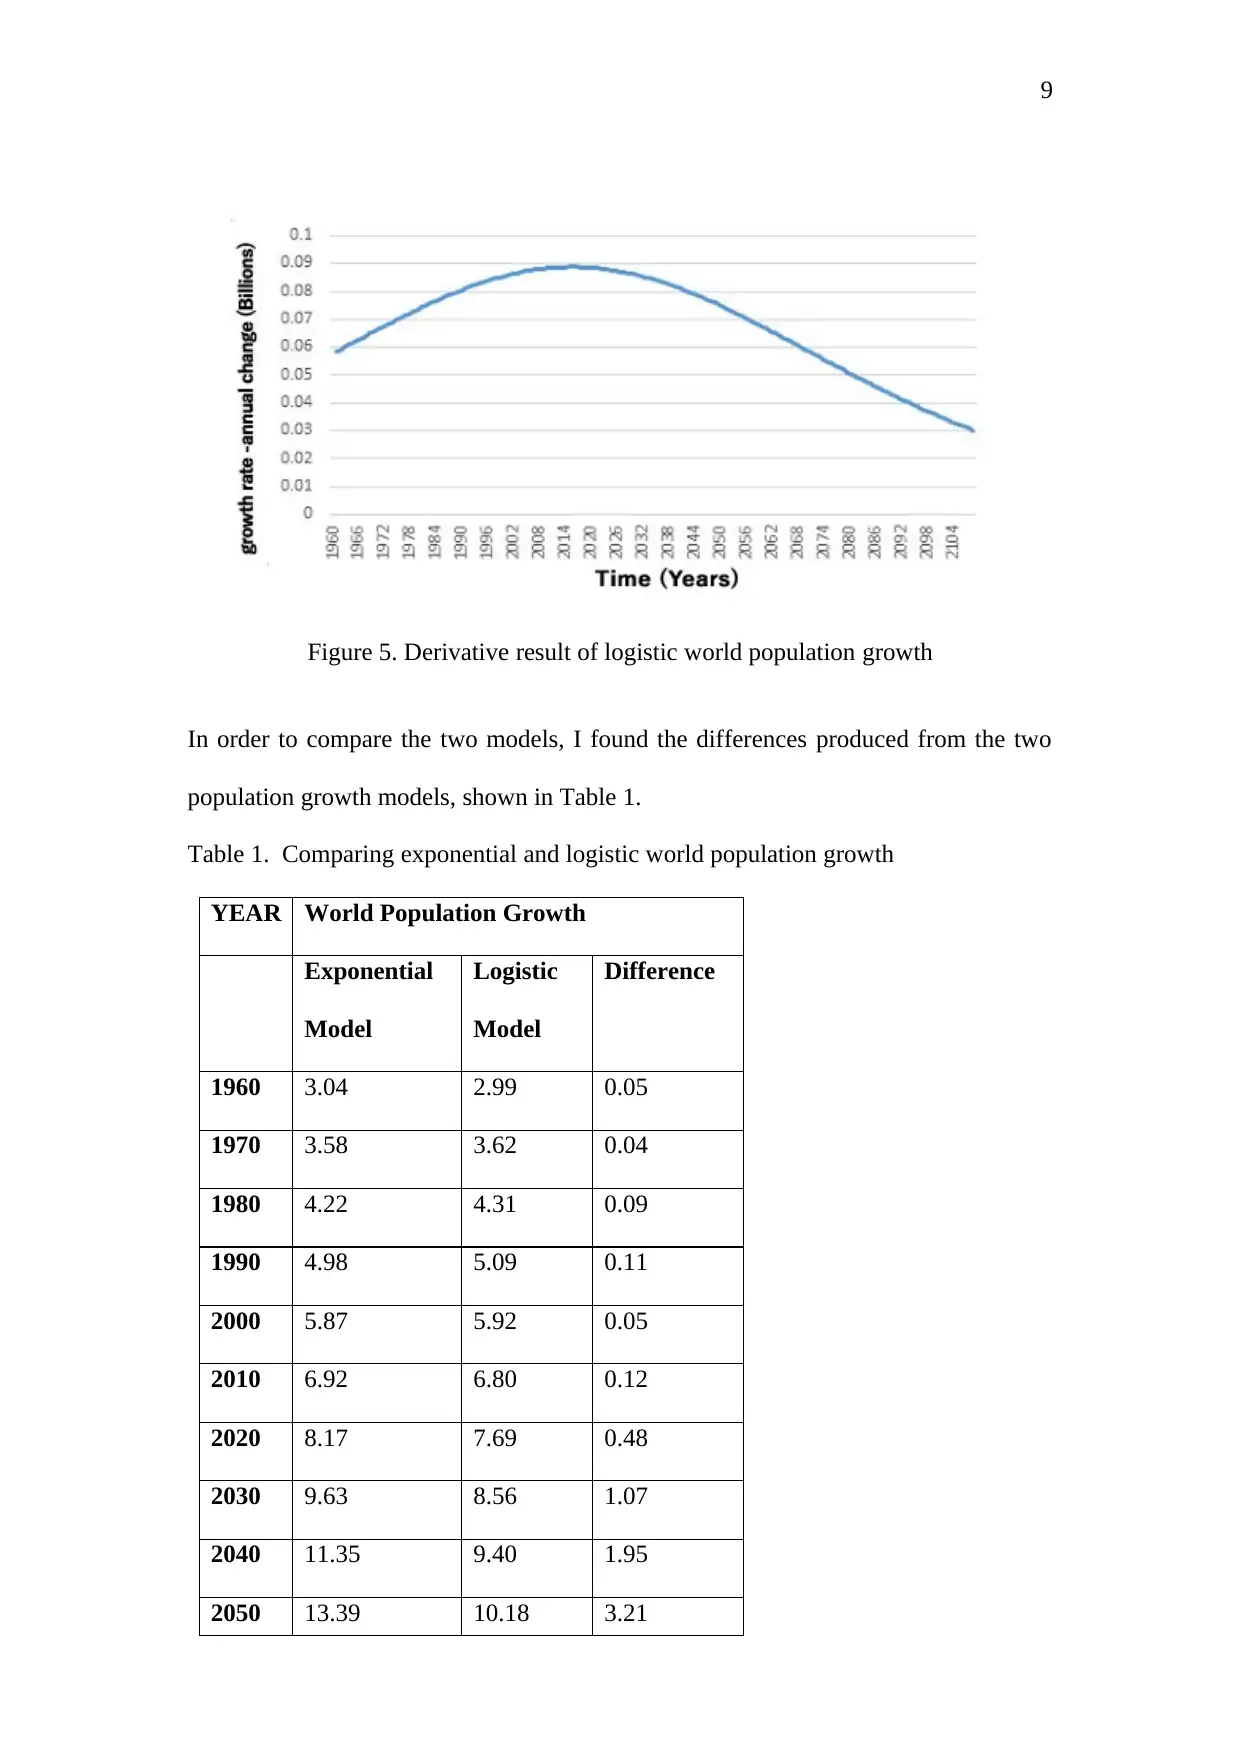
Although, the derivative result is positive, the population growth trend is
descending after 2020. This is clearly depicted in the Figure 5. This means that at a
certain point in the future the population growth will be stabilised in the sense that the
differences of population growth between time intervals will be insignificant.
Figure 3. World population growth by applying a logistic mathematical model
As we can see in Figure 3, when the population starts to grow, the growth does not
grow steeply as in the exponential model of population growth.
Using the following derivatives, I aimed to test whether or not the previous logistic
population growth trend which is proved.
P(t)= 44.326
3.04 +11.759∗e−0.024(t−1960)
´P(t)=−44.326∗[3.04+11.759∗e−0.024 (t −1960)]
[3.04+11.759∗e−0.024 (t −1960)]2
¿ −44.326∗11.759∗(−0.024)∗e−0.024(t −1960)
[3.04 +11.759∗e−0.024 (t−1960)]2
´P(t)= 12.707∗e−0.024(t−1960)
[3.04+11.759∗e−0.024(t −1960)]2
Although, the derivative result is positive, the population growth trend is
descending after 2020. This is clearly depicted in the Figure 5. This means that at a
certain point in the future the population growth will be stabilised in the sense that the
differences of population growth between time intervals will be insignificant.
9
Figure 5. Derivative result of logistic world population growth
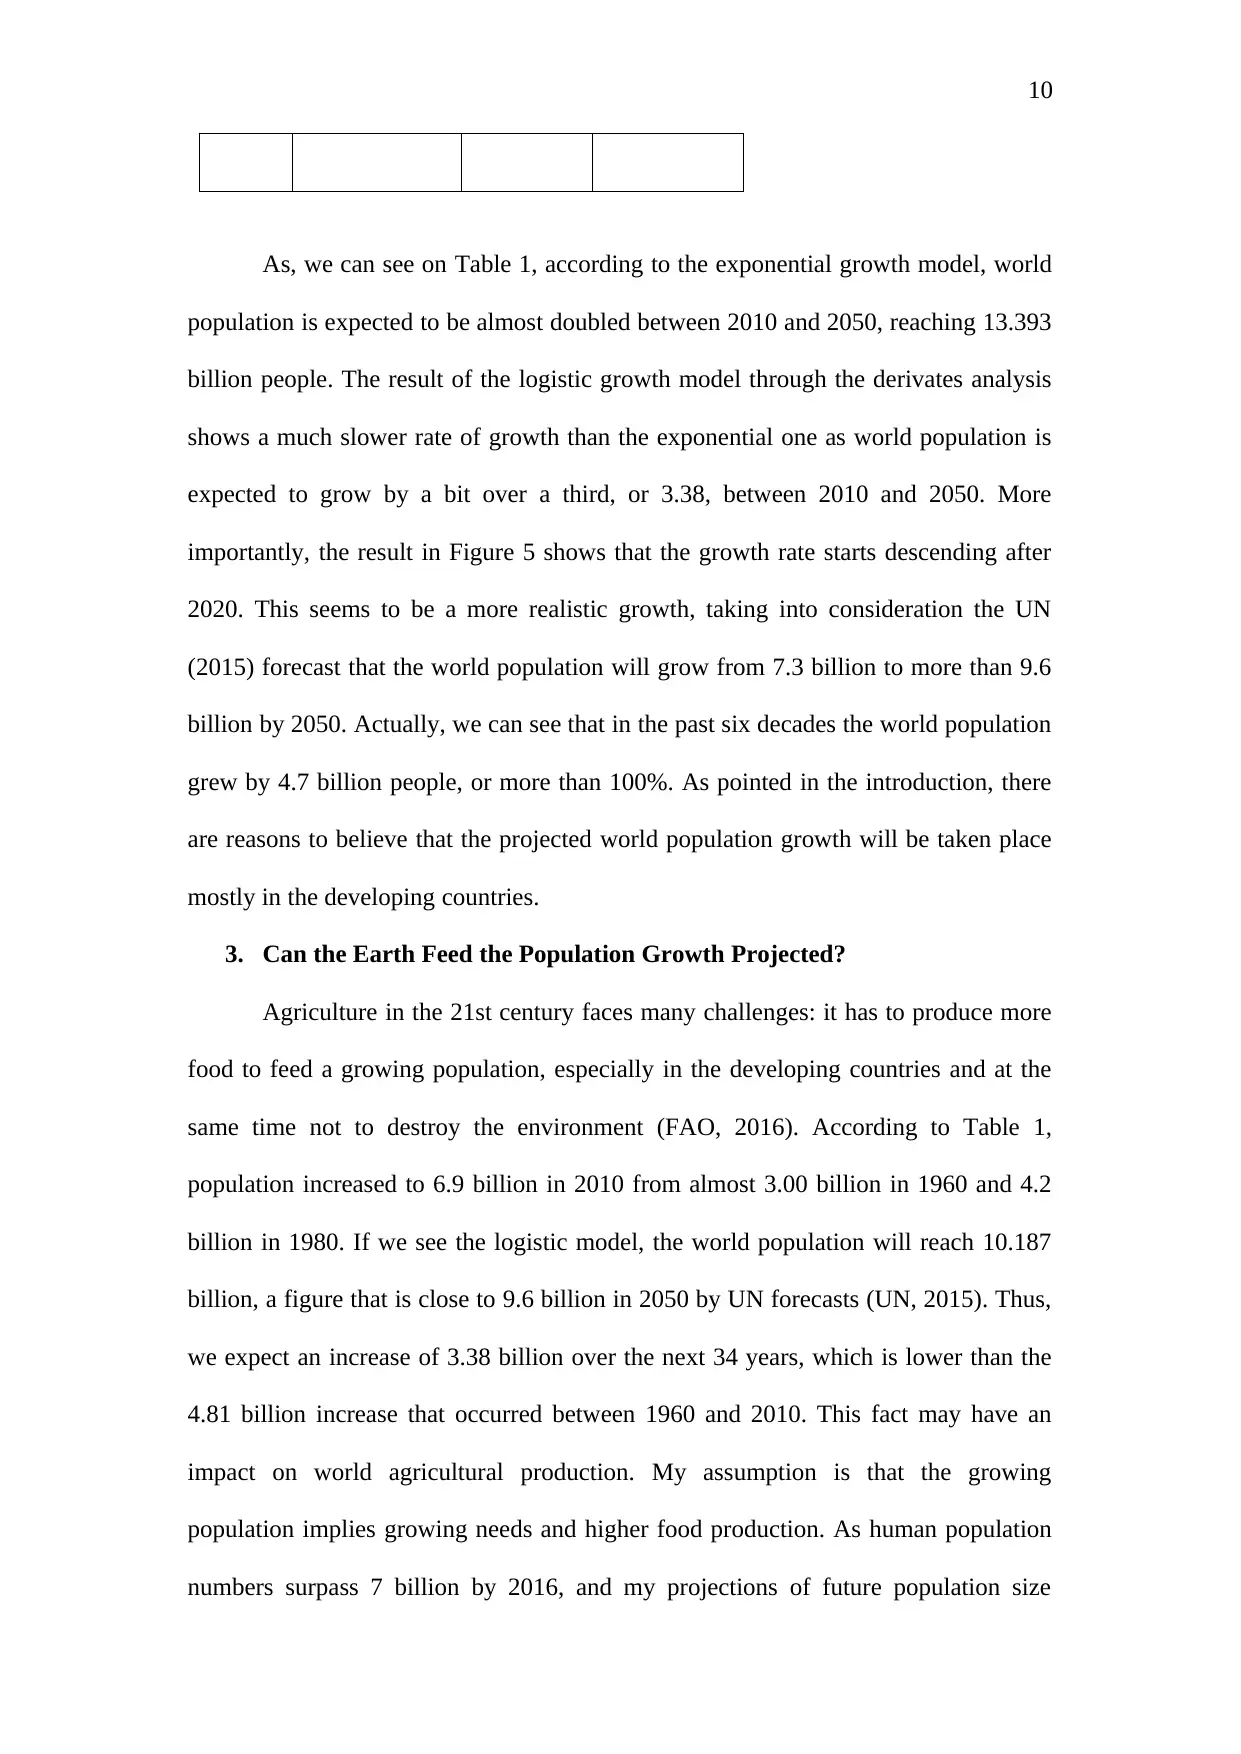
In order to compare the two models, I found the differences produced from the two
population growth models, shown in Table 1.
Table 1. Comparing exponential and logistic world population growth
YEAR World Population Growth
Exponential
Model
Logistic
Model
Difference
1960 3.04 2.99 0.05
1970 3.58 3.62 0.04
1980 4.22 4.31 0.09
1990 4.98 5.09 0.11
2000 5.87 5.92 0.05
2010 6.92 6.80 0.12
2020 8.17 7.69 0.48
2030 9.63 8.56 1.07
2040 11.35 9.40 1.95
2050 13.39 10.18 3.21
Figure 5. Derivative result of logistic world population growth
In order to compare the two models, I found the differences produced from the two
population growth models, shown in Table 1.
Table 1. Comparing exponential and logistic world population growth
YEAR World Population Growth
Exponential
Model
Logistic
Model
Difference
1960 3.04 2.99 0.05
1970 3.58 3.62 0.04
1980 4.22 4.31 0.09
1990 4.98 5.09 0.11
2000 5.87 5.92 0.05
2010 6.92 6.80 0.12
2020 8.17 7.69 0.48
2030 9.63 8.56 1.07
2040 11.35 9.40 1.95
2050 13.39 10.18 3.21
10
Αs, we can see on Table 1, according to the exponential growth model, world
population is expected to be almost doubled between 2010 and 2050, reaching 13.393
billion people. The result of the logistic growth model through the derivates analysis
shows a much slower rate of growth than the exponential one as world population is
expected to grow by a bit over a third, or 3.38, between 2010 and 2050. More
importantly, the result in Figure 5 shows that the growth rate starts descending after
2020. This seems to be a more realistic growth, taking into consideration the UN
(2015) forecast that the world population will grow from 7.3 billion to more than 9.6
billion by 2050. Actually, we can see that in the past six decades the world population
grew by 4.7 billion people, or more than 100%. As pointed in the introduction, there
are reasons to believe that the projected world population growth will be taken place
mostly in the developing countries.
3. Can the Earth Feed the Population Growth Projected?
Agriculture in the 21st century faces many challenges: it has to produce more
food to feed a growing population, especially in the developing countries and at the
same time not to destroy the environment (FAO, 2016). According to Table 1,
population increased to 6.9 billion in 2010 from almost 3.00 billion in 1960 and 4.2
billion in 1980. If we see the logistic model, the world population will reach 10.187
billion, a figure that is close to 9.6 billion in 2050 by UN forecasts (UN, 2015). Thus,
we expect an increase of 3.38 billion over the next 34 years, which is lower than the
4.81 billion increase that occurred between 1960 and 2010. This fact may have an
impact on world agricultural production. My assumption is that the growing
population implies growing needs and higher food production. As human population
numbers surpass 7 billion by 2016, and my projections of future population size
Secure Best Marks with AI Grader
Need help grading? Try our AI Grader for instant feedback on your assignments.
11
exceeds 13 billion in 2050 by applying the exponential growth model and 10 billion
by applying the logistic population growth model, the need to understand its impact
on feeding the human population becomes very pressing.
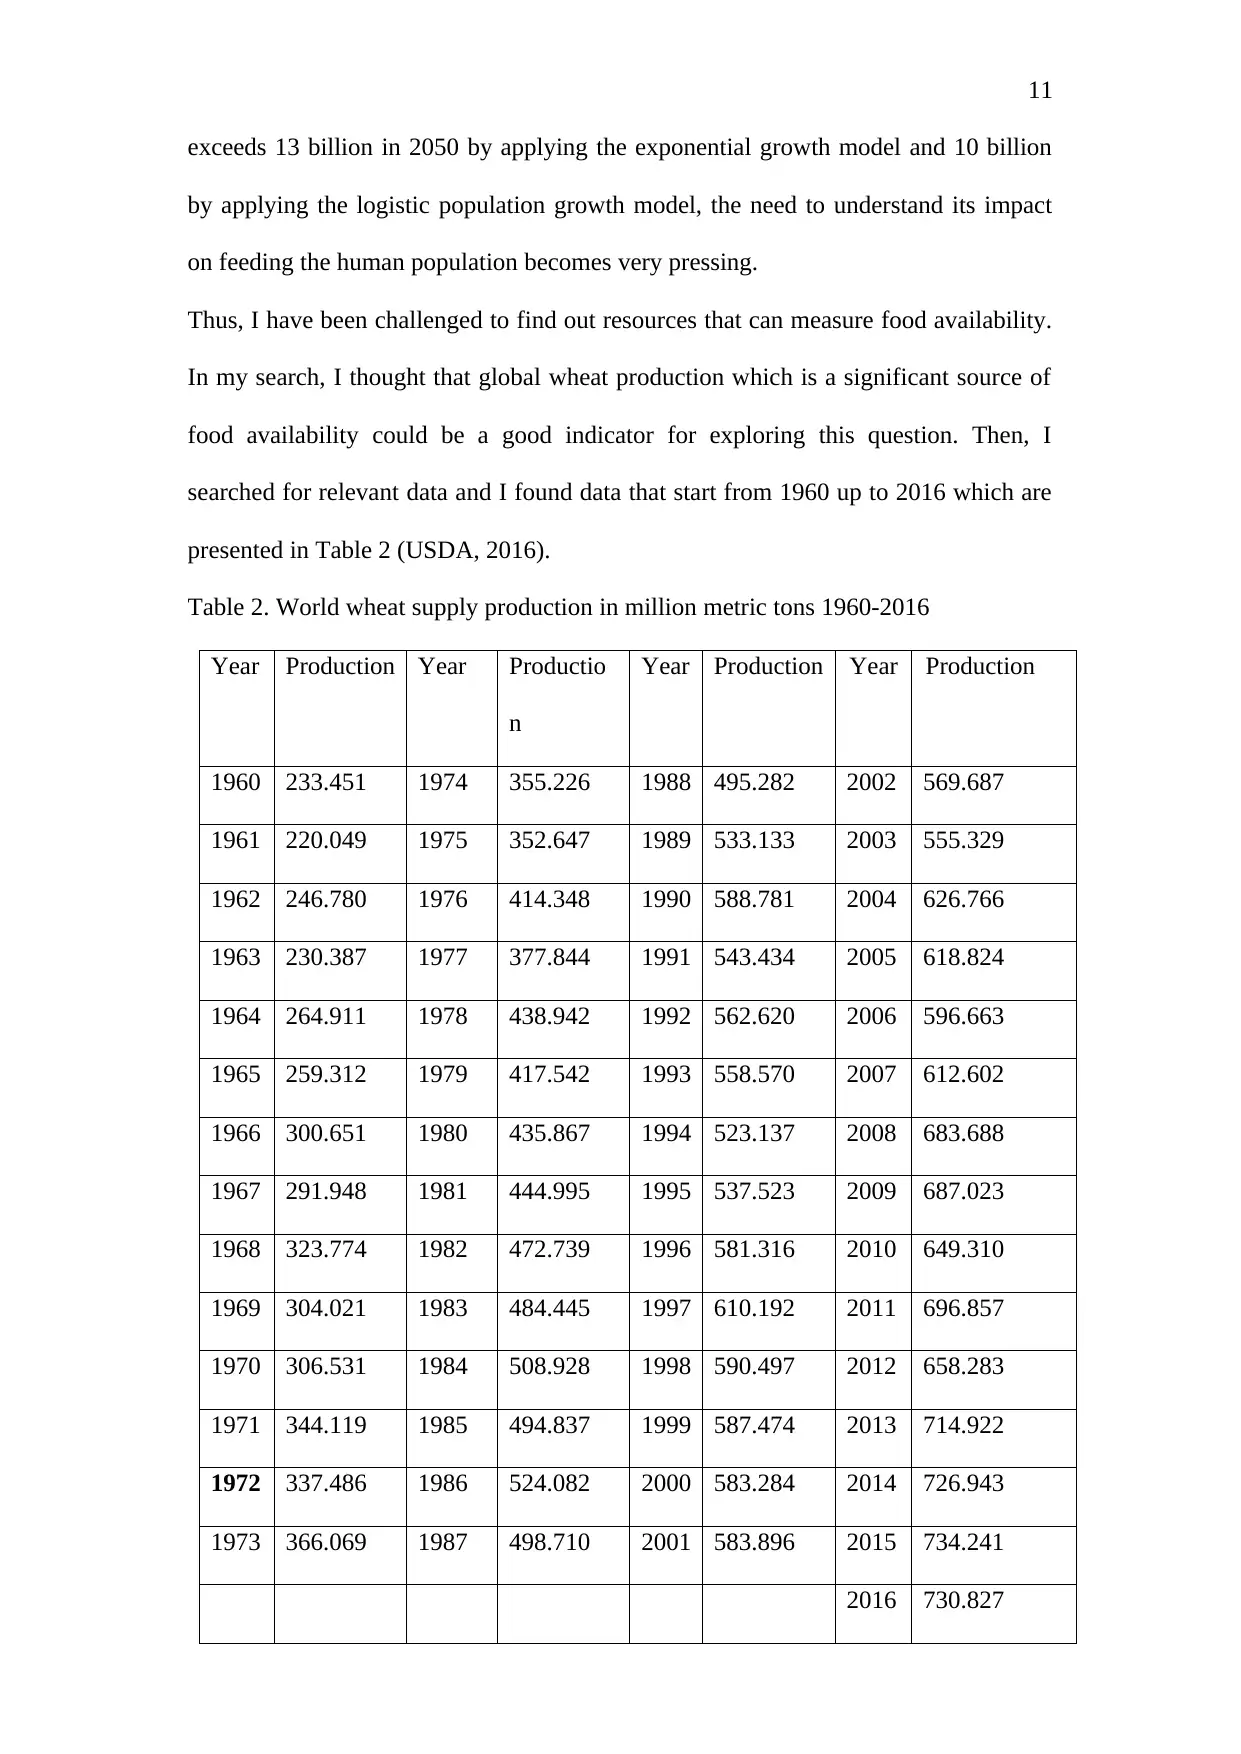
Thus, I have been challenged to find out resources that can measure food availability.
In my search, I thought that global wheat production which is a significant source of
food availability could be a good indicator for exploring this question. Then, I
searched for relevant data and I found data that start from 1960 up to 2016 which are
presented in Table 2 (USDA, 2016).
Table 2. World wheat supply production in million metric tons 1960-2016
Year Production Year Productio
n
Year Production Year Production
1960 233.451 1974 355.226 1988 495.282 2002 569.687
1961 220.049 1975 352.647 1989 533.133 2003 555.329
1962 246.780 1976 414.348 1990 588.781 2004 626.766
1963 230.387 1977 377.844 1991 543.434 2005 618.824
1964 264.911 1978 438.942 1992 562.620 2006 596.663
1965 259.312 1979 417.542 1993 558.570 2007 612.602
1966 300.651 1980 435.867 1994 523.137 2008 683.688
1967 291.948 1981 444.995 1995 537.523 2009 687.023
1968 323.774 1982 472.739 1996 581.316 2010 649.310
1969 304.021 1983 484.445 1997 610.192 2011 696.857
1970 306.531 1984 508.928 1998 590.497 2012 658.283
1971 344.119 1985 494.837 1999 587.474 2013 714.922
1972 337.486 1986 524.082 2000 583.284 2014 726.943
1973 366.069 1987 498.710 2001 583.896 2015 734.241
2016 730.827
exceeds 13 billion in 2050 by applying the exponential growth model and 10 billion
by applying the logistic population growth model, the need to understand its impact
on feeding the human population becomes very pressing.
Thus, I have been challenged to find out resources that can measure food availability.
In my search, I thought that global wheat production which is a significant source of
food availability could be a good indicator for exploring this question. Then, I
searched for relevant data and I found data that start from 1960 up to 2016 which are
presented in Table 2 (USDA, 2016).
Table 2. World wheat supply production in million metric tons 1960-2016
Year Production Year Productio
n
Year Production Year Production
1960 233.451 1974 355.226 1988 495.282 2002 569.687
1961 220.049 1975 352.647 1989 533.133 2003 555.329
1962 246.780 1976 414.348 1990 588.781 2004 626.766
1963 230.387 1977 377.844 1991 543.434 2005 618.824
1964 264.911 1978 438.942 1992 562.620 2006 596.663
1965 259.312 1979 417.542 1993 558.570 2007 612.602
1966 300.651 1980 435.867 1994 523.137 2008 683.688
1967 291.948 1981 444.995 1995 537.523 2009 687.023
1968 323.774 1982 472.739 1996 581.316 2010 649.310
1969 304.021 1983 484.445 1997 610.192 2011 696.857
1970 306.531 1984 508.928 1998 590.497 2012 658.283
1971 344.119 1985 494.837 1999 587.474 2013 714.922
1972 337.486 1986 524.082 2000 583.284 2014 726.943
1973 366.069 1987 498.710 2001 583.896 2015 734.241
2016 730.827
12
Source: Aggregated based on local marketing years. Latest data may be preliminary
or projected. Excludes intra-European Union trade. Source: USDA, Foreign
Agricultural Service, Production, Supply, and Distribution Database. 7/12/2016
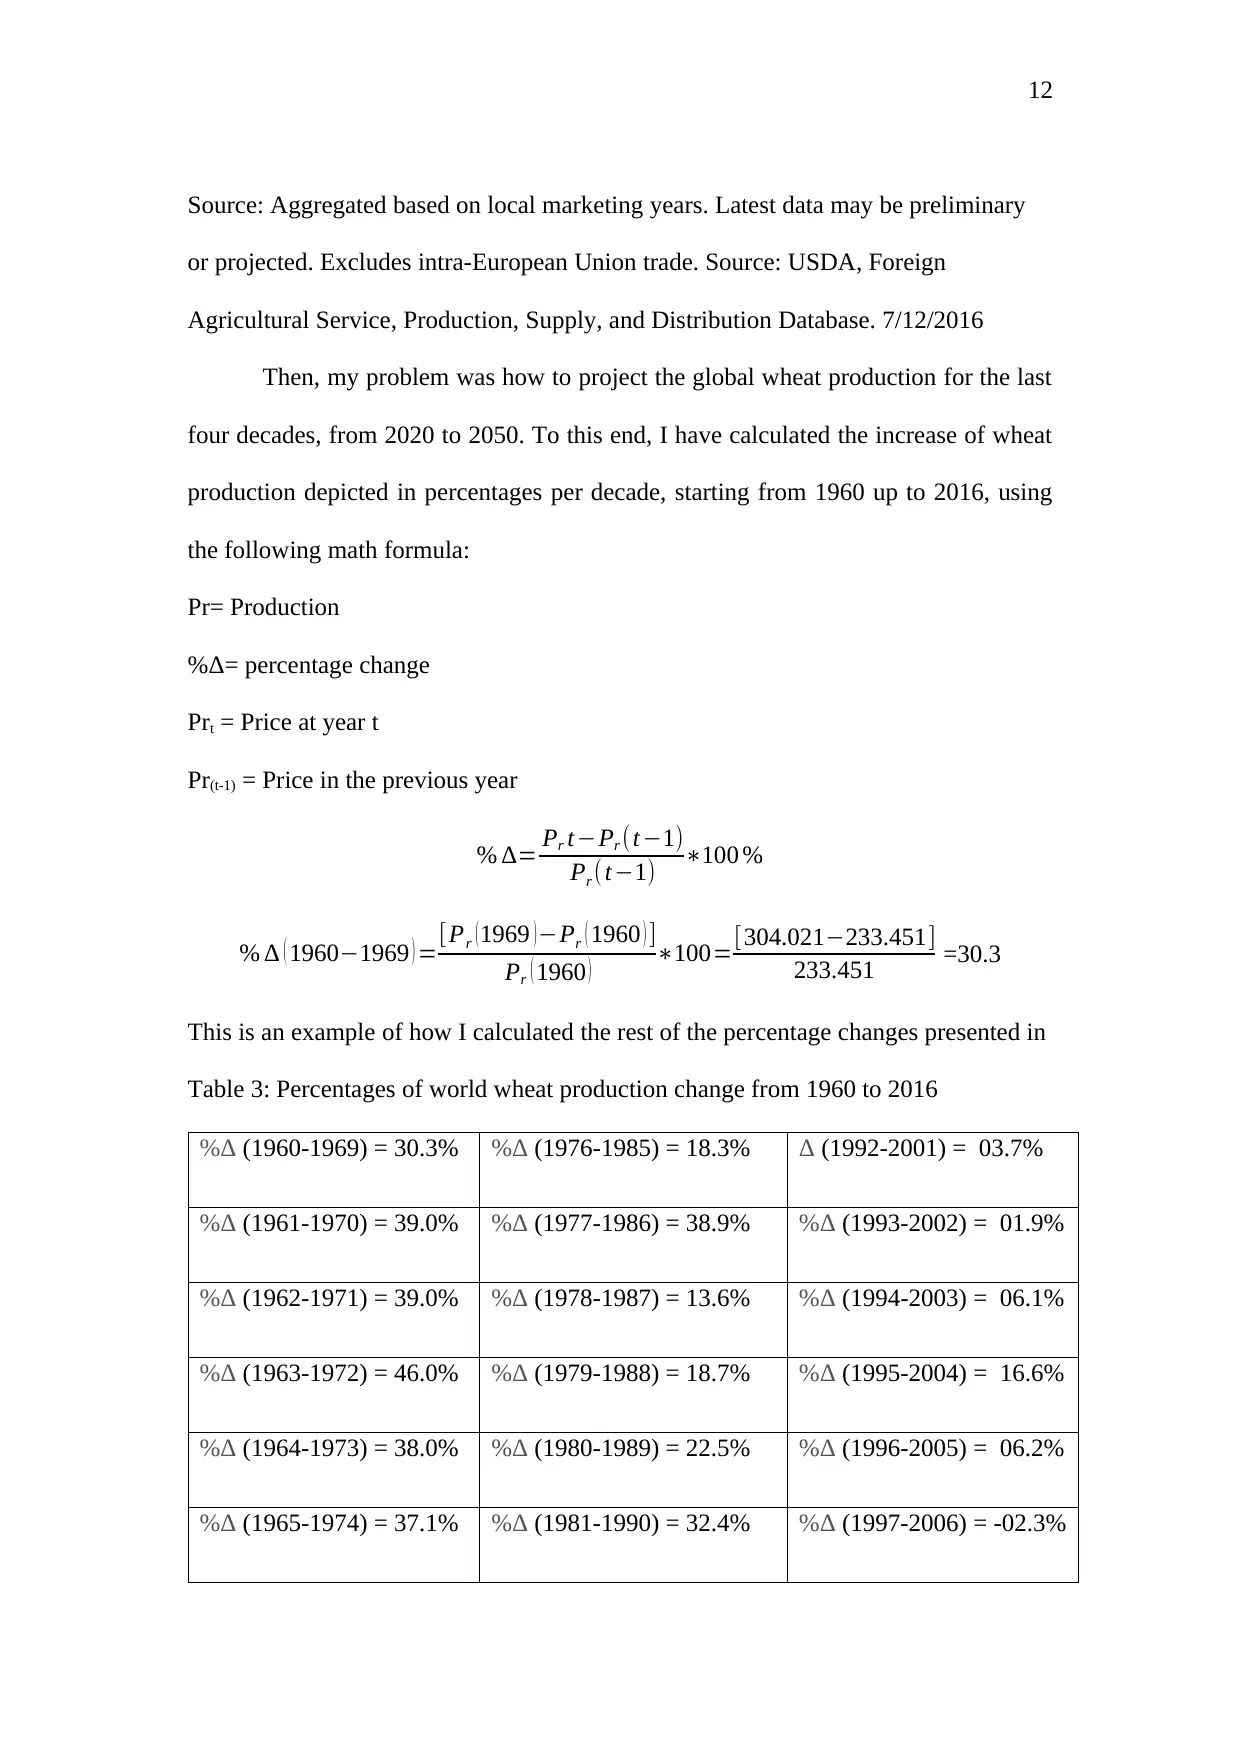
Then, my problem was how to project the global wheat production for the last
four decades, from 2020 to 2050. To this end, I have calculated the increase of wheat
production depicted in percentages per decade, starting from 1960 up to 2016, using
the following math formula:
Pr= Production
%Δ= percentage change
Prt = Price at year t
Pr(t-1) = Price in the previous year
% ∆= Pr t−Pr (t−1)
Pr (t−1) ∗100 %
% ∆ ( 1960−1969 ) =[Pr (1969 )−Pr ( 1960 ) ]
Pr ( 1960 ) ∗100=[304.021−233.451]
233.451 =30.3
This is an example of how I calculated the rest of the percentage changes presented in
Table 3: Percentages of world wheat production change from 1960 to 2016
%Δ (1960-1969) = 30.3% %Δ (1976-1985) = 18.3% Δ (1992-2001) = 03.7%
%Δ (1961-1970) = 39.0% %Δ (1977-1986) = 38.9% %Δ (1993-2002) = 01.9%
%Δ (1962-1971) = 39.0% %Δ (1978-1987) = 13.6% %Δ (1994-2003) = 06.1%
%Δ (1963-1972) = 46.0% %Δ (1979-1988) = 18.7% %Δ (1995-2004) = 16.6%
%Δ (1964-1973) = 38.0% %Δ (1980-1989) = 22.5% %Δ (1996-2005) = 06.2%
%Δ (1965-1974) = 37.1% %Δ (1981-1990) = 32.4% %Δ (1997-2006) = -02.3%
Source: Aggregated based on local marketing years. Latest data may be preliminary
or projected. Excludes intra-European Union trade. Source: USDA, Foreign
Agricultural Service, Production, Supply, and Distribution Database. 7/12/2016
Then, my problem was how to project the global wheat production for the last
four decades, from 2020 to 2050. To this end, I have calculated the increase of wheat
production depicted in percentages per decade, starting from 1960 up to 2016, using
the following math formula:
Pr= Production
%Δ= percentage change
Prt = Price at year t
Pr(t-1) = Price in the previous year
% ∆= Pr t−Pr (t−1)
Pr (t−1) ∗100 %
% ∆ ( 1960−1969 ) =[Pr (1969 )−Pr ( 1960 ) ]
Pr ( 1960 ) ∗100=[304.021−233.451]
233.451 =30.3
This is an example of how I calculated the rest of the percentage changes presented in
Table 3: Percentages of world wheat production change from 1960 to 2016
%Δ (1960-1969) = 30.3% %Δ (1976-1985) = 18.3% Δ (1992-2001) = 03.7%
%Δ (1961-1970) = 39.0% %Δ (1977-1986) = 38.9% %Δ (1993-2002) = 01.9%
%Δ (1962-1971) = 39.0% %Δ (1978-1987) = 13.6% %Δ (1994-2003) = 06.1%
%Δ (1963-1972) = 46.0% %Δ (1979-1988) = 18.7% %Δ (1995-2004) = 16.6%
%Δ (1964-1973) = 38.0% %Δ (1980-1989) = 22.5% %Δ (1996-2005) = 06.2%
%Δ (1965-1974) = 37.1% %Δ (1981-1990) = 32.4% %Δ (1997-2006) = -02.3%
13
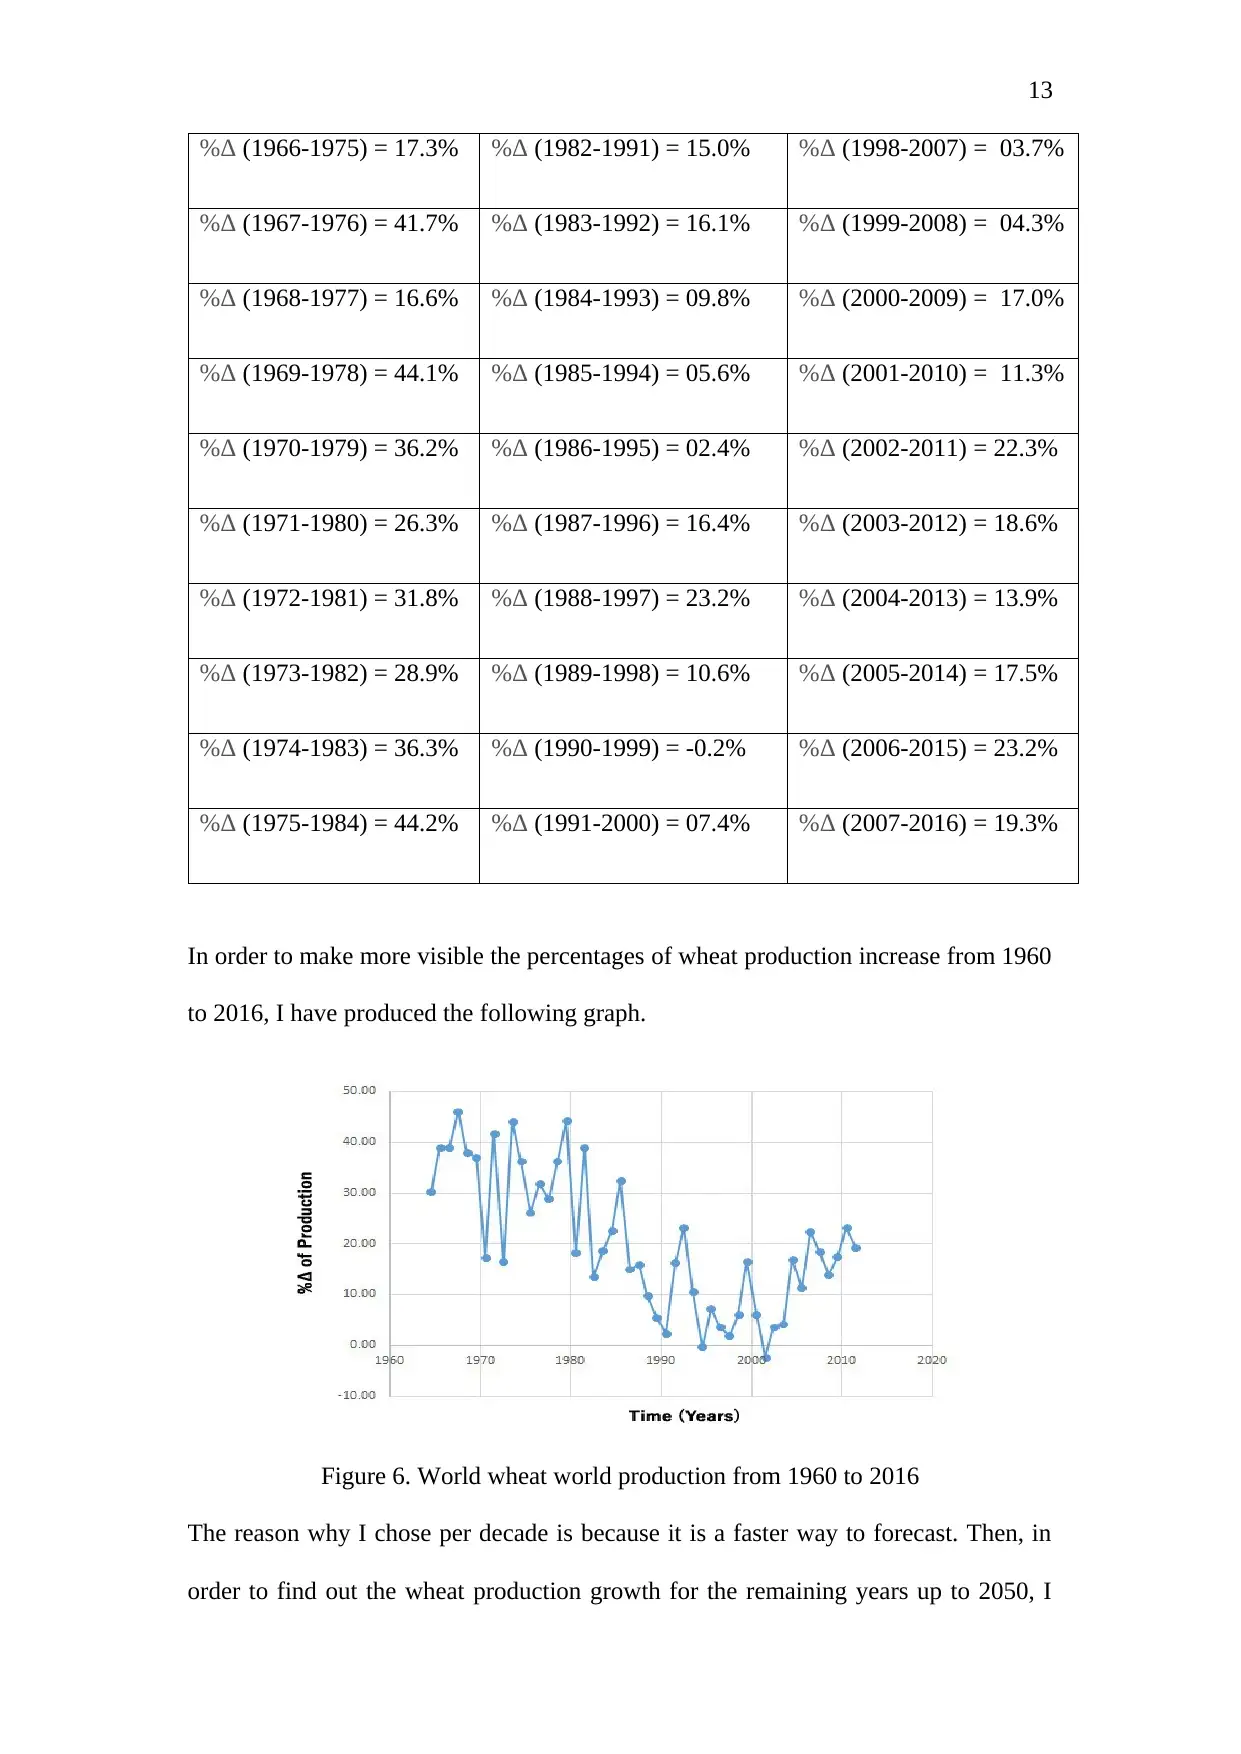
%Δ (1966-1975) = 17.3% %Δ (1982-1991) = 15.0% %Δ (1998-2007) = 03.7%
%Δ (1967-1976) = 41.7% %Δ (1983-1992) = 16.1% %Δ (1999-2008) = 04.3%
%Δ (1968-1977) = 16.6% %Δ (1984-1993) = 09.8% %Δ (2000-2009) = 17.0%
%Δ (1969-1978) = 44.1% %Δ (1985-1994) = 05.6% %Δ (2001-2010) = 11.3%
%Δ (1970-1979) = 36.2% %Δ (1986-1995) = 02.4% %Δ (2002-2011) = 22.3%
%Δ (1971-1980) = 26.3% %Δ (1987-1996) = 16.4% %Δ (2003-2012) = 18.6%
%Δ (1972-1981) = 31.8% %Δ (1988-1997) = 23.2% %Δ (2004-2013) = 13.9%
%Δ (1973-1982) = 28.9% %Δ (1989-1998) = 10.6% %Δ (2005-2014) = 17.5%
%Δ (1974-1983) = 36.3% %Δ (1990-1999) = -0.2% %Δ (2006-2015) = 23.2%
%Δ (1975-1984) = 44.2% %Δ (1991-2000) = 07.4% %Δ (2007-2016) = 19.3%
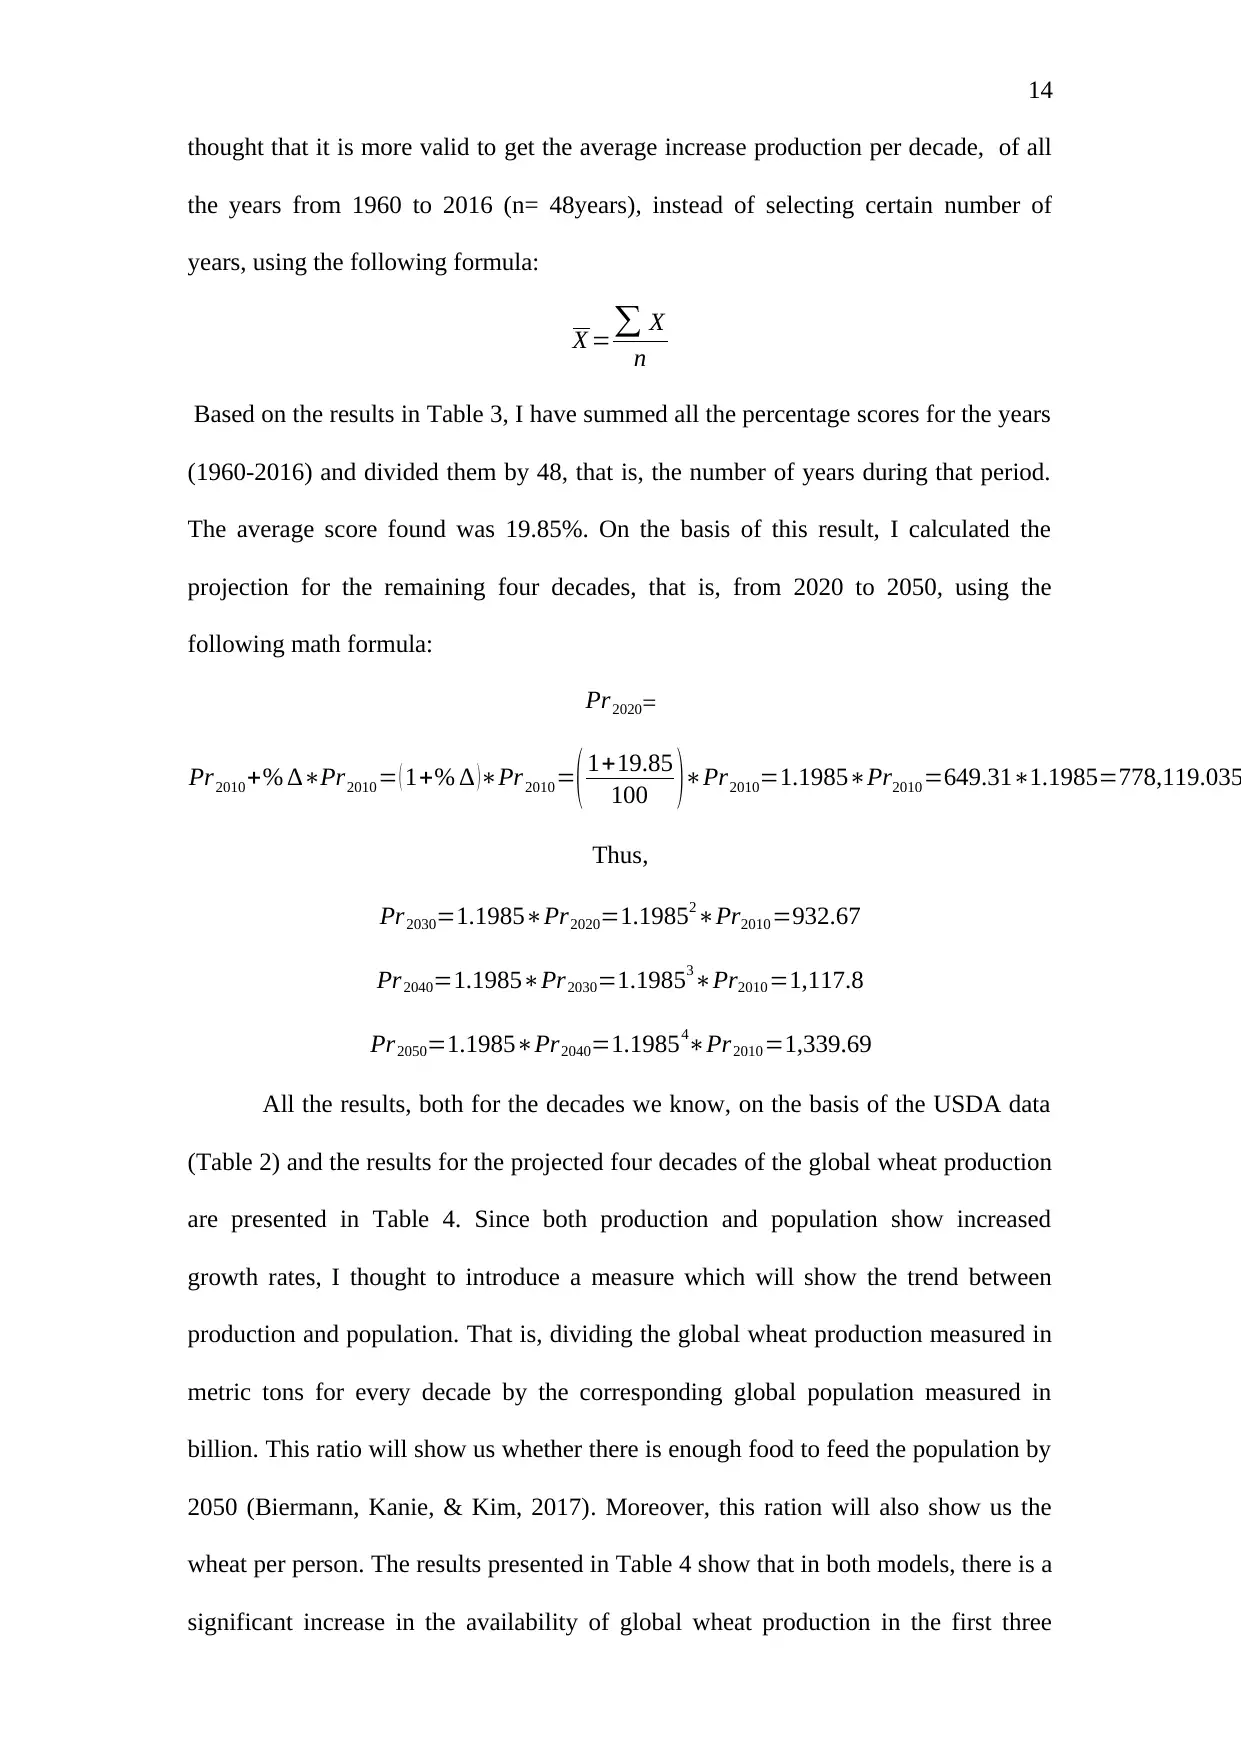
In order to make more visible the percentages of wheat production increase from 1960
to 2016, I have produced the following graph.
Figure 6. World wheat world production from 1960 to 2016
The reason why I chose per decade is because it is a faster way to forecast. Then, in
order to find out the wheat production growth for the remaining years up to 2050, I
%Δ (1966-1975) = 17.3% %Δ (1982-1991) = 15.0% %Δ (1998-2007) = 03.7%
%Δ (1967-1976) = 41.7% %Δ (1983-1992) = 16.1% %Δ (1999-2008) = 04.3%
%Δ (1968-1977) = 16.6% %Δ (1984-1993) = 09.8% %Δ (2000-2009) = 17.0%
%Δ (1969-1978) = 44.1% %Δ (1985-1994) = 05.6% %Δ (2001-2010) = 11.3%
%Δ (1970-1979) = 36.2% %Δ (1986-1995) = 02.4% %Δ (2002-2011) = 22.3%
%Δ (1971-1980) = 26.3% %Δ (1987-1996) = 16.4% %Δ (2003-2012) = 18.6%
%Δ (1972-1981) = 31.8% %Δ (1988-1997) = 23.2% %Δ (2004-2013) = 13.9%
%Δ (1973-1982) = 28.9% %Δ (1989-1998) = 10.6% %Δ (2005-2014) = 17.5%
%Δ (1974-1983) = 36.3% %Δ (1990-1999) = -0.2% %Δ (2006-2015) = 23.2%
%Δ (1975-1984) = 44.2% %Δ (1991-2000) = 07.4% %Δ (2007-2016) = 19.3%
In order to make more visible the percentages of wheat production increase from 1960
to 2016, I have produced the following graph.
Figure 6. World wheat world production from 1960 to 2016
The reason why I chose per decade is because it is a faster way to forecast. Then, in
order to find out the wheat production growth for the remaining years up to 2050, I
Paraphrase This Document
Need a fresh take? Get an instant paraphrase of this document with our AI Paraphraser
14
thought that it is more valid to get the average increase production per decade, of all
the years from 1960 to 2016 (n= 48years), instead of selecting certain number of
years, using the following formula:
X =∑ X
n
Based on the results in Table 3, I have summed all the percentage scores for the years
(1960-2016) and divided them by 48, that is, the number of years during that period.
The average score found was 19.85%. On the basis of this result, I calculated the
projection for the remaining four decades, that is, from 2020 to 2050, using the
following math formula:
Pr2020=
Pr2010+% ∆∗Pr2010= ( 1+% ∆ )∗Pr2010=( 1+19.85
100 )∗Pr2010=1.1985∗Pr2010=649.31∗1.1985=778,119.035
Thus,
Pr2030=1.1985∗Pr2020=1.19852∗Pr2010=932.67
Pr2040=1.1985∗Pr2030=1.19853∗Pr2010=1,117.8
Pr2050=1.1985∗Pr2040=1.19854∗Pr2010=1,339.69
All the results, both for the decades we know, on the basis of the USDA data
(Table 2) and the results for the projected four decades of the global wheat production
are presented in Table 4. Since both production and population show increased
growth rates, I thought to introduce a measure which will show the trend between
production and population. That is, dividing the global wheat production measured in
metric tons for every decade by the corresponding global population measured in
billion. This ratio will show us whether there is enough food to feed the population by
2050 (Biermann, Kanie, & Kim, 2017). Moreover, this ration will also show us the
wheat per person. The results presented in Table 4 show that in both models, there is a
significant increase in the availability of global wheat production in the first three
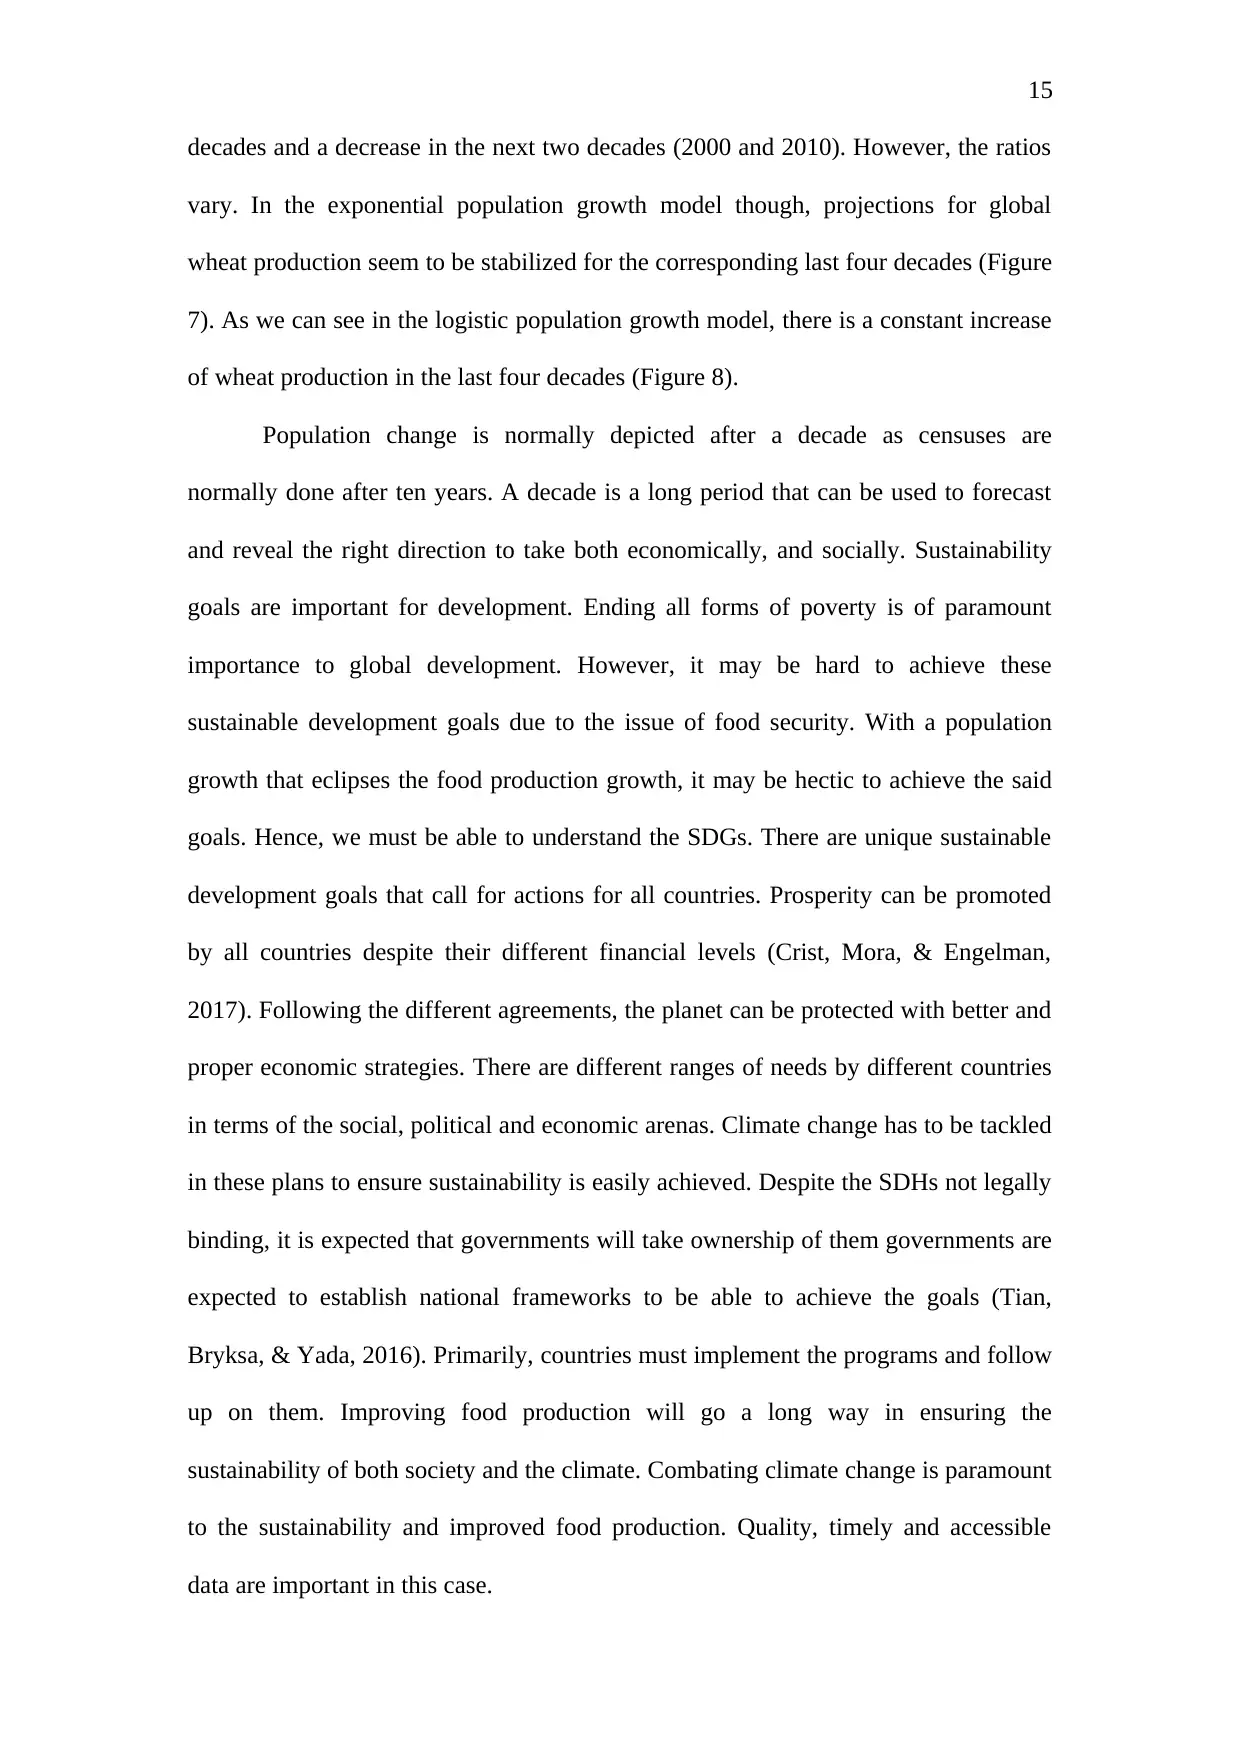
15
decades and a decrease in the next two decades (2000 and 2010). However, the ratios
vary. In the exponential population growth model though, projections for global
wheat production seem to be stabilized for the corresponding last four decades (Figure
7). As we can see in the logistic population growth model, there is a constant increase
of wheat production in the last four decades (Figure 8).
Population change is normally depicted after a decade as censuses are
normally done after ten years. A decade is a long period that can be used to forecast
and reveal the right direction to take both economically, and socially. Sustainability
goals are important for development. Ending all forms of poverty is of paramount
importance to global development. However, it may be hard to achieve these
sustainable development goals due to the issue of food security. With a population
growth that eclipses the food production growth, it may be hectic to achieve the said
goals. Hence, we must be able to understand the SDGs. There are unique sustainable
development goals that call for actions for all countries. Prosperity can be promoted
by all countries despite their different financial levels (Crist, Mora, & Engelman,
2017). Following the different agreements, the planet can be protected with better and
proper economic strategies. There are different ranges of needs by different countries
in terms of the social, political and economic arenas. Climate change has to be tackled
in these plans to ensure sustainability is easily achieved. Despite the SDHs not legally
binding, it is expected that governments will take ownership of them governments are
expected to establish national frameworks to be able to achieve the goals (Tian,
Bryksa, & Yada, 2016). Primarily, countries must implement the programs and follow
up on them. Improving food production will go a long way in ensuring the
sustainability of both society and the climate. Combating climate change is paramount
to the sustainability and improved food production. Quality, timely and accessible
data are important in this case.
16
Table 4: World wheat production by world population growth
YEAR
Exponential Population Growth Model Logistic Population Growth Model
Production Population Pr/Po Production Population Pr/Po
1960 233.451 3.04 76.8 233.451 2.99 78.1
1970 306.531 3.58 85.6 306.531 3.62 84.7
1980 435.867 4.22 103.2 435.867 4.31 101.1
1990 588.781 4.99 118.2 588.781 5.09 115.7
2000 583.284 5.87 99.4 583.284 5.22 98.5
2010 649.310 6.92 93.8 649.310 6.80 95.5
2020 778.2 8.17 95.3 778.2 7.69 101.2
2030 932.67 9.63 96.9 932.67 8.56 109
2040 1,117.8 11.35 98.5 1,117.8 9.4 118.9
2050 1,339.69 13.39 100.1 1,339.69 10.18 131.6
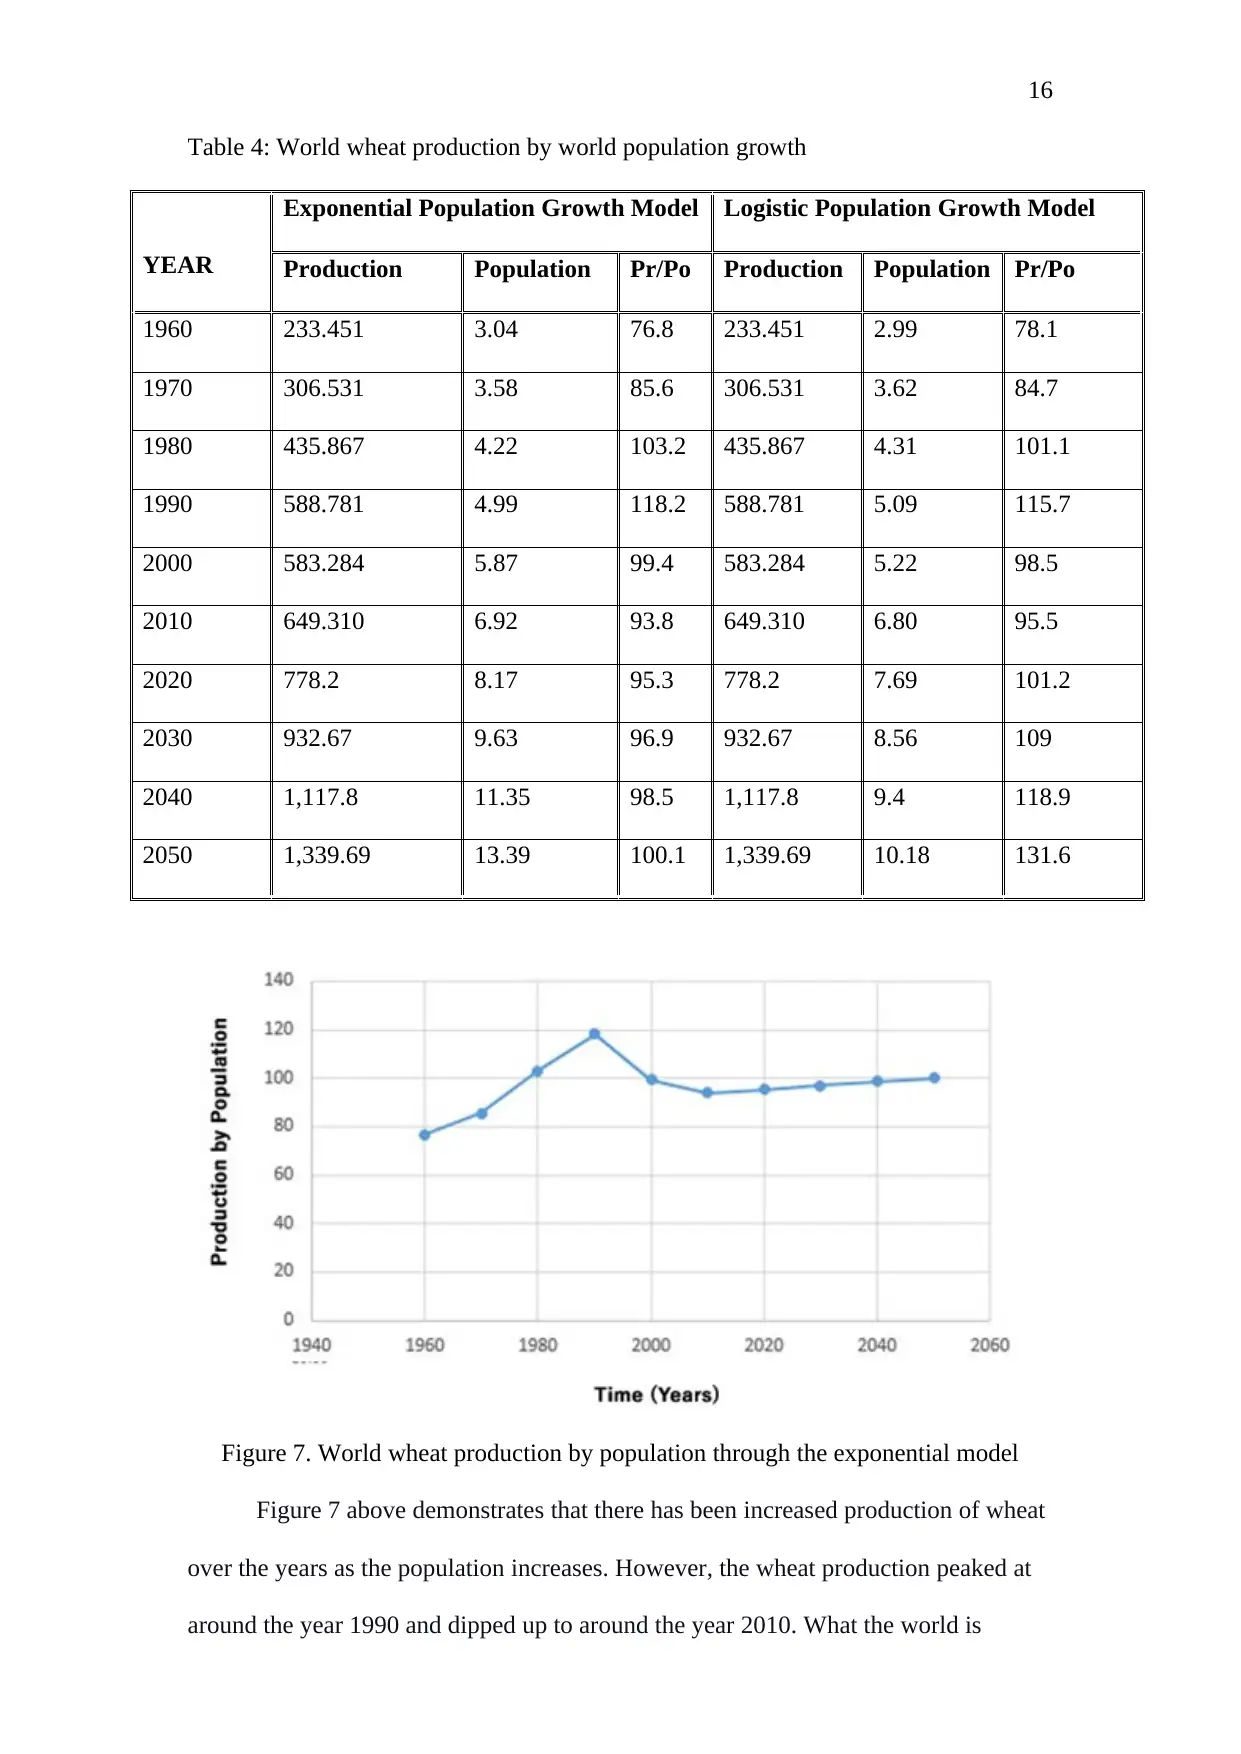
Figure 7. World wheat production by population through the exponential model
Figure 7 above demonstrates that there has been increased production of wheat
over the years as the population increases. However, the wheat production peaked at
around the year 1990 and dipped up to around the year 2010. What the world is
Table 4: World wheat production by world population growth
YEAR
Exponential Population Growth Model Logistic Population Growth Model
Production Population Pr/Po Production Population Pr/Po
1960 233.451 3.04 76.8 233.451 2.99 78.1
1970 306.531 3.58 85.6 306.531 3.62 84.7
1980 435.867 4.22 103.2 435.867 4.31 101.1
1990 588.781 4.99 118.2 588.781 5.09 115.7
2000 583.284 5.87 99.4 583.284 5.22 98.5
2010 649.310 6.92 93.8 649.310 6.80 95.5
2020 778.2 8.17 95.3 778.2 7.69 101.2
2030 932.67 9.63 96.9 932.67 8.56 109
2040 1,117.8 11.35 98.5 1,117.8 9.4 118.9
2050 1,339.69 13.39 100.1 1,339.69 10.18 131.6
Figure 7. World wheat production by population through the exponential model
Figure 7 above demonstrates that there has been increased production of wheat
over the years as the population increases. However, the wheat production peaked at
around the year 1990 and dipped up to around the year 2010. What the world is
Secure Best Marks with AI Grader
Need help grading? Try our AI Grader for instant feedback on your assignments.
17
experiencing is a slight shortage that has to be addressed through better methods of
food production and the use of technology. While the population has not reduced,
there have been fluctuations in food production that must be addressed urgently. The
current rate promises to be unsustainable at the end where we may have less than
enough food. While wondering whether food production can meet the population
growth, it is rather a puzzle as to whether we have reached peak farmland. Between
80% and 90% of the calorific requirements by humans comes directly from wheat,
corn and rice (Tian, Bryksa, & Yada, 2016). The same calorific requirement is
provided indirectly by livestock feeds. Hence, this serves to underline the importance
of wheat production to food security.
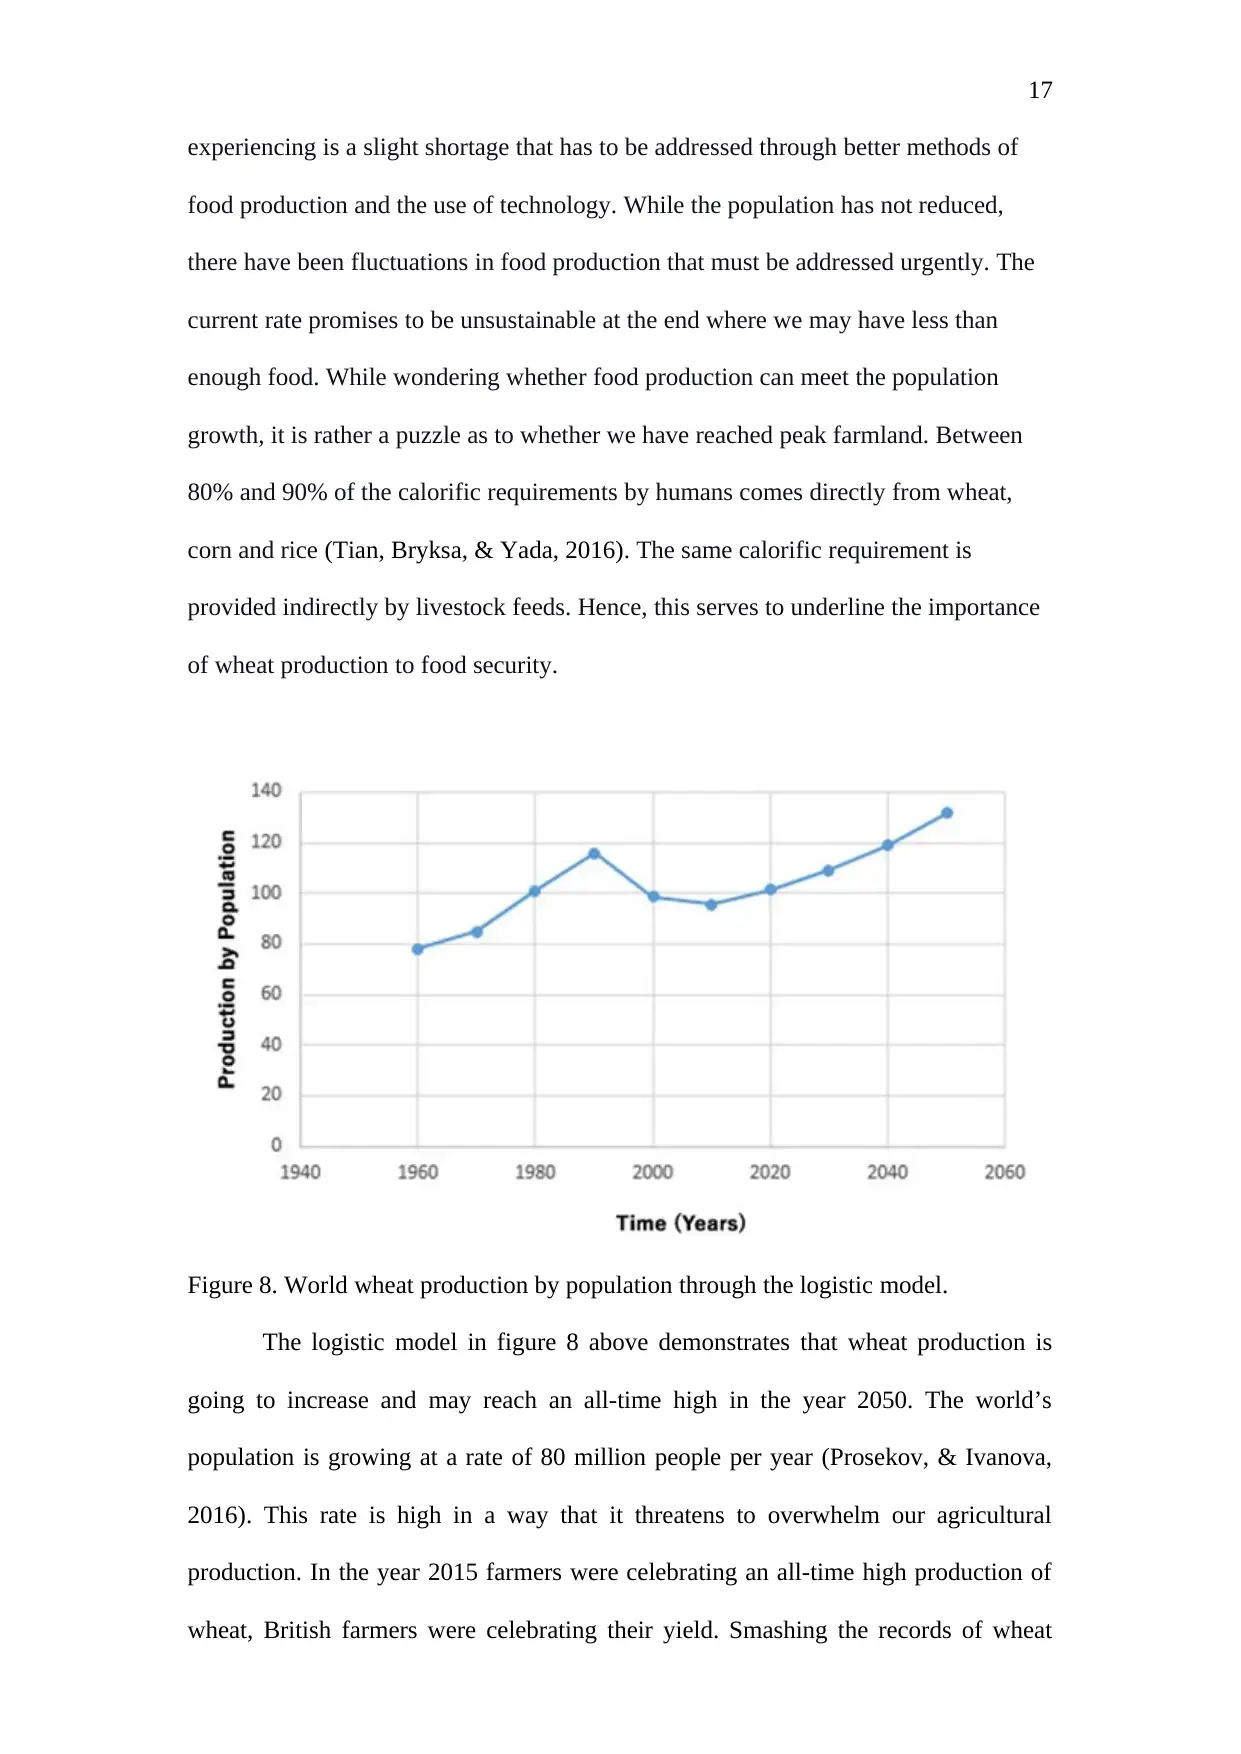
Figure 8. World wheat production by population through the logistic model.
The logistic model in figure 8 above demonstrates that wheat production is
going to increase and may reach an all-time high in the year 2050. The world’s
population is growing at a rate of 80 million people per year (Prosekov, & Ivanova,
2016). This rate is high in a way that it threatens to overwhelm our agricultural
production. In the year 2015 farmers were celebrating an all-time high production of
wheat, British farmers were celebrating their yield. Smashing the records of wheat
experiencing is a slight shortage that has to be addressed through better methods of
food production and the use of technology. While the population has not reduced,
there have been fluctuations in food production that must be addressed urgently. The
current rate promises to be unsustainable at the end where we may have less than
enough food. While wondering whether food production can meet the population
growth, it is rather a puzzle as to whether we have reached peak farmland. Between
80% and 90% of the calorific requirements by humans comes directly from wheat,
corn and rice (Tian, Bryksa, & Yada, 2016). The same calorific requirement is
provided indirectly by livestock feeds. Hence, this serves to underline the importance
of wheat production to food security.
Figure 8. World wheat production by population through the logistic model.
The logistic model in figure 8 above demonstrates that wheat production is
going to increase and may reach an all-time high in the year 2050. The world’s
population is growing at a rate of 80 million people per year (Prosekov, & Ivanova,
2016). This rate is high in a way that it threatens to overwhelm our agricultural
production. In the year 2015 farmers were celebrating an all-time high production of
wheat, British farmers were celebrating their yield. Smashing the records of wheat
18
production was an unprecedented level of success. There has been various prediction
by theorists that there would be great famines for the world to contend with. Famine
and diseases are interrelated. Some diseases such as malnutrition are attributed to food
availability (Dawson, Perryman, & Osborne, 2016). While farmers might be proud of
their work, there is a looming danger that we may soon reach a point that we are
unable to sustain our population growths using our current production rate. It is also
worth noting that food consumption depends on the area of the world. Americans
have been revealed to be eating the most amount of wheat in terms of calorific values.
It is estimated that if everyone in the world were to consume as high calorific values
from wheat as Americans then there will not be enough food on the planet.
The actions of the western world ought to be guided by the facts listed above.
If the meat consumption is halved and the waste and animal productions are recycled
better there will be enough to feed the world. This goes to the statement by the great
Indian revolutionary leader that the world has enough for the needs of everyone but
less than enough for the greed of everyone (Prosekov, & Ivanova, 2016). Hence, if we
are to take just enough for our requirements, things would certainly be different as
opposed to having less than enough due to our greedy actions. More forests will not
be destroyed and the biodiversity can be protected if we use what we produce
responsibly. Environmental conservation is paramount to our actions. Population
control can also be achieved by limiting the unwanted pregnancies of 75 million per
year (Dawson, Perryman, & Osborne, 2016). Population control through better family
planning tools and practices would only see the world’s population reaching 8.4
billion people by the year 2050 (Dawson, Perryman, & Osborne, 2016). The
population would then fall gradually and reduce the pressure that it has on the
resources. It has also been revealed that a life of austerity in terms of food production
19
would benefit future generations. The main benefit would be realized in the numbers
of lives saved from diet-related diseases every year.
Human beings have always found solutions to their problems. However,
restraining themselves from over-indulgence has been an issue to the world. Most
people do not understand fully the issues associated with climate change, inequality
and population growth. These inequalities are an impediment to the life on the planet.
Scholarly works have revealed that the fears on unsustainability can be averted. There
are close to a billion people who are malnourished (Dawson, Perryman, & Osborne,
2016). Climate change issues can lead to 50% of the world’s farmland unsuitable to
agriculture. Agriculture releases up to 33% of the greenhouse gases to the
environment and also contribute to climate change. The release of
chlorofluorocarbons and chemicals used in agriculture affect the environment
negatively.
Climate changes can also lead to disasters such as famine and unsustainability
that have long been predicted by famous theorists. If we continue with our current
practices we will soon be unable to sustain the population using our current food
production methods (Nilsson, Griggs, & Visbeck, 2016). The main issue would be the
stubbornness of the western world to adopt austerity measures and limit their calorific
consumption. The addiction to luxuries such as power and meat are posing serious
threats to the levels of food production and the requirement for the world (Prosekov,
& Ivanova, 2016). The calorific values of certain food products especially from
animals are very high when compared to grains. The land that is used by biofuels will
increase four times by the year 2030. Hence, this poses serious threats to the
sustainability of the planet. If the human practices regarding consumption of food
change the impacts that we have on the planet.
4. Discussion and conclusion
Paraphrase This Document
Need a fresh take? Get an instant paraphrase of this document with our AI Paraphraser
20
These results indicate that the world population, provided that there will be no
changes due to climate, is not going to face lack of food as far as wheat production is
concerned, at the global level. However, we can assume that populations in the
geographic areas of developing countries, where most of the population growth will
take place, will probably be challenged for future food availability. FAO (2009)
argues that nearly all of this growth is forecast to take place in the developing
countries. Among the latter group, sub-Saharan Africa’s population would grow the
fastest (+114%) and East and Southeast Asia’s the slowest (+13%). The world
population growth, according to the logistic model, is expected to reach 10.18 by the
year 2050. This is a much slower rate of growth than the one seen in the past four
decades. As pointed earlier, this is a more realistic prediction, taking also into account
other predictions, than the 13.39 billion predicted by the exponential growth model.
There is a great interaction between the human population and biodiversity.
The depletion of the biodiversity is inherently dependent on population growth. As
the human population increases, they tend to clear the biodiversity for settlement.
This, in turn, leads to an imbalance in nature (Tyczewska, Woźniak, Gracz,
Kuczyński, Twardowski, 2018). The shortages in food production to feed the
increased population are due to human activities. Population growth forecasts have
revealed that by the year 2050, the world’s population may be unsustainable if we do
not improve our food production. The population of a country such as India is deemed
to double by the year 2100 based on the current growth projections. Hence, we are
either supposed to work on the population and control its growth or look for ways to
boost the production of food. It has been established that 70% of the world’s
freshwater is used in irrigating crops and other forms of agriculture (Tian, Bryksa, &
Yada, 2016). This may not be tenable in the long run due to careless human activities
such as environmental pollution. Waste management should be effected to reduce the
21
depletion of freshwater supply for agricultural use. The toxins from the wastes that are
released to the water bodies find their way to the food that we consume. The end
result is toxic foods that threaten the lives of many people.
On the other hand, with a lack of freshwater, there are millions of people who
are malnourished. The malnourished people have been estimated to be around 850
million in the world. We need to adopt mechanisms that seek to promote equality and
sustainability in the world. Experts agree that if the different sectors in food
production work accordingly the world may not experience problems in the food
sector (Tian, Bryksa, & Yada, 2016). We may be able to feed everyone if the
necessary changes are taken. Embracing technology in the sector of food production
will boost the yield and reduce the pressure on the available food. We will also not
have to clear more forest lands for food production as we will be able to take care of
the food shortage. Farming strategies will have to be adjusted and made more
appealing so that many people practice them. In this way, there will be enough
supplies to cater for the needs of a large population.
Better tasting food, improved access to animal-sourced foods, and economic
opportunities are some of the sustainable development goals that can be done
effectively to boost the sector of food production. Farmers have to breed food that
tastes better by improving the diversity in the aroma present in the food (Hák,
Janoušková, & Moldan, 2016). Hence, people would be drawn to eat such foods and
ease the pressure on some other foodstuffs that are being depleted. The food products
will also assist the industry in meeting the food demands of the growing population.
Feeding the world should not just be centred on meeting the calorific values
(Tyczewska, Woźniak, Gracz, Kuczyński, Twardowski, 2018). Feeding the world
should also be centred on providing a balanced diet for the masses. Parts of the SDG1
and SDG2 agreed by nations in their plans to eradicate poverty by the year 2030 were
22
meant to improve the economic wellbeing of the society. In this way, people will be
able to afford and access food easily. Economic disparities limit the accessibility of
food by some populations.
Thinking optimistically, the growing population can be fed, both in developed
and developing countries provided the right actions are taken. Such actions could be
to keep the projected global wheat productivity growth as well as food production in
the agricultural sector in an environmentally and socially sustainable manner. The
challenge is to make the world a better place to live with no hunger and poverty, and
reach the goals set for SDG1 and SDG2 (Bebbington, & Unerman, 2018). However,
predicting population growth and its impact on food availability has its own
limitations. Many social, economic, natural and political factors influence population
growth and its impact on food availability, which cannot be controllable and even
unknown. These may include climate change, fertility and mortality rates, natural
disasters, etc.
Secure Best Marks with AI Grader
Need help grading? Try our AI Grader for instant feedback on your assignments.
23
References
Bebbington, J., & Unerman, J. (2018). Achieving the United Nations sustainable
development goals. Accounting, Auditing & Accountability Journal. Retrieved
from:
https://eprints.lancs.ac.uk/id/eprint/127039/1/Bebbington_and_Unerman_ACC
EPTED_AAAJ_Achieving_the_United_Nations_Sustainable_Development_G
oals_An_enabling_role_for_accounting_research.PDF
Biermann, F., Kanie, N., & Kim, R. E. (2017). Global governance by goal-setting: the
novel approach of the UN Sustainable Development Goals. Current Opinion
in Environmental Sustainability, 26, 26-31. Retrieved from:
https://www.researchgate.net/profile/Frank_Biermann/publication/314654074
_Global_governance_by_goal-
setting_the_novel_approach_of_the_UN_Sustainable_Development_Goals/
links/5a1c37320f7e9bd1be5c5344/Global-governance-by-goal-setting-the-
novel-approach-of-the-UN-Sustainable-Development-Goals.pdf
Crist, E., Mora, C., & Engelman, R. (2017). The interaction of human population,
food production, and biodiversity protection. Science, 356(6335), 260-264.
Retrieved from:
http://population.org.il/wordpress/wp-content/uploads/2018/06/Crist-et-al.-
2017.-The-interaction-of-human-population-food-production-and-
biodiversity-protection-_-Science.pdf
24
Dawson, T. P., Perryman, A. H., & Osborne, T. M. (2016). Modelling impacts of
climate change on global food security. Climatic Change, 134(3), 429-440.
Retrieved from:
https://www.researchgate.net/profile/Terence_Dawson2/publication/28482576
9_Modelling_impacts_of_climate_change_on_global_food_security/links/
565c782a08ae1ef92981e471/Modelling-impacts-of-climate-change-on-global-
food-security.pdf
FAO (2007). Coping with water scarcity - Challenge of the twenty-first century.
Available at http://www.fao.org/nr/water/docs/escarcity.pdf
FAO (2009). Global agriculture towards 2050. Available at
http://www.fao.org/fileadmin/templates/wsfs/docs/Issues_papers/HLEF2050_
Global_Agriculture.pdf.
FAO (2016). Save and Grow in practice maize, rice, wheat. A Guide to Sustainable
Cereal Production. Rome: FAO. Available at http://www.fao.org/3/a-
i4009e.pdf.
Hák, T., Janoušková, S., & Moldan, B. (2016). Sustainable Development Goals: A
need for relevant indicators. Ecological Indicators, 60, 565-573. Retrieved
from:
http://eclass.teiion.gr/modules/document/file.php/DE-DE305/Hak_Moldan_Ja
nouskova_SD_Indicators_2016.pdf
Hathout, D. (2013). Modelling ppopulation growth: Exponential and hyperbolic
modelling. Applied Mathematics, 4, 299-304. Available at
http://dx.doi.org/10.4236/am.2013.42045 (http://www.scirp.org/journal/am)
Hillen, T. (2016). Applications and limitations of the Verhulst model for populations.
Available at https://www.math.ualberta.ca/pi/issue6/page19-20.pdf
25
Nilsson, M., Griggs, D., & Visbeck, M. (2016). Policy: map the interactions between
Sustainable Development Goals. Nature, 534(7607), 320-322. Retrieved from:
https://www.nature.com/articles/534320a
Prosekov, A. Y., & Ivanova, S. A. (2016). Providing food security in the existing
tendencies of population growth and political and economic instability in the
world. Foods and raw materials, 4(2). Retrieved from:
https://cyberleninka.ru/article/n/16944876
Rohr, J. R., Barrett, C. B., Civitello, D. J., Craft, M. E., Delius, B., DeLeo, G. A., ... &
Remais, J. V. (2019). Emerging human infectious diseases and the links to
global food production. Nature Sustainability, 2(6), 445-456. Retrieved from:
https://edisciplinas.usp.br/pluginfile.php/4926535/mod_resource/content/
1/2019Rohretal.NatureSustainability.pdf
Rutherford, J. (2009). Environmental systems and societies: Course companion.
Oxford: Oxford University Press.
Tian, J., Bryksa, B. C., & Yada, R. Y. (2016). Feeding the world into the future–food
and nutrition security: the role of food science and technology. Frontiers in
Life Science, 9(3), 155-166. Retrieved from:
https://www.tandfonline.com/doi/full/10.1080/21553769.2016.1174958
Tyczewska, A., Woźniak, E., Gracz, J., Kuczyński, J., & Twardowski, T. (2018).
Towards food security: current state and future prospects of
agrobiotechnology. Trends in biotechnology, 36(12), 1219-1229. Retrieved
from: https://www.sciencedirect.com/science/article/pii/S0167779918301999
UN (2014). World’s population increasingly urban with more than half living in urban
areas. Available at http://www.un.org/en/development/desa/news/population/
world-urbanization-prospects-2014.html
Paraphrase This Document
Need a fresh take? Get an instant paraphrase of this document with our AI Paraphraser
26
UNICEF (2015). The state of the world's children. Executive summary re-imagines
the future Innovation for every child. Retrieved from
http://www.unicef.org/publications/files/SOWC_2015_Summary_and_Tables.
pdf
United Nations (2015). World population prospects: The 2015 revision, key findings
and advance tables. Working Paper No. ESA/P/WP.241. Department of
Economic and Social Affairs, Population Division. Available at
https://esa.un.org/unpd/wpp/Publications/Files/ Key_Findings_WPP_2015.pdf
UNICEF (2015). The state of the world's children. Executive summary re-imagines
the future Innovation for every child. Retrieved from
http://www.unicef.org/publications/files/SOWC_2015_Summary_and_Tables.
United Nations (2015). World population prospects: The 2015 revision, key findings
and advance tables. Working Paper No. ESA/P/WP.241. Department of
Economic and Social Affairs, Population Division. Available at
https://esa.un.org/unpd/wpp/Publications/Files/ Key_Findings_WPP_2015.pdf
1 out of 26
Related Documents


Your All-in-One AI-Powered Toolkit for Academic Success.
+13062052269
info@desklib.com
Available 24*7 on WhatsApp / Email
![[object Object]](/_next/static/media/star-bottom.7253800d.svg)
Unlock your academic potential
© 2024 | Zucol Services PVT LTD | All rights reserved.