Study of Consumption of Wheat and Products over the World: Real Time Analytics
Added on 2023-06-11
18 Pages4359 Words133 Views
Study of Consumption of Wheat and products over the World: A
real time analytics
Introduction
World population growing continuously, so finding the solution for feeding the
growing world population becomes the major concern for many academics, entrepreneurs and
food and agricultural organizations. There are foods that are highly demanded such as meat,
rice, wheat, fruits, milk etc. Wheat and products and Meat are the most demanded food for
human. For providing the meat, we need to produce animals for meat products. This animals
such as goat, pig, hens required wheat and products for feeding.
In this study, we concentrate on consumption of wheat and products for human and
for animals. Many authors studied the chemical properties of wheat and products including
Hashimoto, et al. (1998), Bonafaccia,et al. (2000), Kohler and Palter (1967), Zook et al.
(1970), Simonato et al. (2001).
Gooding and Davies (1997) explained the wheat production and its utilization. Garde
et al. (2002) studied the lactic acid production from wheat.
Research Question:
We have mainly focused on the following question:
i) How much wheat and products (food) consumed?
ii) How much wheat and products (feed) consumed?
iii) Which countries or territory consume more wheat and products (food)?
iv) Which countries or territory consume more wheat and products (feed)?
v) What is consumption of wheat and products per capita (in Kg) for the year 2013?
vi) What is consumption of wheat and products according to the population density for
the year 2013?
vii) What will be the total wheat and products consumption for the 2050?
Data Collection:
We have collected the data from The Food and Agriculture Organization (FAO) of the
United Nations. (Data Collection Website: http://www.fao.org/faostat/en/#home). FAO gives
the free access for the data of 245 countries and territories starting from 1961 to 2013. This
data includes 115 items for feed and food whichever applicable. Feed and food can refereed
as follows:
Feed : Quantity of feed available for feeding the animals and
Food : Total amount of food available for human.
We have also used population total and population density collected from
http://www.worldbank.org/. We consider wheat product for our study. Following Table 1
shows the total consumption of wheat and products (food and feed) for some selected years.
From Table 1, we claim that there is 769% increase in the consumption of wheat and
products (feed) from 1961 to 2013 whereas there is 269% increase in the consumption of
wheat and products (feed) from 1961 to 2013. We can observed there is increasing trend for
the consumption of wheat and products.
Table 1: Total consumption of Wheat and products (food and feed) (1000 tonnes) for
some selected years
Year Feed Food Total
1961 14914 123915 138829
1971 35083 166700 201783
1981 36688 246694 283382
1991 55730 324994 380724
2001 110852 416419 527271
2002 106095 416878 522973
2003 89570 414881 504451
2004 109362 418032 527394
2005 111417 420846 532263
2006 109264 428015 537279
2007 99005 430266 529271
2008 129721 432518 562239
2009 122600 434645 557245
2010 106482 443444 549926
2011 132803 445376 578179
2012 128091 448506 576597
2013 129668 457824 587492
In the Table 2 we have reported the top 15 countries in the consumption of wheat and
products (feed) according to year 2013 along with consumption of wheat and products (feed)
for some selected years. We can see that China, mainland is on the top for the consumption of
wheat and products (feed), Russian Federation is at second place and France is at the third
place. Australia is on the 13th place for the consumption of wheat and products (feed).
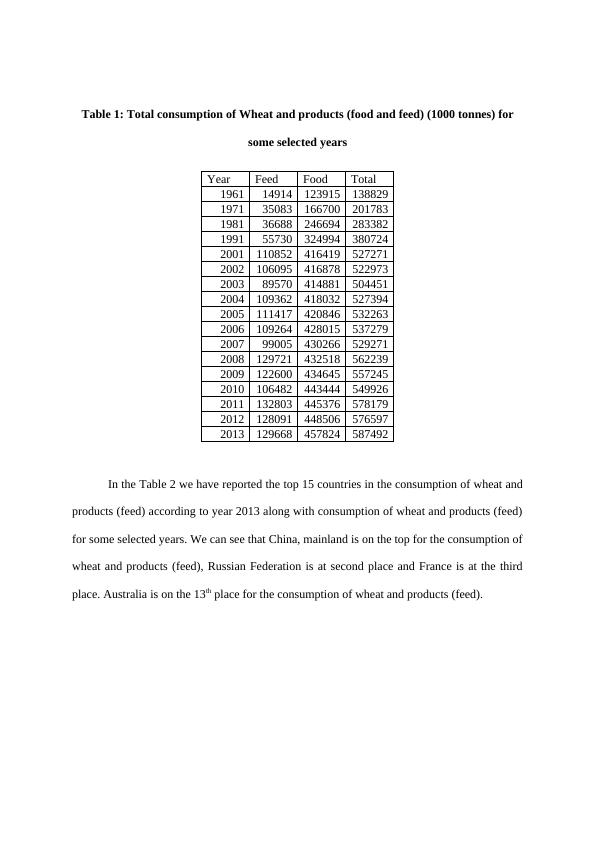
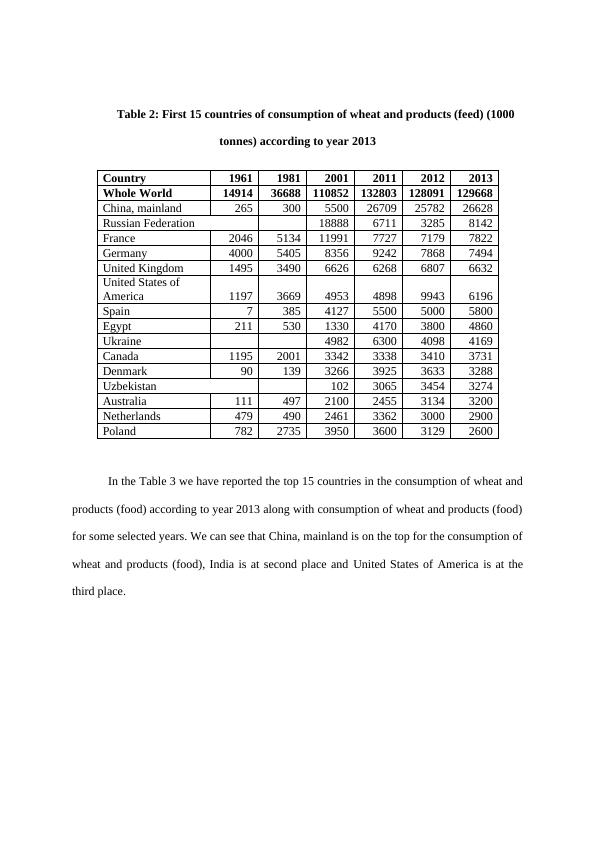
Table 2: First 15 countries of consumption of wheat and products (feed) (1000
tonnes) according to year 2013
Country 1961 1981 2001 2011 2012 2013
Whole World 14914 36688 110852 132803 128091 129668
China, mainland 265 300 5500 26709 25782 26628
Russian Federation 18888 6711 3285 8142
France 2046 5134 11991 7727 7179 7822
Germany 4000 5405 8356 9242 7868 7494
United Kingdom 1495 3490 6626 6268 6807 6632
United States of
America 1197 3669 4953 4898 9943 6196
Spain 7 385 4127 5500 5000 5800
Egypt 211 530 1330 4170 3800 4860
Ukraine 4982 6300 4098 4169
Canada 1195 2001 3342 3338 3410 3731
Denmark 90 139 3266 3925 3633 3288
Uzbekistan 102 3065 3454 3274
Australia 111 497 2100 2455 3134 3200
Netherlands 479 490 2461 3362 3000 2900
Poland 782 2735 3950 3600 3129 2600
In the Table 3 we have reported the top 15 countries in the consumption of wheat and
products (food) according to year 2013 along with consumption of wheat and products (food)
for some selected years. We can see that China, mainland is on the top for the consumption of
wheat and products (food), India is at second place and United States of America is at the
third place.
End of preview
Want to access all the pages? Upload your documents or become a member.
Related Documents
Consumption of Meat over the World - PDFlg...
|22
|4688
|14
Real World Analytics - Assignmentlg...
|12
|2380
|59
Real Time Analytics for Global Food Consulting Firmlg...
|17
|4264
|334
Statistics and Business research Methodlg...
|14
|2609
|40
Real Time Analytics for Food Production and Consumptionlg...
|16
|2525
|177
Ecological and sustainable aspects of animal productionlg...
|6
|1300
|279