Linear Predictability Through A Linear Relationship
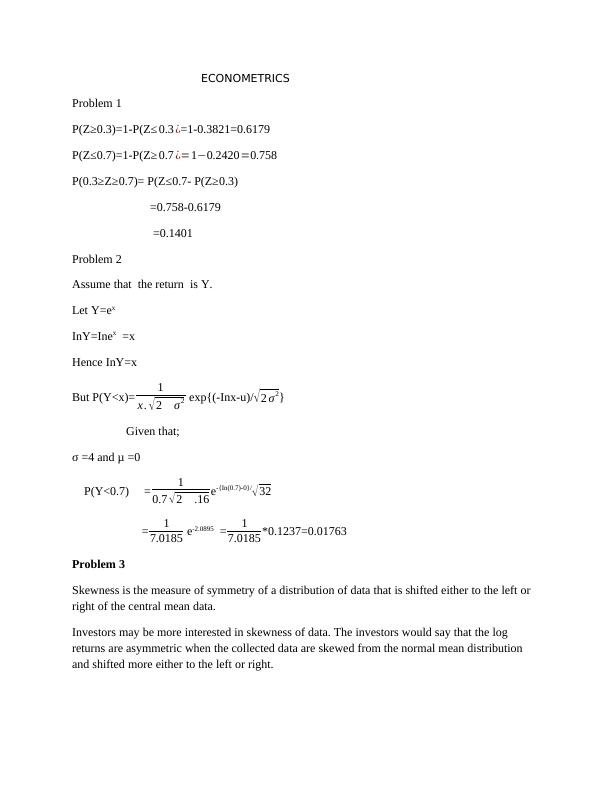
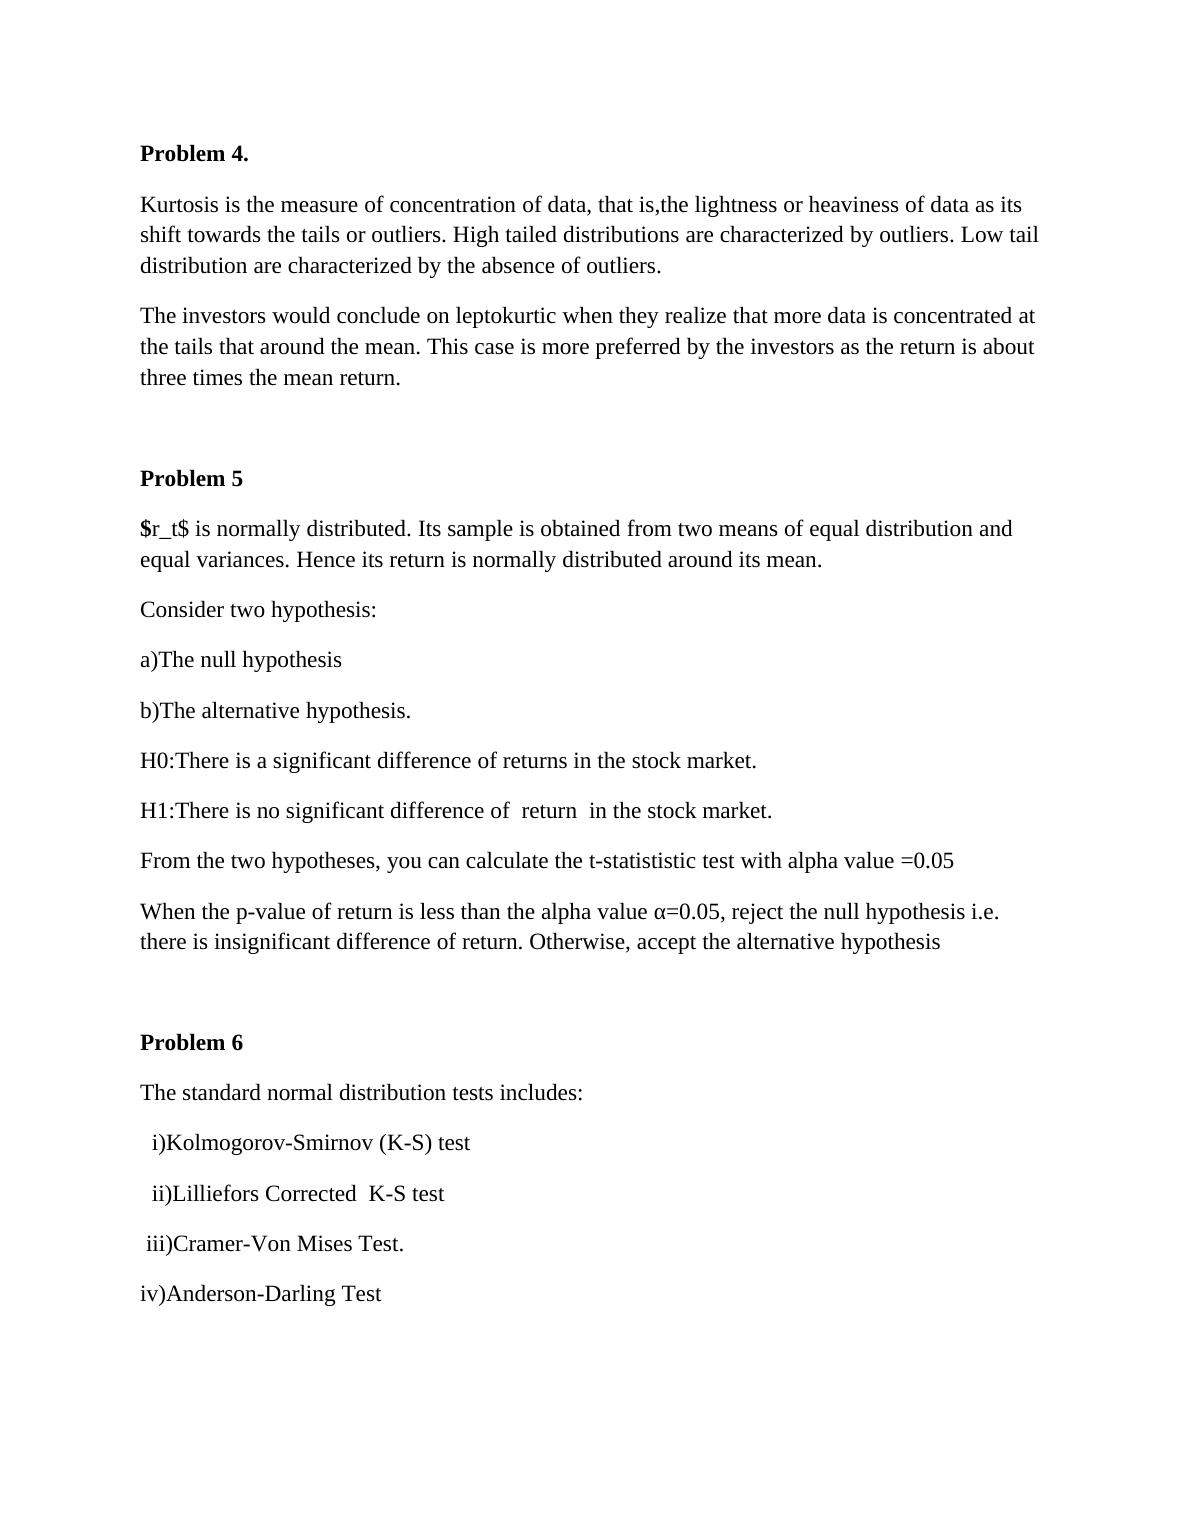
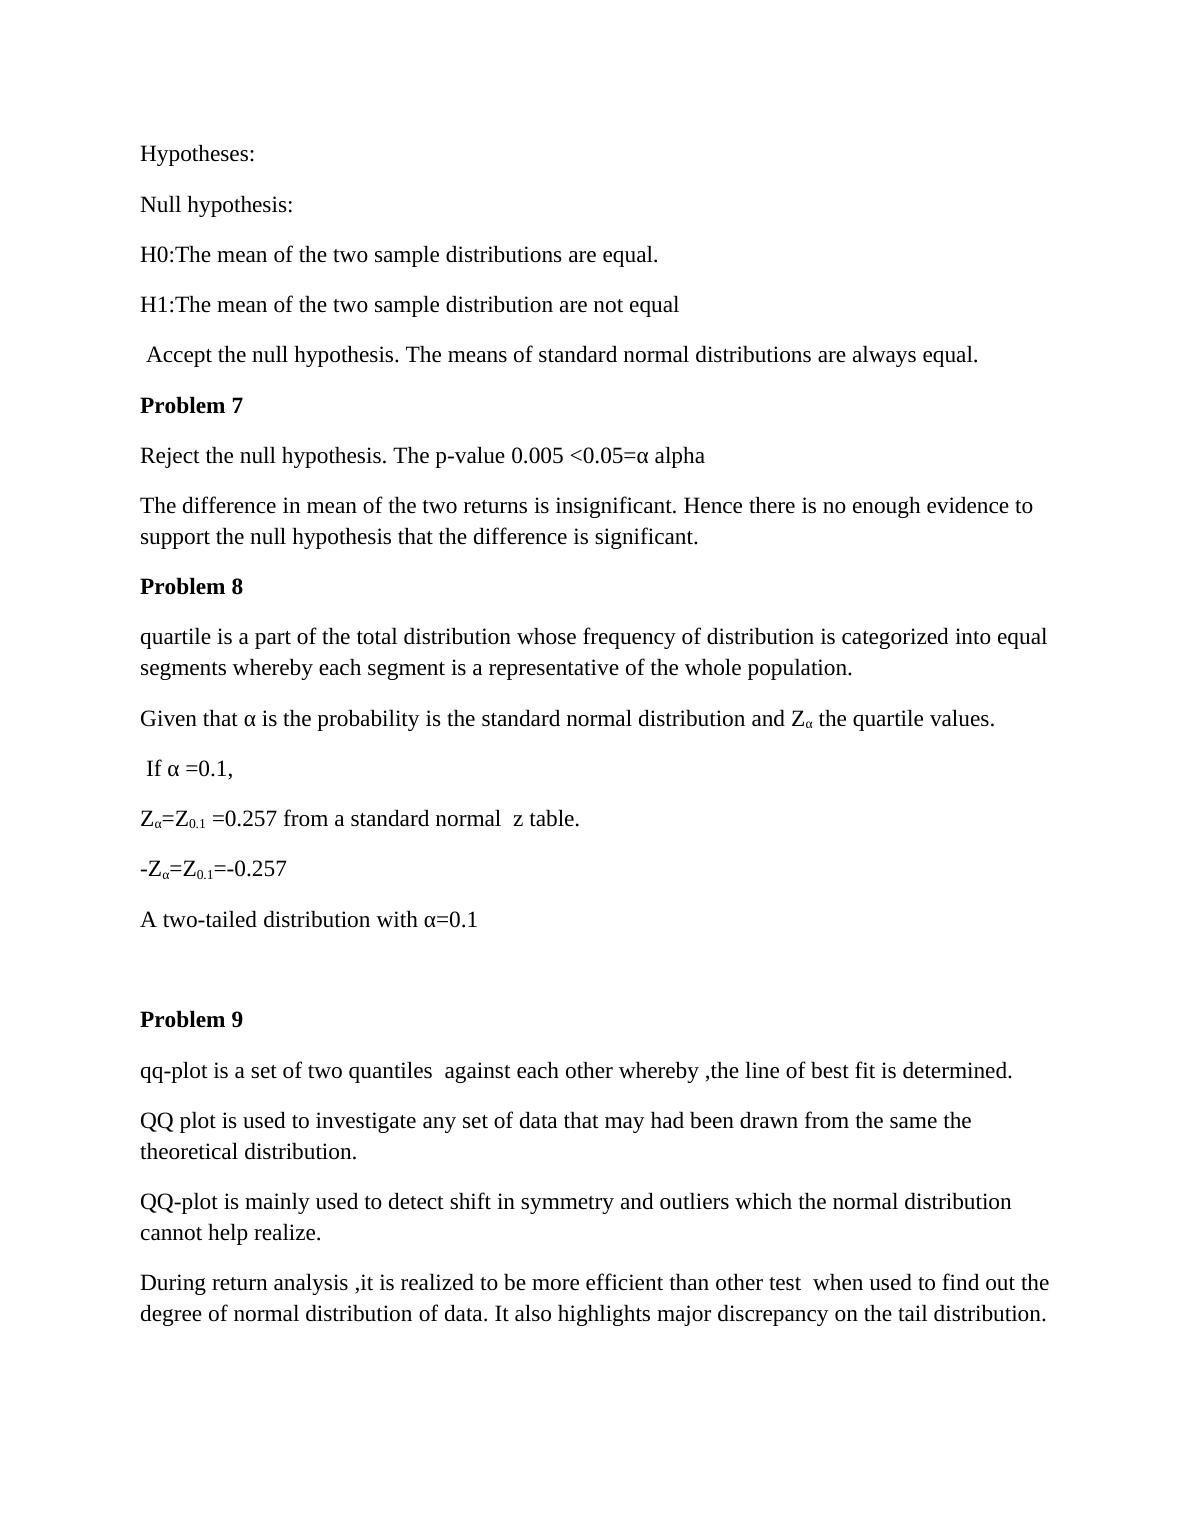
Revision questions on probability, skewness, kurtosis, normality of returns, quantiles, and qq-plots in econometrics.
9 Pages1890 Words24 Views
Added on 2022-09-02
Linear Predictability Through A Linear Relationship
Revision questions on probability, skewness, kurtosis, normality of returns, quantiles, and qq-plots in econometrics.
Added on 2022-09-02
ShareRelated Documents
End of preview
Want to access all the pages? Upload your documents or become a member.
Statistics - Assignment (Solution)
|7
|703
|137
Test for Difference in Variability in Waiting Times in Bank 1 and Bank 2
|5
|708
|36
STAT 2040 DE Data Analysis Assignment
|11
|1067
|96
Frequency Distribution - PDF
|8
|759
|133
Statistics: Examination Scores, Sample Size, ANOVA, Regression Model
|9
|598
|256
Quantitative Methods: Confidence Interval and Estimators
|6
|525
|231