logo

Test for Difference in Variability in Waiting Times in Bank 1 and Bank 2

5 Pages708 Words36 Views
   

Added on  2023-01-17

About This Document

This article discusses the test for a difference in variability in waiting times in bank 1 and bank 2 using independent samples t-test. It also explores the test for the differences in mean earnings between 1996 and 1997.

Test for Difference in Variability in Waiting Times in Bank 1 and Bank 2

   Added on 2023-01-17

ShareRelated Documents
Statistics
Statistics:
Student name:
Instructor:
1 | P a g e
Test for Difference in Variability in Waiting Times in Bank 1 and Bank 2_1
Statistics
PROBLEM ONE
Test for a difference in variability in waiting times in bank 1 and bank 2
The test employed independent samples t-test to establish whether the two variances were
different
Hypothesis
H0: Variability in waiting time in bank 1 and bank 2 are the same.
Versus
H1: There is a difference in variability in waiting time in bank 1 and bank 2.
The test was conducted at α = 0.05
Table of results
Independent Samples Test
Levene's Test for
Equality of Variances
t-test for Equality of Means
F Sig. t df Sig. (2-
tailed)
Mean
Difference
Std. Error
Difference
95% Confidence
Interval of the
Difference
Lower Upper
time
Equal variances
assumed
2.058 .162 -4.126 28 .000 -2.82400 .68439 -
4.22591
-1.42209
Equal variances
not assumed
-4.126 26.54
5
.000 -2.82400 .68439 -
4.22938
-1.41862
Table 1
In making decision for this test, we are going to depend on the p-value computed under the
lavene’s test column. This value is compared with the alpha value. As can be observed from
table 1 above, the p-value calculated is 0.16. It is greater than the alpha value (0.05). The null
2 | P a g e
Test for Difference in Variability in Waiting Times in Bank 1 and Bank 2_2

End of preview

Want to access all the pages? Upload your documents or become a member.

Related Documents
Statistics Study Material
|11
|1820
|99

Statistics and Probability Questions 2022
|11
|1101
|23

Mean and standard deviation
|8
|1007
|24

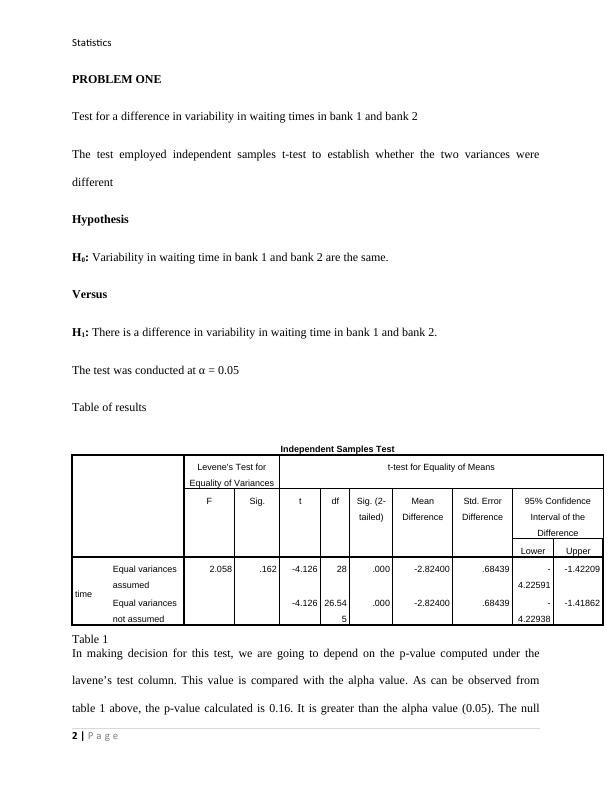
Statistics. Statistics Student name: Tutor name:. 1|Pag
|4
|455
|86

Homework 4 (Individual Exercise)
|7
|1226
|81

Linear Predictability Through A Linear Relationship
|9
|1890
|24