Accounting and Finance : Assignment Solved
Added on 2021-06-18
19 Pages3429 Words13 Views
RUNNING HEAD: ACCOUNTING AND FINANCE
Accounting and Finance
Accounting and Finance
Accounting and finance 2
Question 1
Part A
Analysis of financial position – ratio analysis
Financial ratios
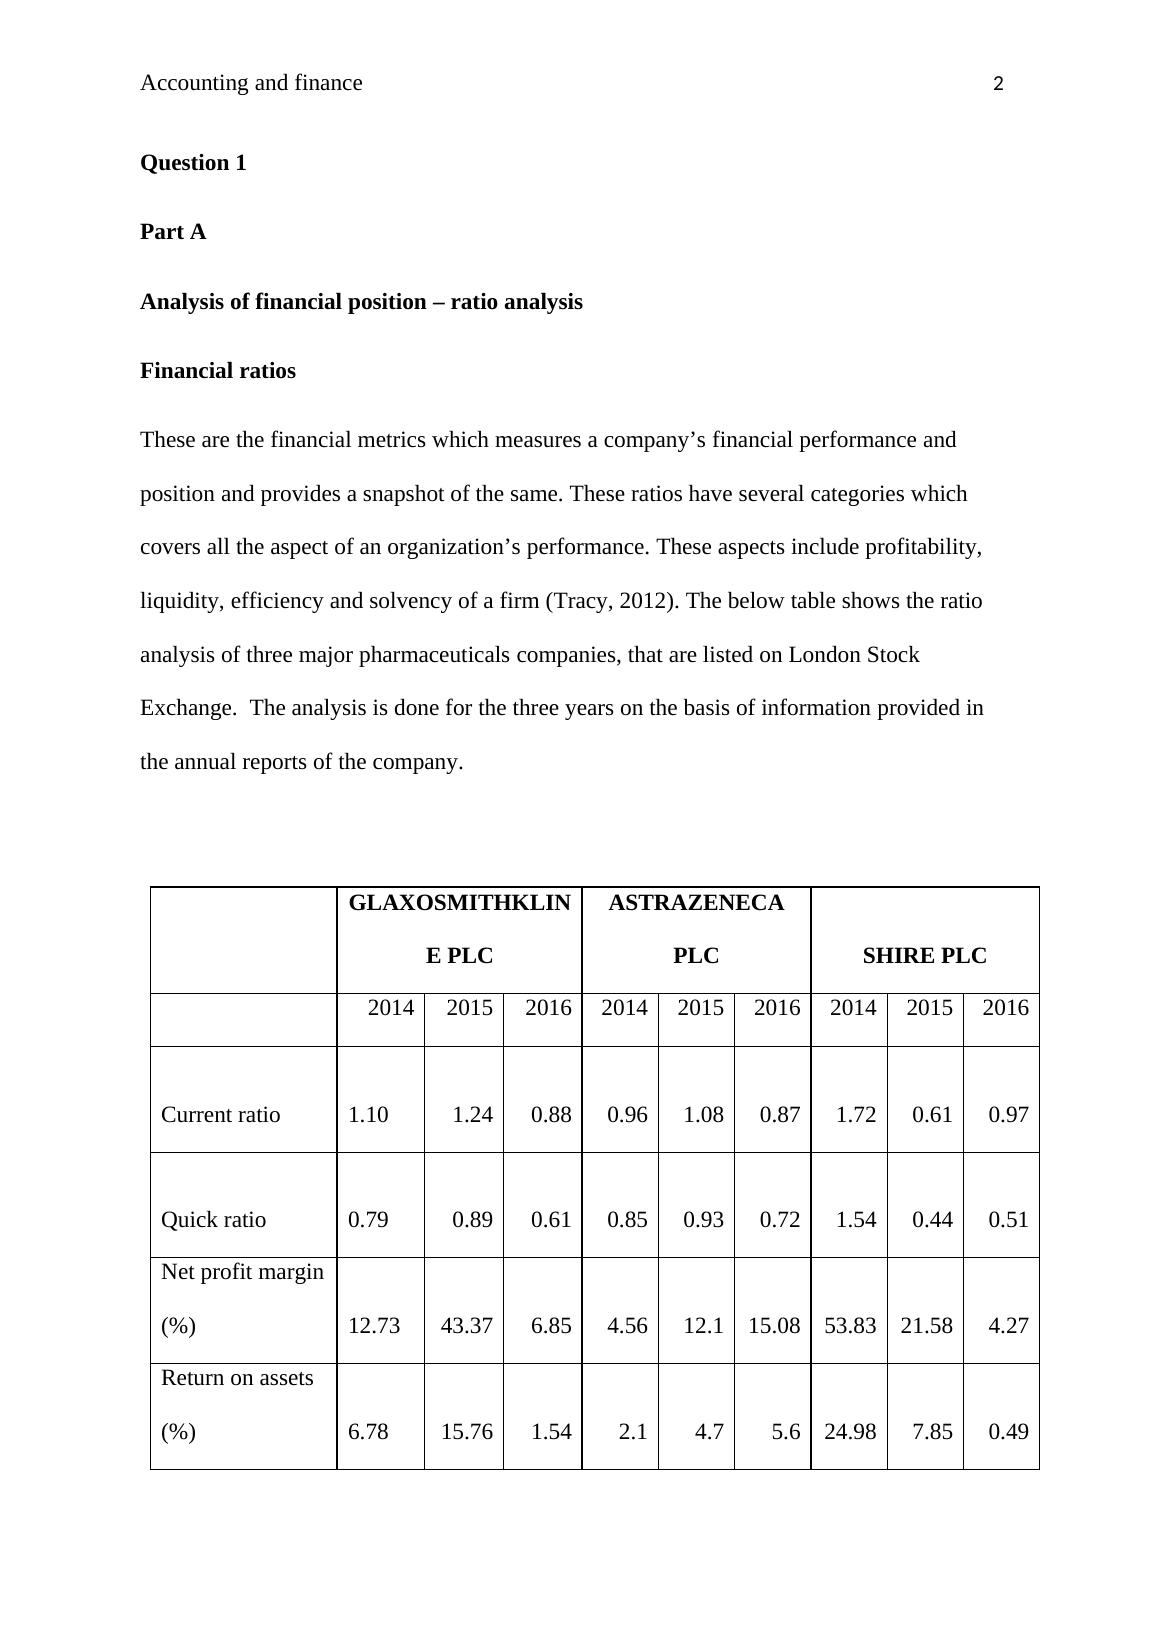
These are the financial metrics which measures a company’s financial performance and
position and provides a snapshot of the same. These ratios have several categories which
covers all the aspect of an organization’s performance. These aspects include profitability,
liquidity, efficiency and solvency of a firm (Tracy, 2012). The below table shows the ratio
analysis of three major pharmaceuticals companies, that are listed on London Stock
Exchange. The analysis is done for the three years on the basis of information provided in
the annual reports of the company.
GLAXOSMITHKLIN
E PLC
ASTRAZENECA
PLC SHIRE PLC
2014 2015 2016 2014 2015 2016 2014 2015 2016
Current ratio 1.10 1.24 0.88 0.96 1.08 0.87 1.72 0.61 0.97
Quick ratio 0.79 0.89 0.61 0.85 0.93 0.72 1.54 0.44 0.51
Net profit margin
(%) 12.73 43.37 6.85 4.56 12.1 15.08 53.83 21.58 4.27
Return on assets
(%) 6.78 15.76 1.54 2.1 4.7 5.6 24.98 7.85 0.49
Return on equity 94.86 18.38 6.28 15.26 20.99 39.31 13.26 1.13
Question 1
Part A
Analysis of financial position – ratio analysis
Financial ratios
These are the financial metrics which measures a company’s financial performance and
position and provides a snapshot of the same. These ratios have several categories which
covers all the aspect of an organization’s performance. These aspects include profitability,
liquidity, efficiency and solvency of a firm (Tracy, 2012). The below table shows the ratio
analysis of three major pharmaceuticals companies, that are listed on London Stock
Exchange. The analysis is done for the three years on the basis of information provided in
the annual reports of the company.
GLAXOSMITHKLIN
E PLC
ASTRAZENECA
PLC SHIRE PLC
2014 2015 2016 2014 2015 2016 2014 2015 2016
Current ratio 1.10 1.24 0.88 0.96 1.08 0.87 1.72 0.61 0.97
Quick ratio 0.79 0.89 0.61 0.85 0.93 0.72 1.54 0.44 0.51
Net profit margin
(%) 12.73 43.37 6.85 4.56 12.1 15.08 53.83 21.58 4.27
Return on assets
(%) 6.78 15.76 1.54 2.1 4.7 5.6 24.98 7.85 0.49
Return on equity 94.86 18.38 6.28 15.26 20.99 39.31 13.26 1.13
Accounting and finance 3
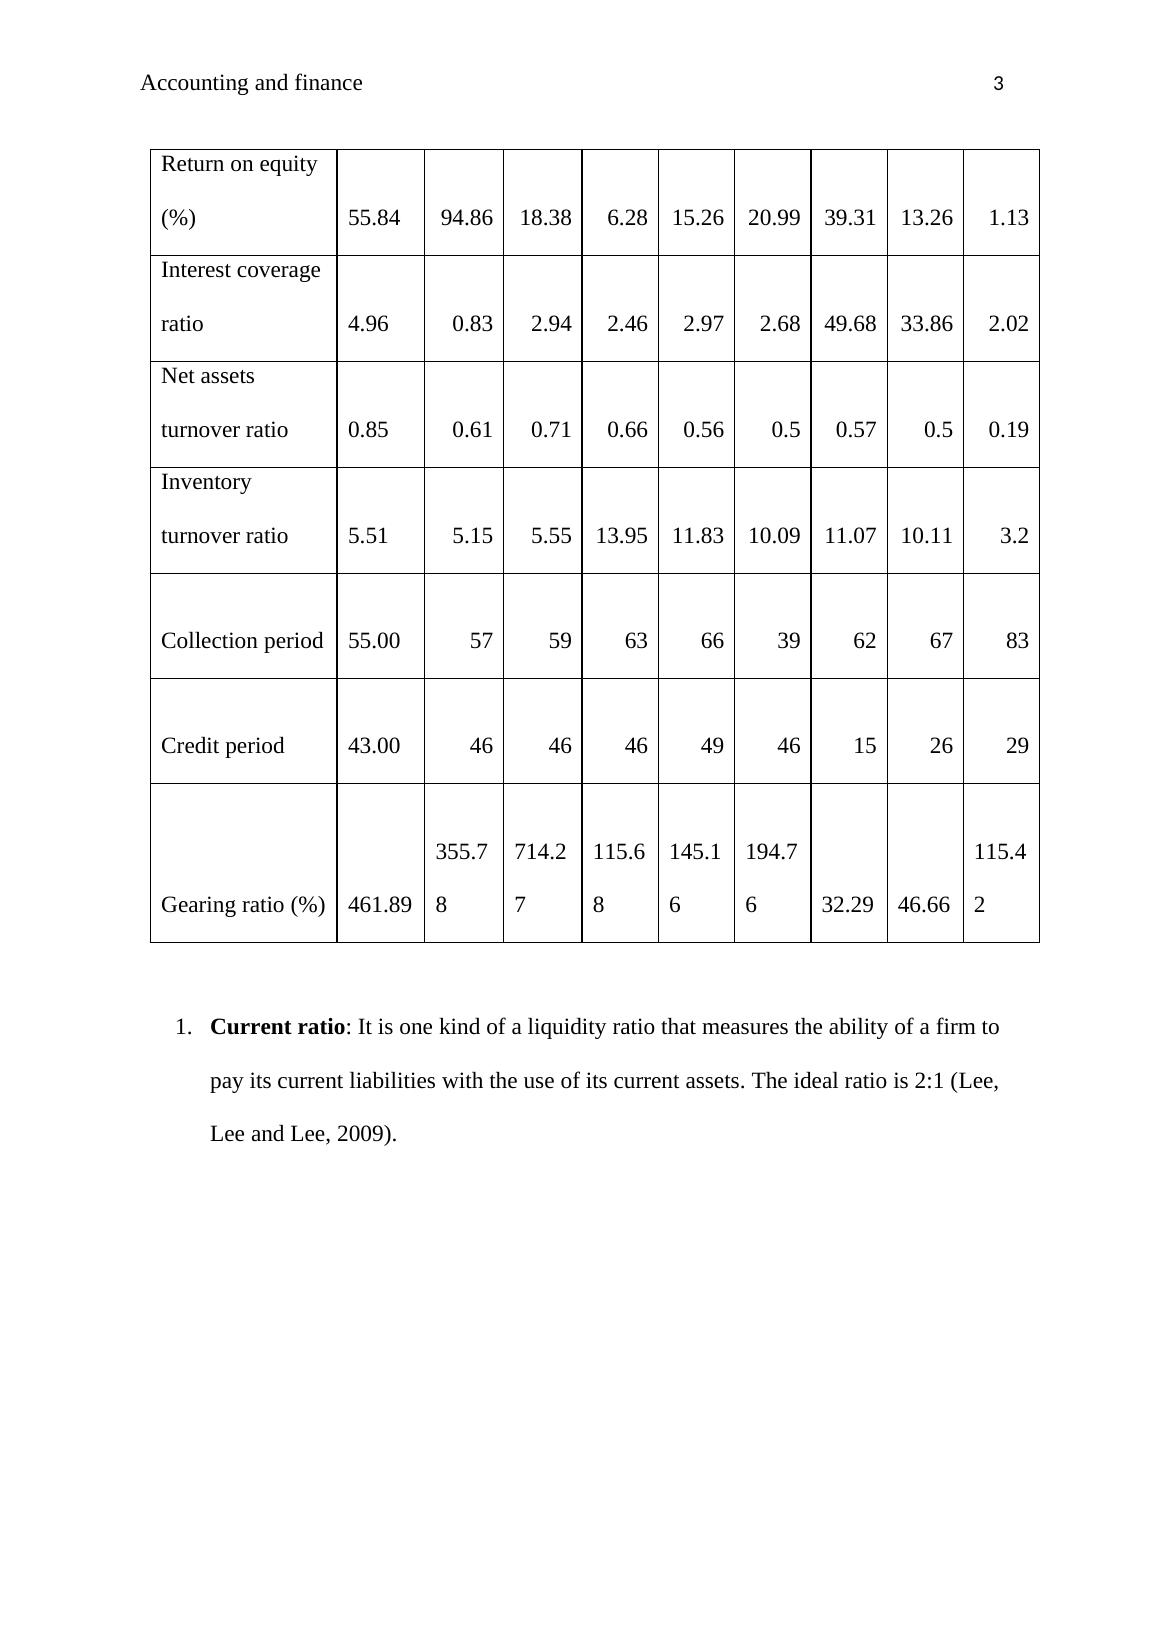
(%) 55.84
Interest coverage
ratio 4.96 0.83 2.94 2.46 2.97 2.68 49.68 33.86 2.02
Net assets
turnover ratio 0.85 0.61 0.71 0.66 0.56 0.5 0.57 0.5 0.19
Inventory
turnover ratio 5.51 5.15 5.55 13.95 11.83 10.09 11.07 10.11 3.2
Collection period 55.00 57 59 63 66 39 62 67 83
Credit period 43.00 46 46 46 49 46 15 26 29
Gearing ratio (%) 461.89
355.7
8
714.2
7
115.6
8
145.1
6
194.7
6 32.29 46.66
115.4
2
1. Current ratio: It is one kind of a liquidity ratio that measures the ability of a firm to
pay its current liabilities with the use of its current assets. The ideal ratio is 2:1 (Lee,
Lee and Lee, 2009).
Accounting and finance 4
2014 2015 2016 2014 2015 2016 2014 2015 2016
GLAXOSMITHKLINE
PLC
ASTRAZENECA PLC SHIRE PLC
-
0.20
0.40
0.60
0.80
1.00
1.20
1.40
1.60
1.80
2.00
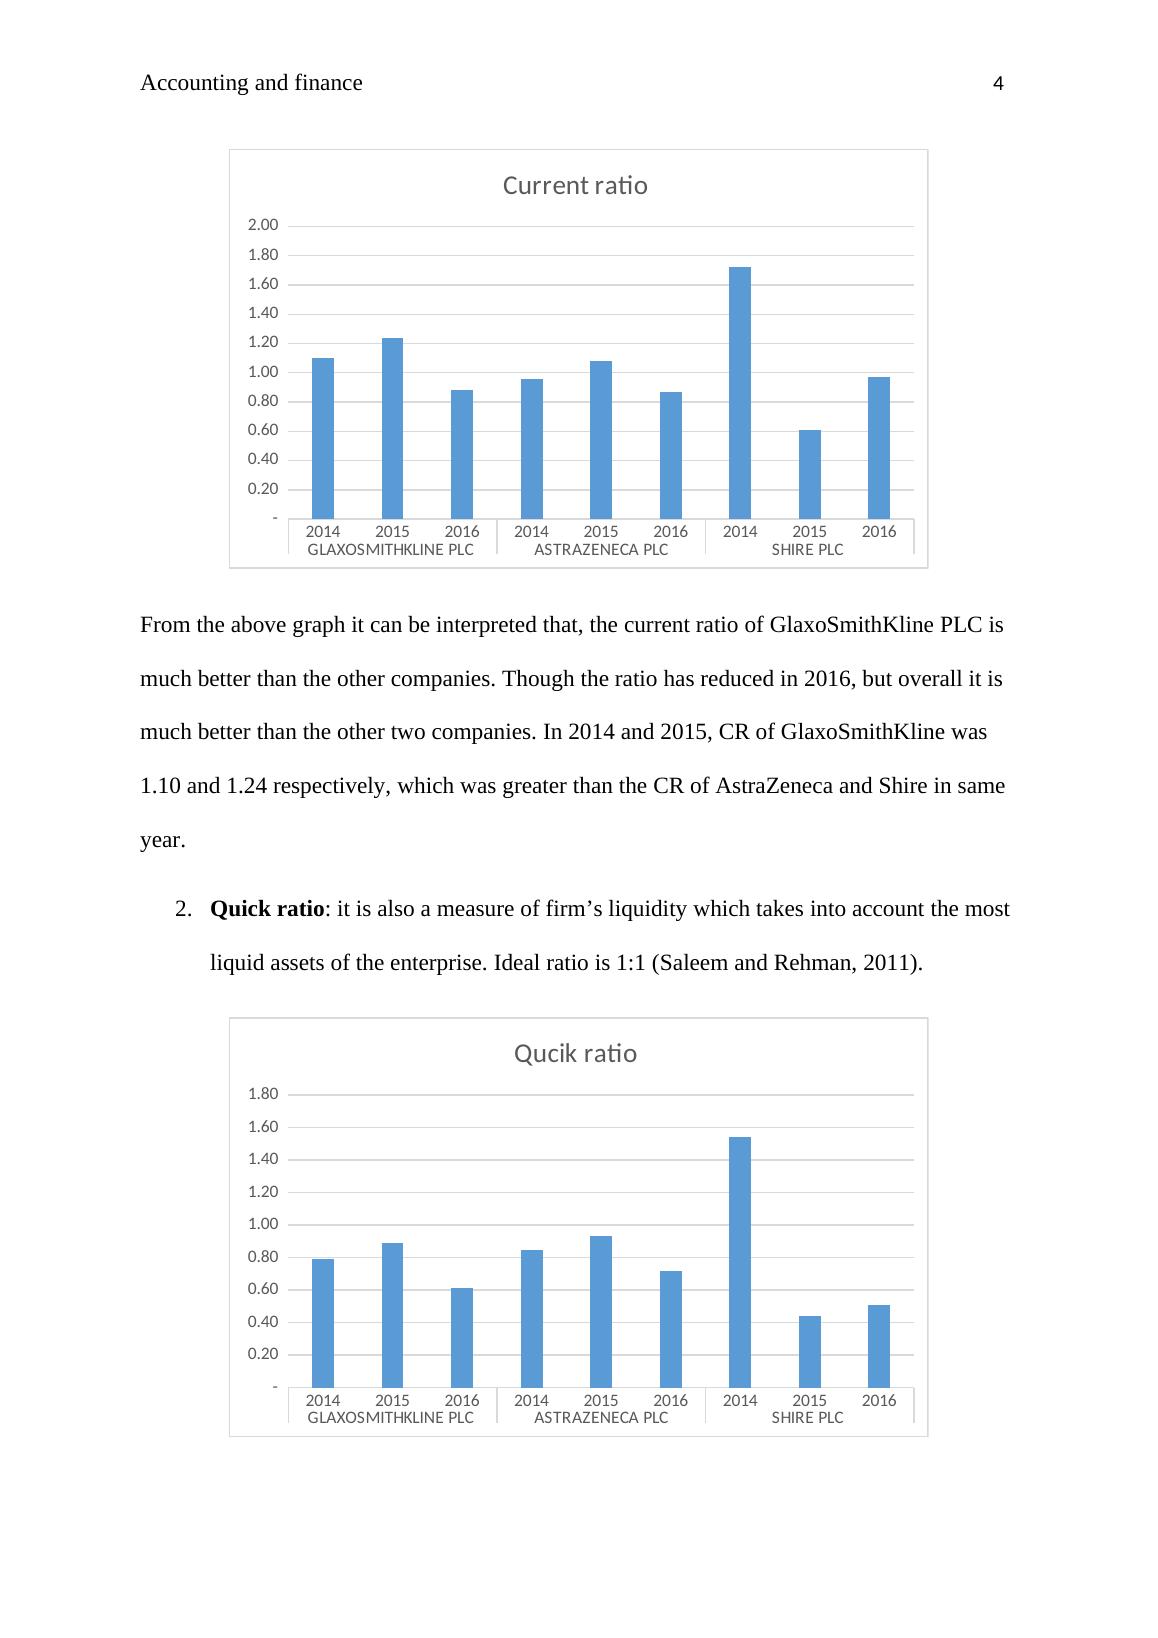
Current ratio
From the above graph it can be interpreted that, the current ratio of GlaxoSmithKline PLC is
much better than the other companies. Though the ratio has reduced in 2016, but overall it is
much better than the other two companies. In 2014 and 2015, CR of GlaxoSmithKline was
1.10 and 1.24 respectively, which was greater than the CR of AstraZeneca and Shire in same
year.
2. Quick ratio: it is also a measure of firm’s liquidity which takes into account the most
liquid assets of the enterprise. Ideal ratio is 1:1 (Saleem and Rehman, 2011).
2014 2015 2016 2014 2015 2016 2014 2015 2016
GLAXOSMITHKLINE
PLC
ASTRAZENECA PLC SHIRE PLC
-
0.20
0.40
0.60
0.80
1.00
1.20
1.40
1.60
1.80
Qucik ratio
2014 2015 2016 2014 2015 2016 2014 2015 2016
GLAXOSMITHKLINE
PLC
ASTRAZENECA PLC SHIRE PLC
-
0.20
0.40
0.60
0.80
1.00
1.20
1.40
1.60
1.80
2.00
Current ratio
From the above graph it can be interpreted that, the current ratio of GlaxoSmithKline PLC is
much better than the other companies. Though the ratio has reduced in 2016, but overall it is
much better than the other two companies. In 2014 and 2015, CR of GlaxoSmithKline was
1.10 and 1.24 respectively, which was greater than the CR of AstraZeneca and Shire in same
year.
2. Quick ratio: it is also a measure of firm’s liquidity which takes into account the most
liquid assets of the enterprise. Ideal ratio is 1:1 (Saleem and Rehman, 2011).
2014 2015 2016 2014 2015 2016 2014 2015 2016
GLAXOSMITHKLINE
PLC
ASTRAZENECA PLC SHIRE PLC
-
0.20
0.40
0.60
0.80
1.00
1.20
1.40
1.60
1.80
Qucik ratio
End of preview
Want to access all the pages? Upload your documents or become a member.
Related Documents
Analysis of Ratios for Pharmaceutical Companies Listed on London Stock Exchangelg...
|23
|4360
|364
Financial Performance Analysis of GlaxoSmithKline, AstraZeneca and Shire PLClg...
|29
|6102
|177
Ratio and Performance Analysis of Company Xlg...
|21
|3291
|59