Analysis of Ratios for Pharmaceutical Companies Listed on London Stock Exchange
Added on 2023-06-12
23 Pages4360 Words364 Views
Running Head: ANALYSIS OF RATIOS 1
Analysis of Ratios
Analysis of Ratios
Running Head: ANALYSIS OF RATIOS 2
Table of Contents
Question 1..................................................................................................................................4
Part A......................................................................................................................................4
Financial ratios....................................................................................................................4
Overall ranking.................................................................................................................16
Part B....................................................................................................................................17
Part C....................................................................................................................................17
Question 2................................................................................................................................17
MEMORANDUM................................................................................................................17
Part A................................................................................................................................18
Part B....................................................................................................................................19
References................................................................................................................................23
Running Head: ANALYSIS OF RATIOS 3
Question 1
Part A
Analysis of financial position – ratio analysis
Financial ratios
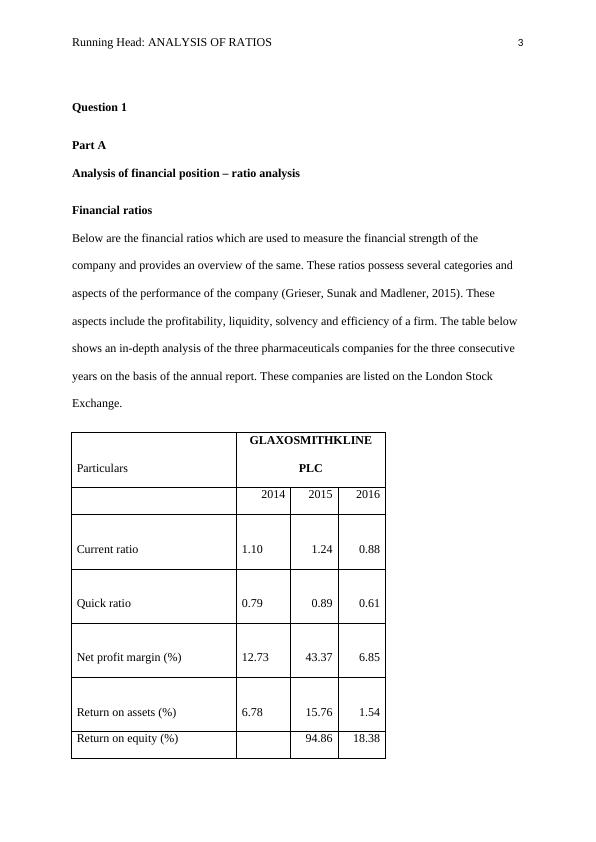
Below are the financial ratios which are used to measure the financial strength of the
company and provides an overview of the same. These ratios possess several categories and
aspects of the performance of the company (Grieser, Sunak and Madlener, 2015). These
aspects include the profitability, liquidity, solvency and efficiency of a firm. The table below
shows an in-depth analysis of the three pharmaceuticals companies for the three consecutive
years on the basis of the annual report. These companies are listed on the London Stock
Exchange.
Particulars
GLAXOSMITHKLINE
PLC
2014 2015 2016
Current ratio 1.10 1.24 0.88
Quick ratio 0.79 0.89 0.61
Net profit margin (%) 12.73 43.37 6.85
Return on assets (%) 6.78 15.76 1.54
Return on equity (%) 94.86 18.38
Question 1
Part A
Analysis of financial position – ratio analysis
Financial ratios
Below are the financial ratios which are used to measure the financial strength of the
company and provides an overview of the same. These ratios possess several categories and
aspects of the performance of the company (Grieser, Sunak and Madlener, 2015). These
aspects include the profitability, liquidity, solvency and efficiency of a firm. The table below
shows an in-depth analysis of the three pharmaceuticals companies for the three consecutive
years on the basis of the annual report. These companies are listed on the London Stock
Exchange.
Particulars
GLAXOSMITHKLINE
PLC
2014 2015 2016
Current ratio 1.10 1.24 0.88
Quick ratio 0.79 0.89 0.61
Net profit margin (%) 12.73 43.37 6.85
Return on assets (%) 6.78 15.76 1.54
Return on equity (%) 94.86 18.38
Running Head: ANALYSIS OF RATIOS 4
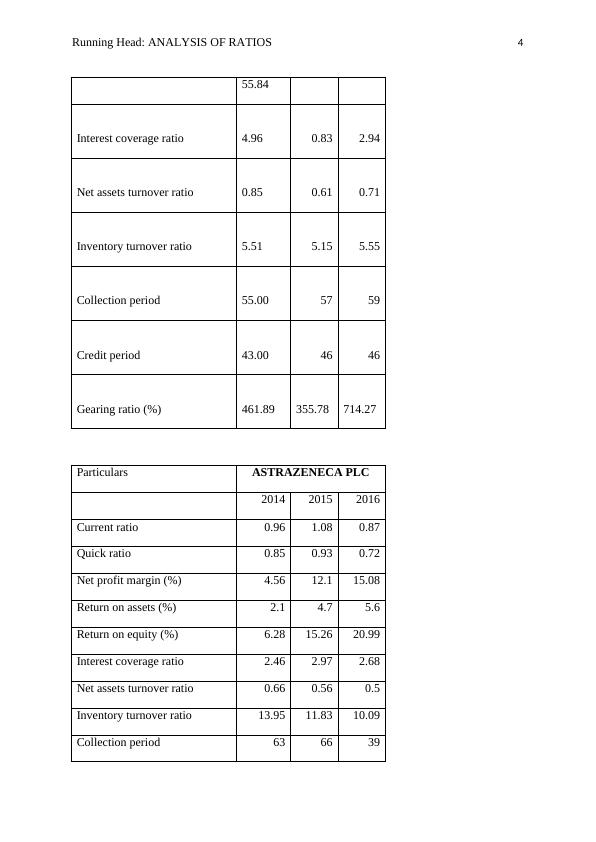
55.84
Interest coverage ratio 4.96 0.83 2.94
Net assets turnover ratio 0.85 0.61 0.71
Inventory turnover ratio 5.51 5.15 5.55
Collection period 55.00 57 59
Credit period 43.00 46 46
Gearing ratio (%) 461.89 355.78 714.27
Particulars ASTRAZENECA PLC
2014 2015 2016
Current ratio 0.96 1.08 0.87
Quick ratio 0.85 0.93 0.72
Net profit margin (%) 4.56 12.1 15.08
Return on assets (%) 2.1 4.7 5.6
Return on equity (%) 6.28 15.26 20.99
Interest coverage ratio 2.46 2.97 2.68
Net assets turnover ratio 0.66 0.56 0.5
Inventory turnover ratio 13.95 11.83 10.09
Collection period 63 66 39
Running Head: ANALYSIS OF RATIOS 5
Credit period 46 49 46
Gearing ratio (%) 115.68 145.16 194.76
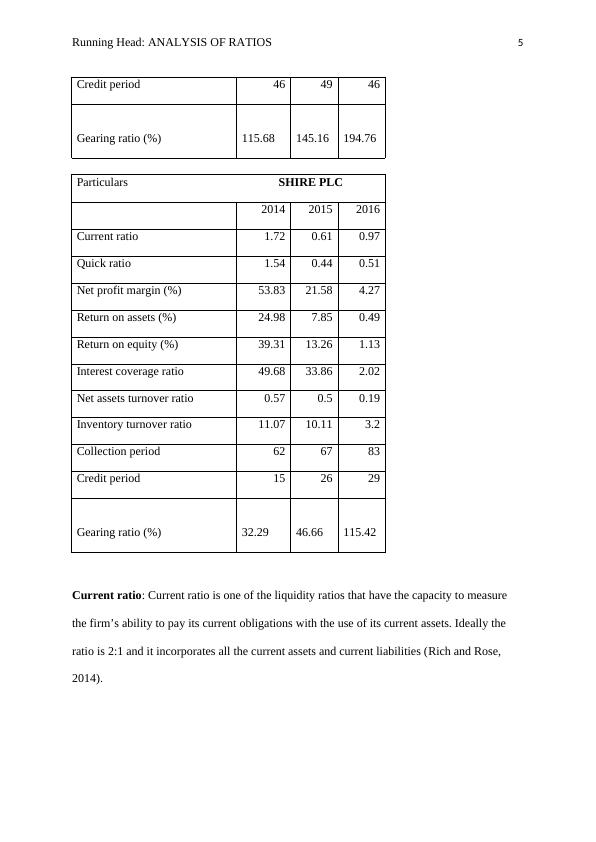
Particulars SHIRE PLC
2014 2015 2016
Current ratio 1.72 0.61 0.97
Quick ratio 1.54 0.44 0.51
Net profit margin (%) 53.83 21.58 4.27
Return on assets (%) 24.98 7.85 0.49
Return on equity (%) 39.31 13.26 1.13
Interest coverage ratio 49.68 33.86 2.02
Net assets turnover ratio 0.57 0.5 0.19
Inventory turnover ratio 11.07 10.11 3.2
Collection period 62 67 83
Credit period 15 26 29
Gearing ratio (%) 32.29 46.66 115.42
Current ratio: Current ratio is one of the liquidity ratios that have the capacity to measure
the firm’s ability to pay its current obligations with the use of its current assets. Ideally the
ratio is 2:1 and it incorporates all the current assets and current liabilities (Rich and Rose,
2014).
Credit period 46 49 46
Gearing ratio (%) 115.68 145.16 194.76
Particulars SHIRE PLC
2014 2015 2016
Current ratio 1.72 0.61 0.97
Quick ratio 1.54 0.44 0.51
Net profit margin (%) 53.83 21.58 4.27
Return on assets (%) 24.98 7.85 0.49
Return on equity (%) 39.31 13.26 1.13
Interest coverage ratio 49.68 33.86 2.02
Net assets turnover ratio 0.57 0.5 0.19
Inventory turnover ratio 11.07 10.11 3.2
Collection period 62 67 83
Credit period 15 26 29
Gearing ratio (%) 32.29 46.66 115.42
Current ratio: Current ratio is one of the liquidity ratios that have the capacity to measure
the firm’s ability to pay its current obligations with the use of its current assets. Ideally the
ratio is 2:1 and it incorporates all the current assets and current liabilities (Rich and Rose,
2014).
Running Head: ANALYSIS OF RATIOS 6
2014 2015 2016 2014 2015 2016 2014 2015 2016
GLAXOSMITHKLINE PLC ASTRAZENECA PLC SHIRE PLC
-
0.20
0.40
0.60
0.80
1.00
1.20
1.40
1.60
1.80
2.00
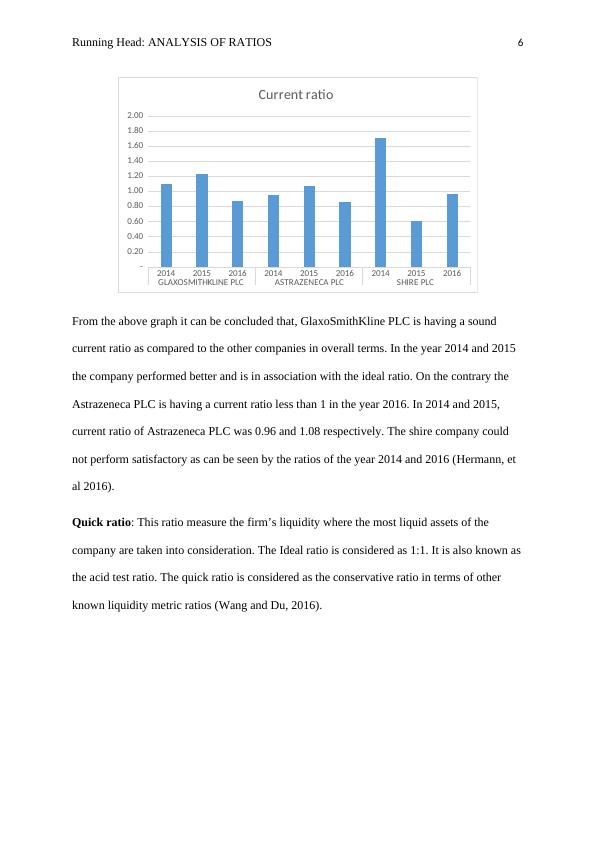
Current ratio
From the above graph it can be concluded that, GlaxoSmithKline PLC is having a sound
current ratio as compared to the other companies in overall terms. In the year 2014 and 2015
the company performed better and is in association with the ideal ratio. On the contrary the
Astrazeneca PLC is having a current ratio less than 1 in the year 2016. In 2014 and 2015,
current ratio of Astrazeneca PLC was 0.96 and 1.08 respectively. The shire company could
not perform satisfactory as can be seen by the ratios of the year 2014 and 2016 (Hermann, et
al 2016).
Quick ratio: This ratio measure the firm’s liquidity where the most liquid assets of the
company are taken into consideration. The Ideal ratio is considered as 1:1. It is also known as
the acid test ratio. The quick ratio is considered as the conservative ratio in terms of other
known liquidity metric ratios (Wang and Du, 2016).
2014 2015 2016 2014 2015 2016 2014 2015 2016
GLAXOSMITHKLINE PLC ASTRAZENECA PLC SHIRE PLC
-
0.20
0.40
0.60
0.80
1.00
1.20
1.40
1.60
1.80
2.00
Current ratio
From the above graph it can be concluded that, GlaxoSmithKline PLC is having a sound
current ratio as compared to the other companies in overall terms. In the year 2014 and 2015
the company performed better and is in association with the ideal ratio. On the contrary the
Astrazeneca PLC is having a current ratio less than 1 in the year 2016. In 2014 and 2015,
current ratio of Astrazeneca PLC was 0.96 and 1.08 respectively. The shire company could
not perform satisfactory as can be seen by the ratios of the year 2014 and 2016 (Hermann, et
al 2016).
Quick ratio: This ratio measure the firm’s liquidity where the most liquid assets of the
company are taken into consideration. The Ideal ratio is considered as 1:1. It is also known as
the acid test ratio. The quick ratio is considered as the conservative ratio in terms of other
known liquidity metric ratios (Wang and Du, 2016).
End of preview
Want to access all the pages? Upload your documents or become a member.
Related Documents
Accounting and Finance : Assignment Solvedlg...
|19
|3429
|13
Ratio Analysis for Rangemaster plclg...
|9
|1965
|22
Financial Performance Analysis of GlaxoSmithKline, AstraZeneca and Shire PLClg...
|29
|6102
|177
Ratio and Performance Analysis of Company Xlg...
|21
|3291
|59
Financial Reporting for Businesslg...
|19
|3681
|57
Financial Reporting for Businesslg...
|19
|3681
|62