Comprehensive Financial Ratio Analysis Report for ABC Limited
VerifiedAdded on 2023/01/17
|11
|1963
|69
Report
AI Summary
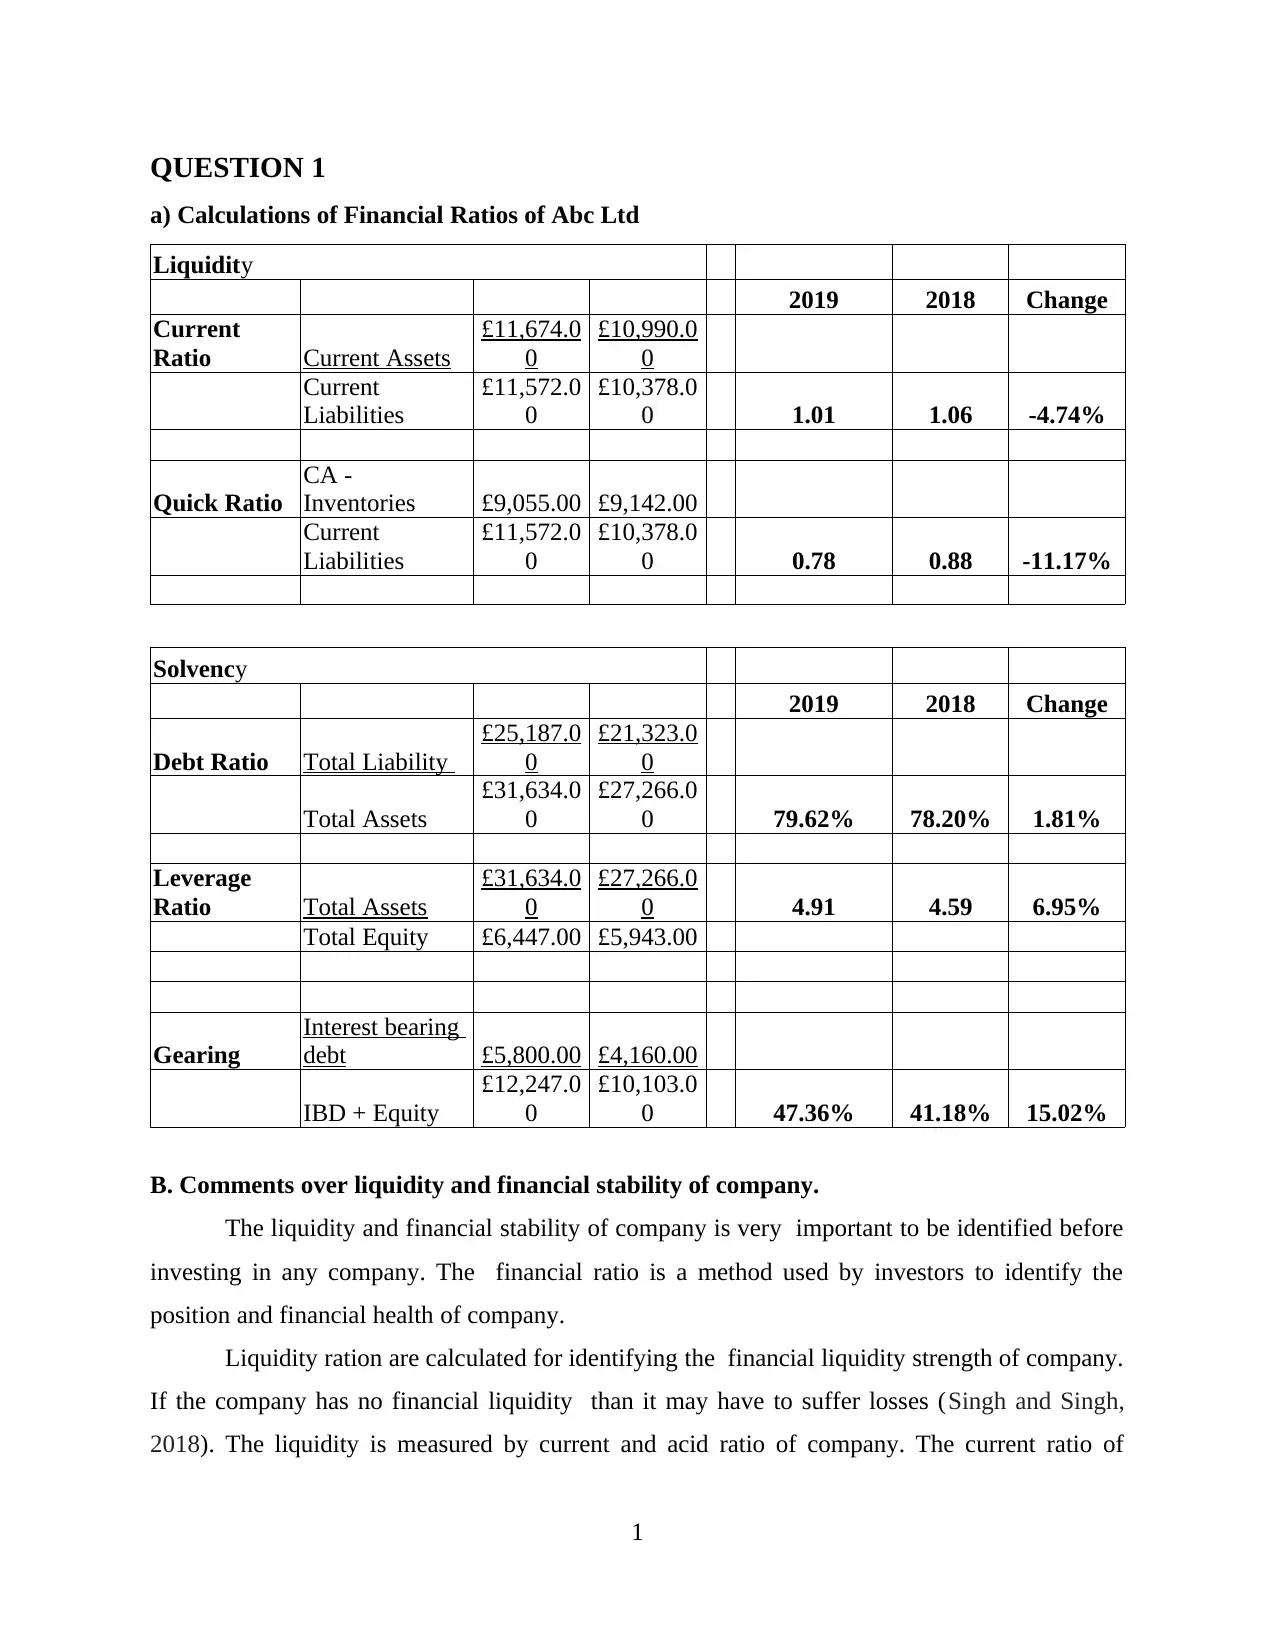
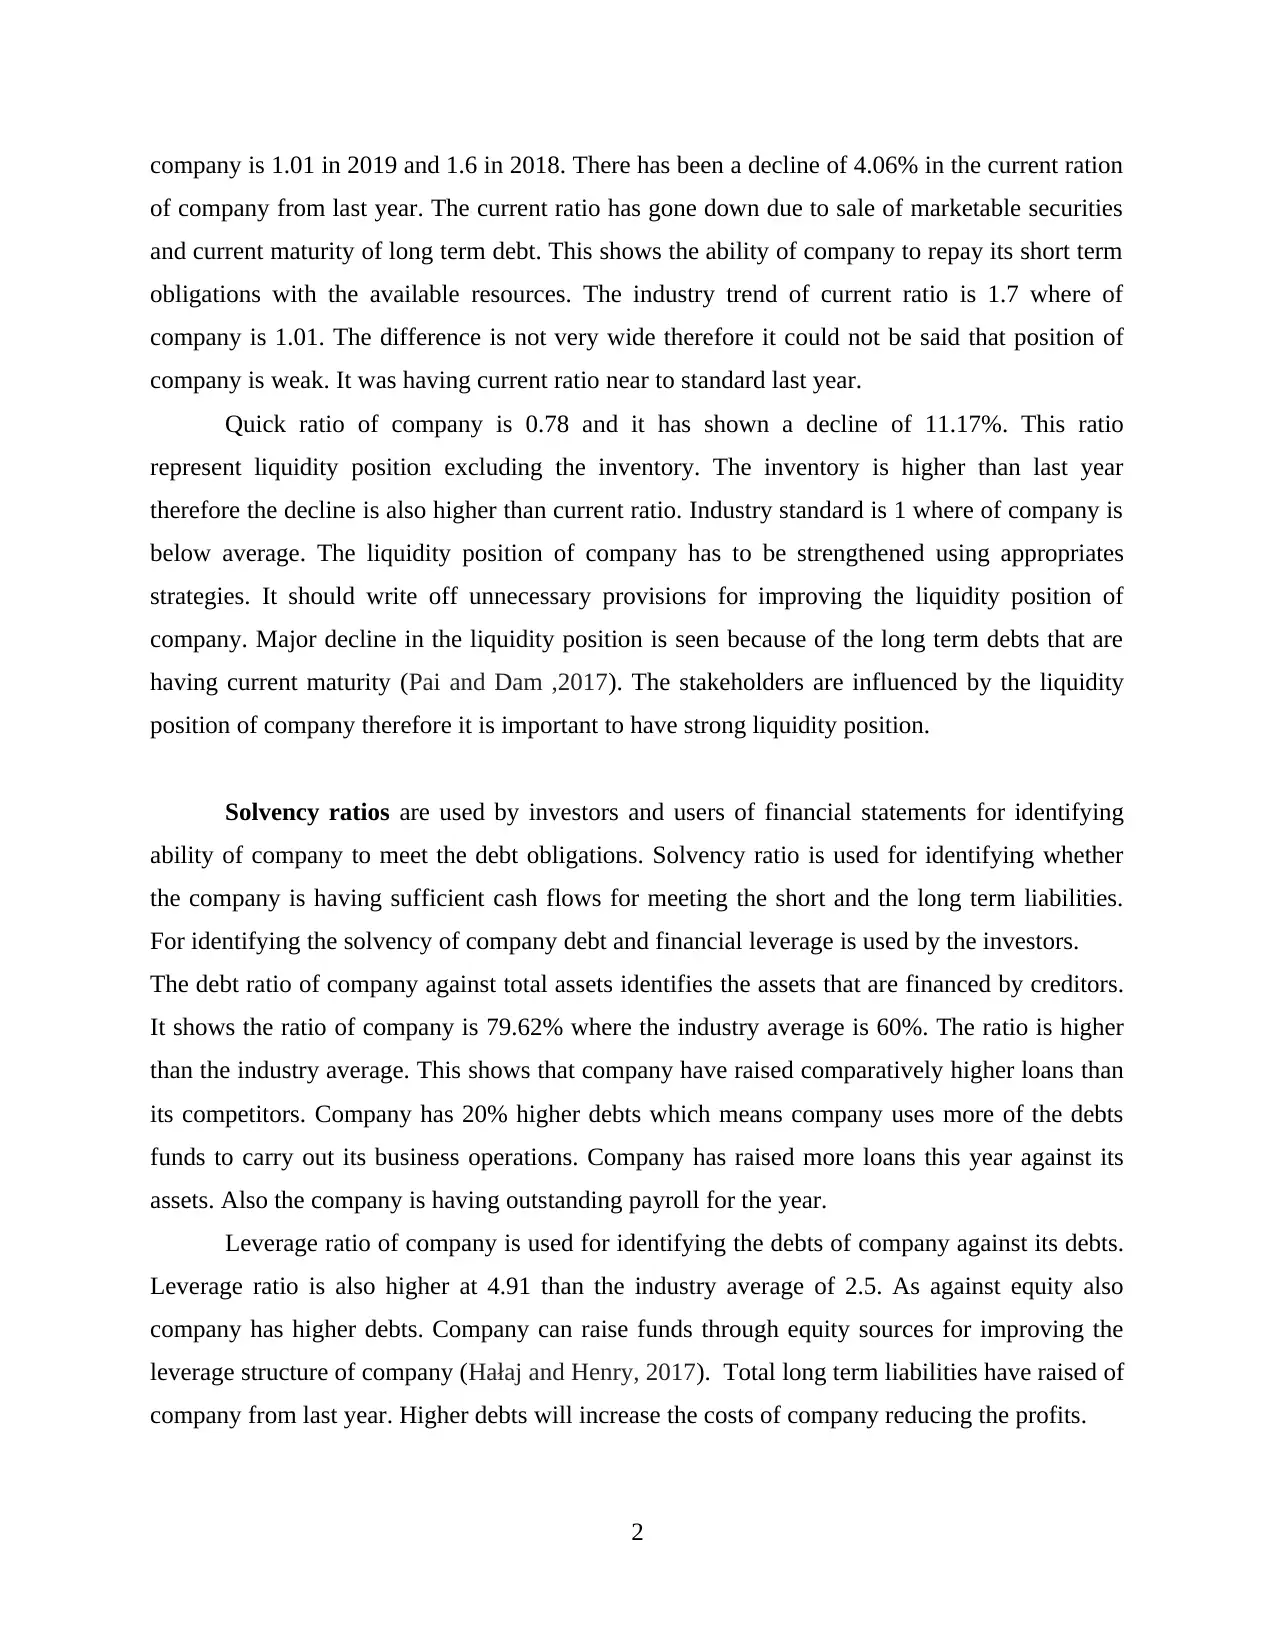
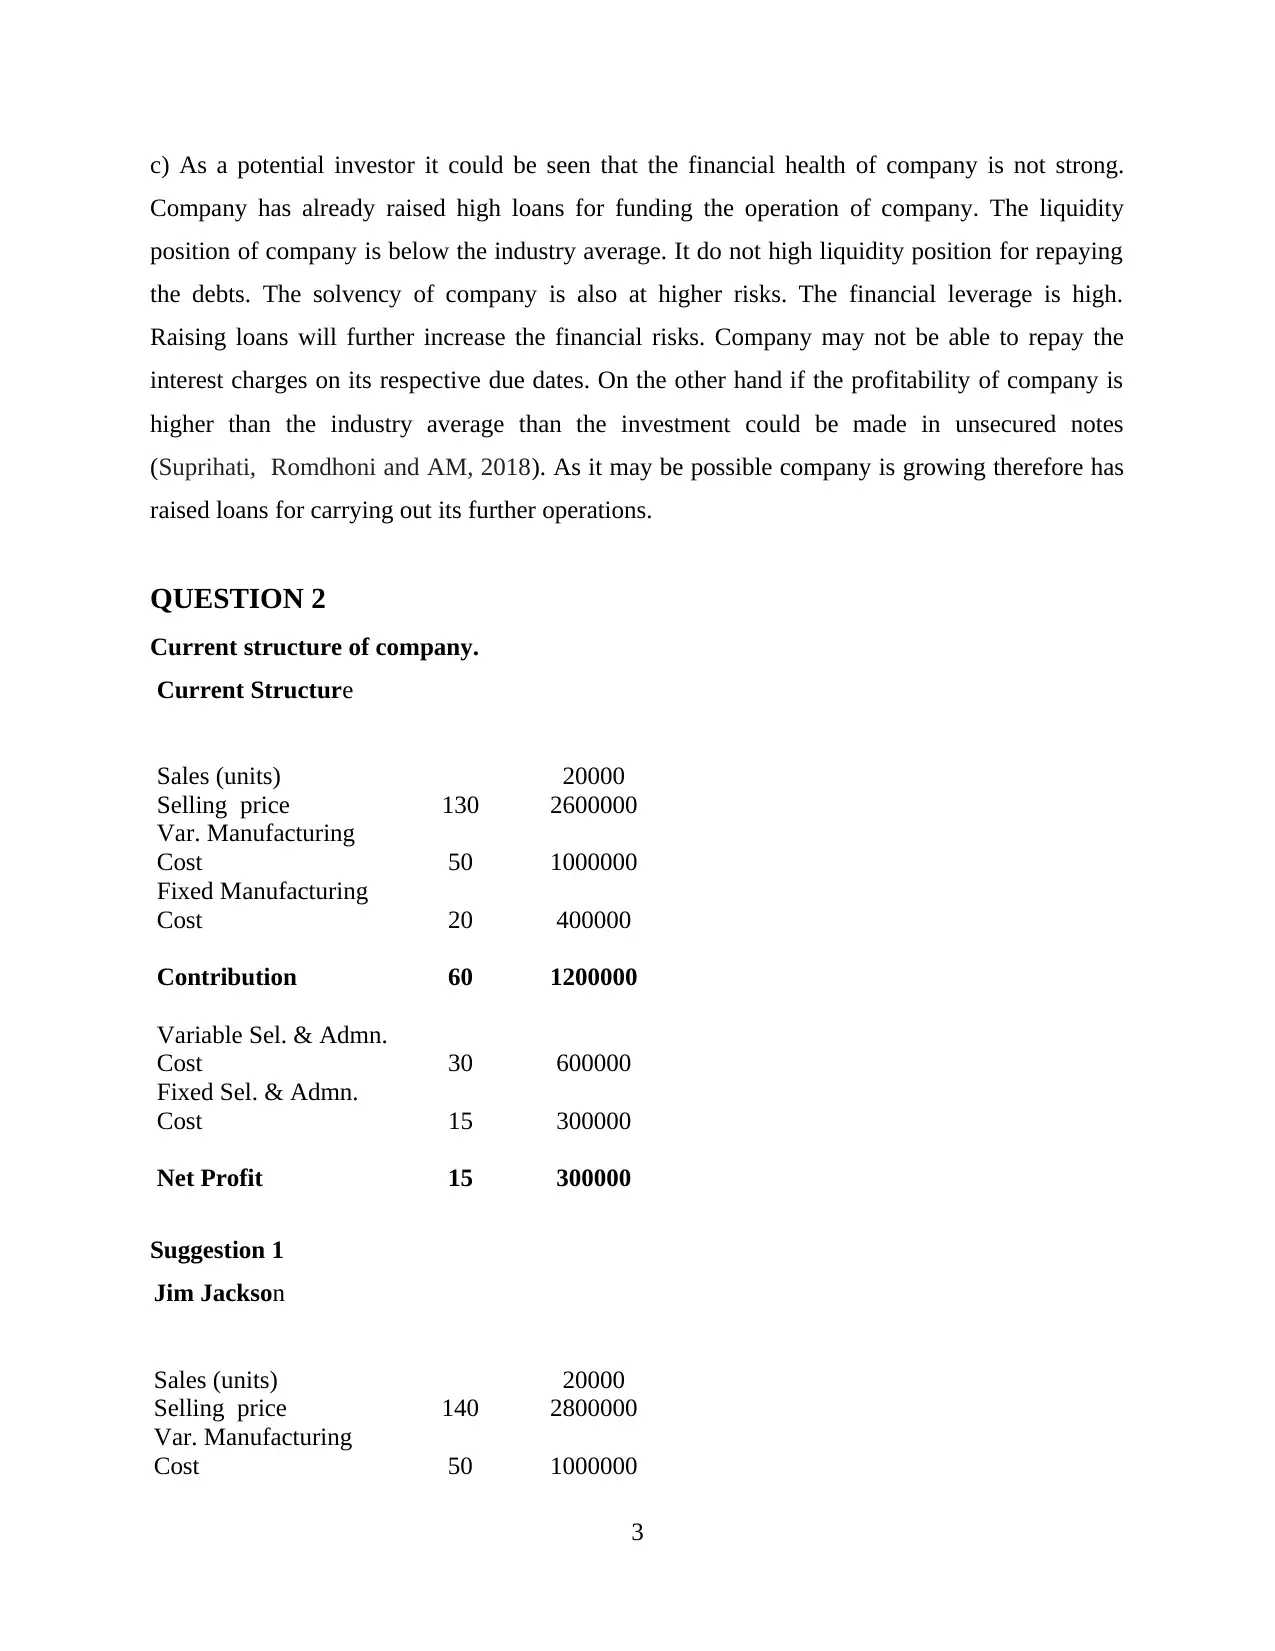
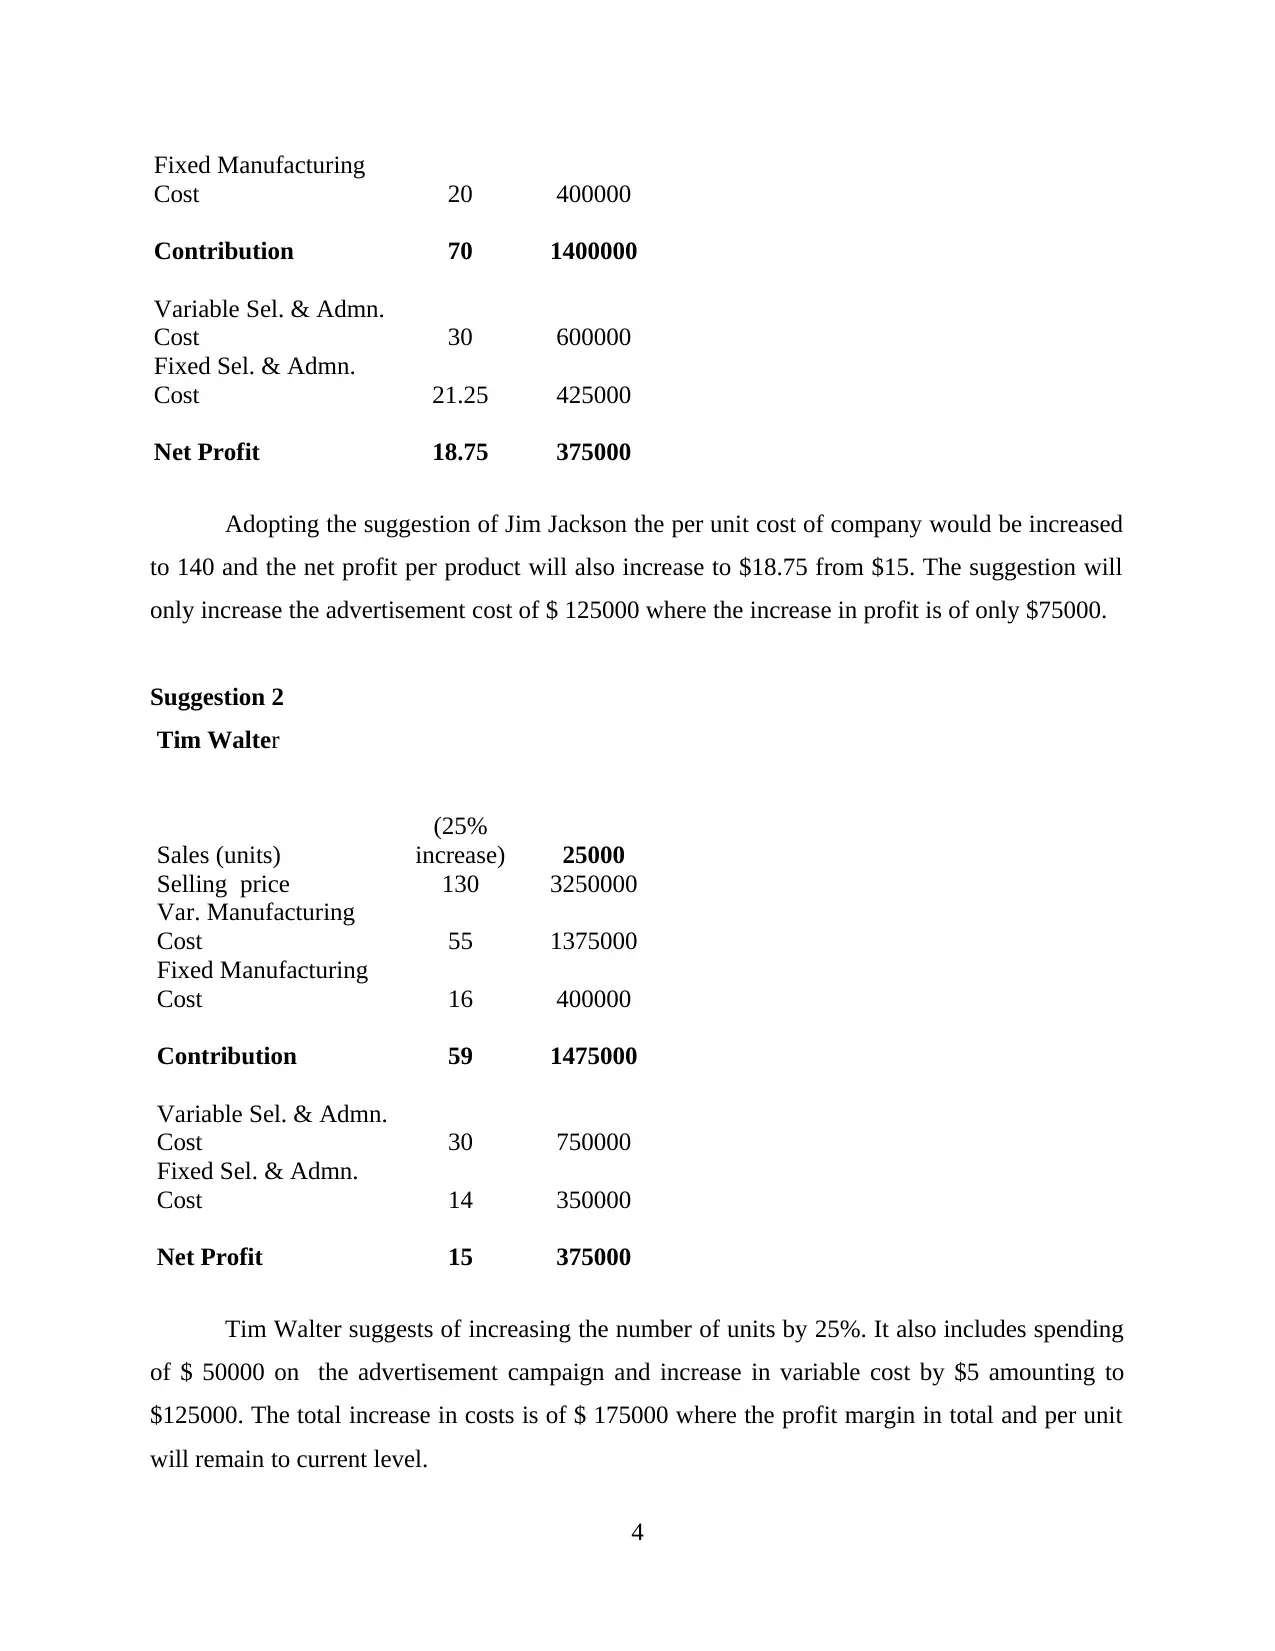
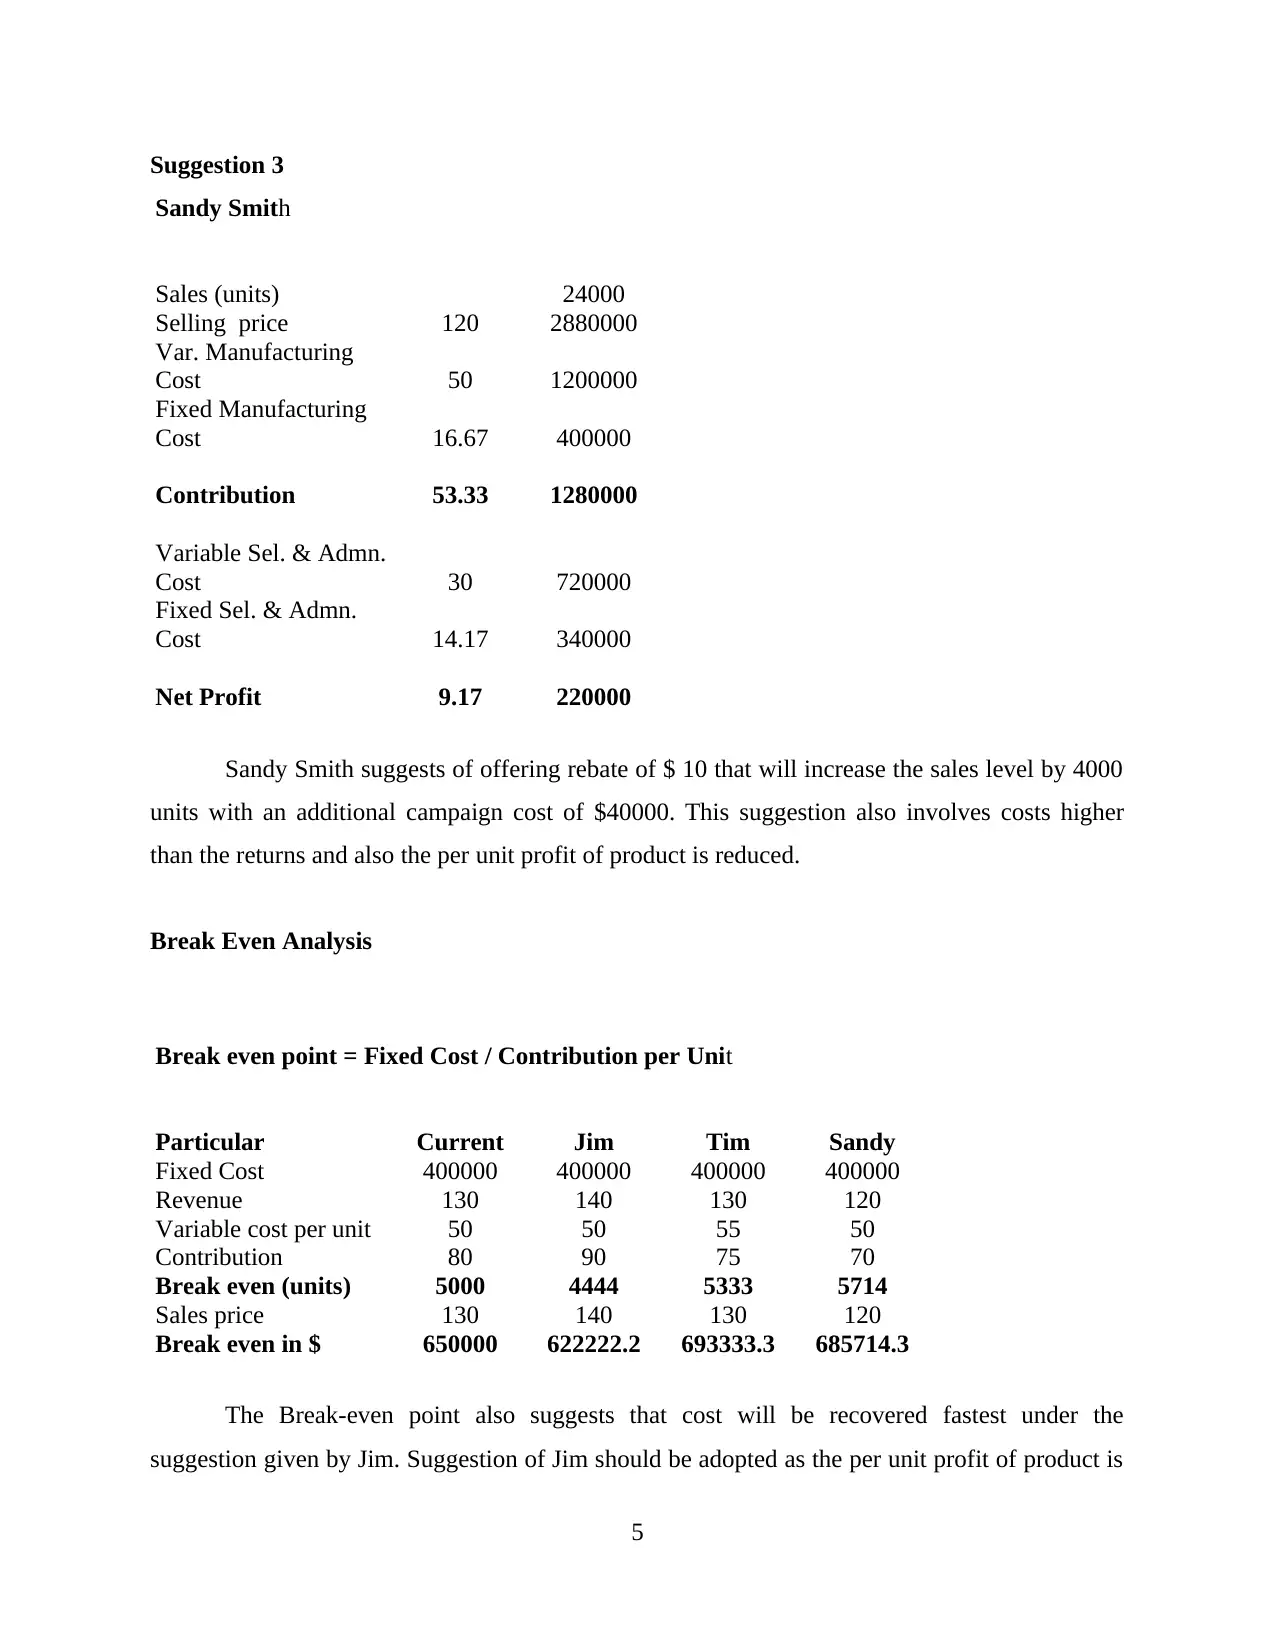
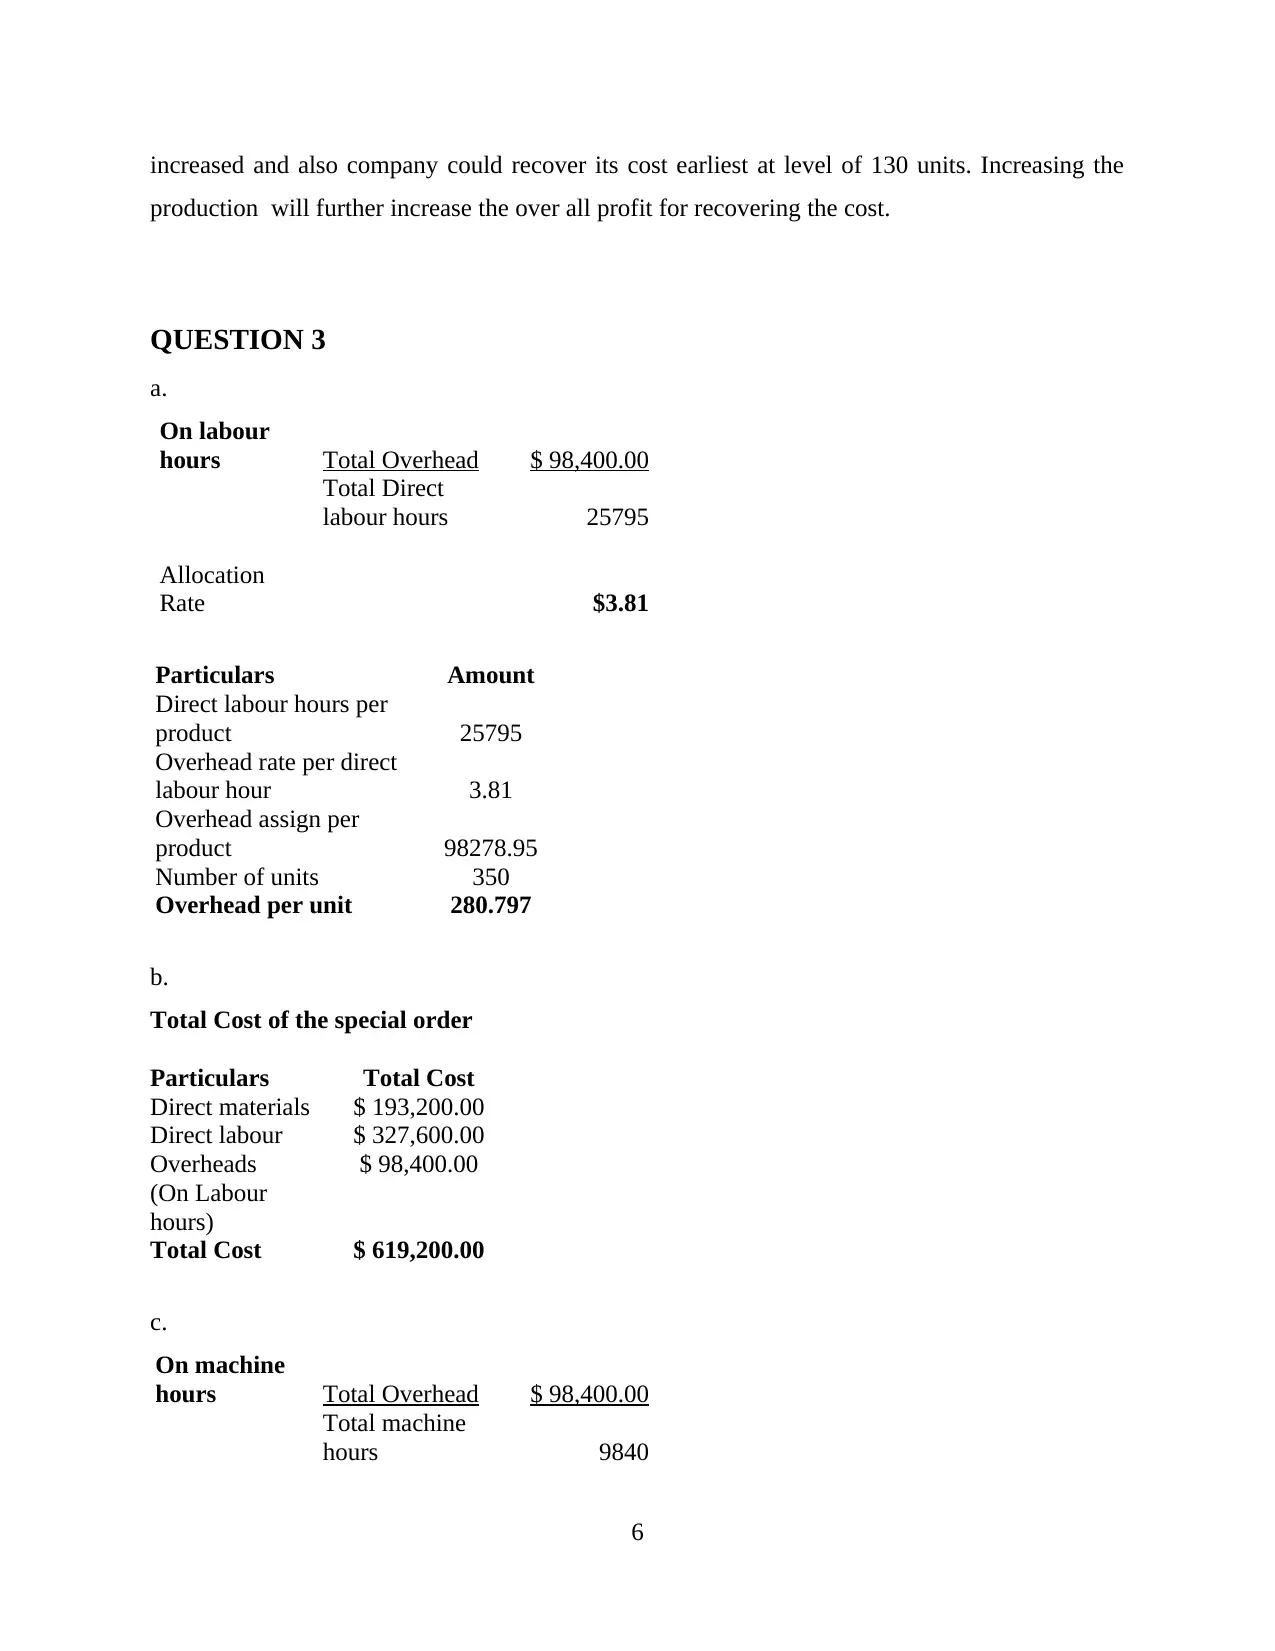
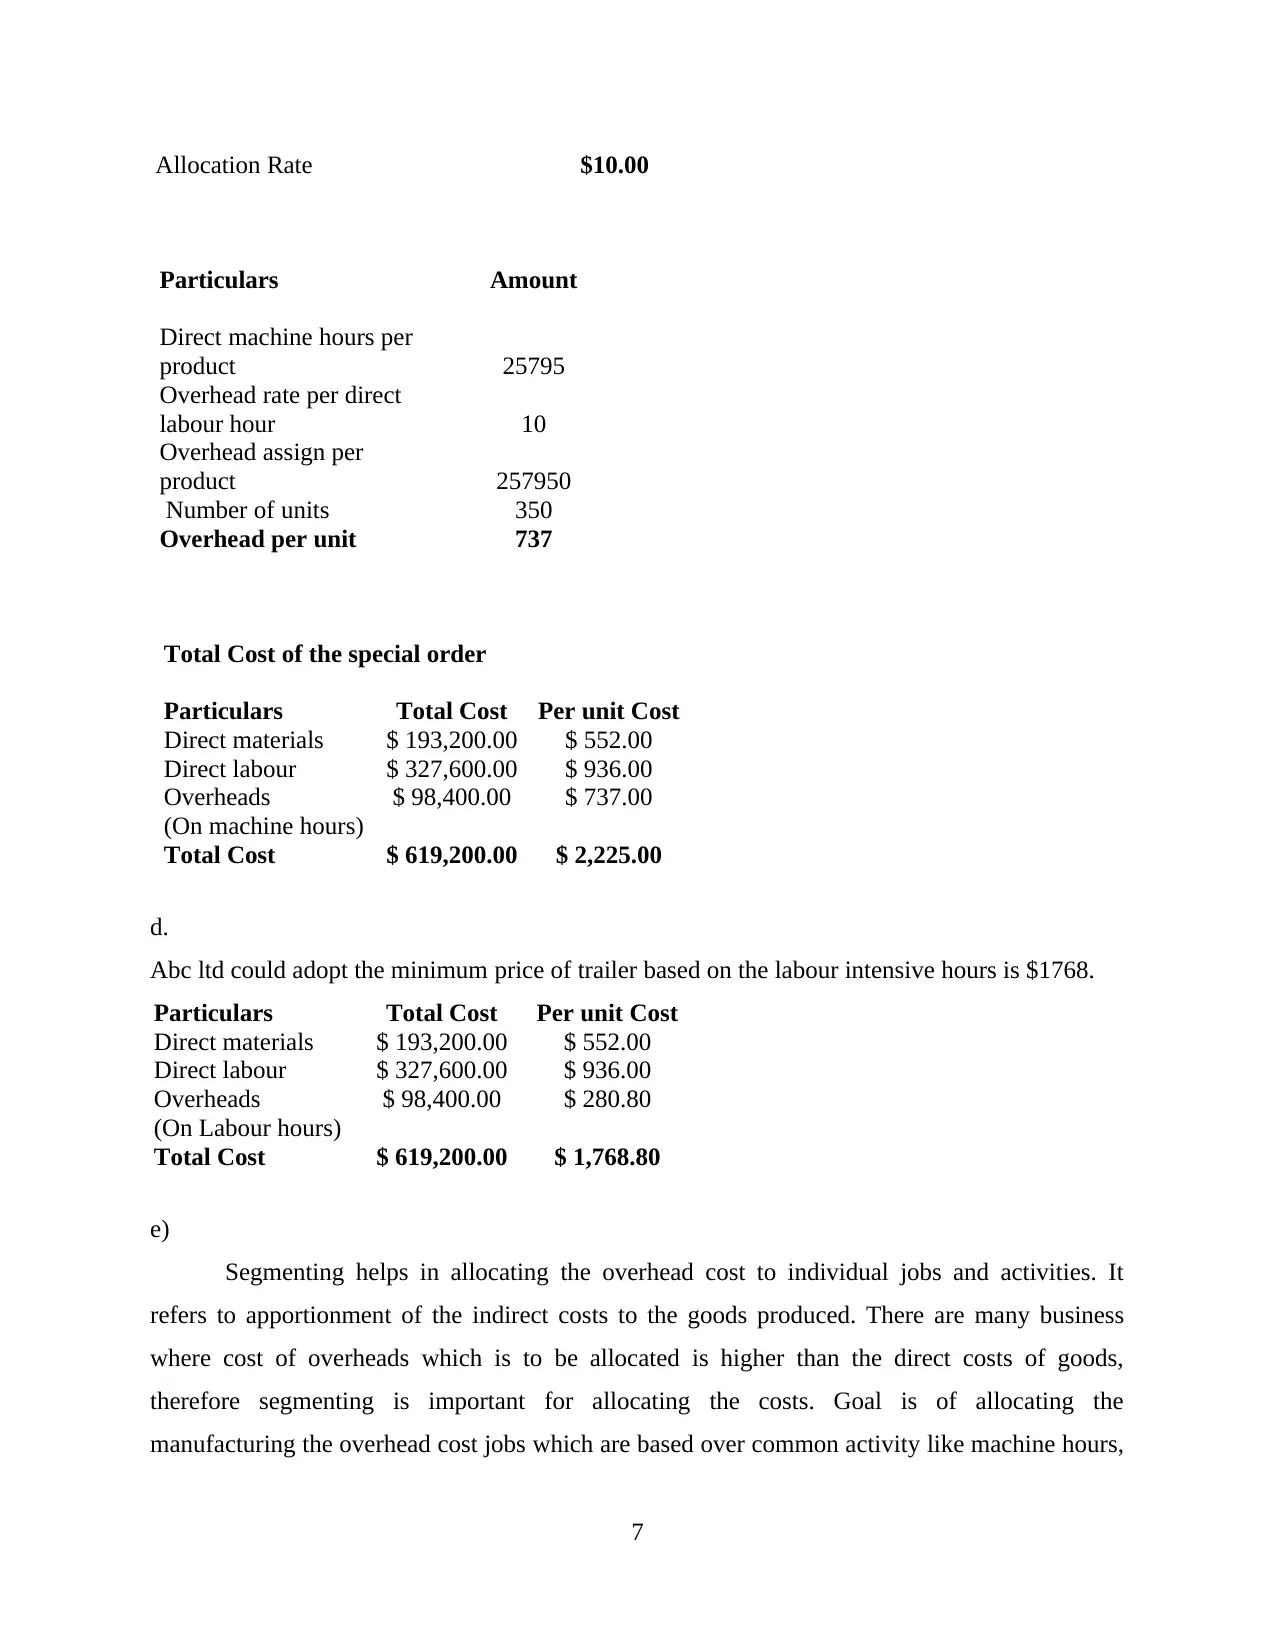
This report presents a comprehensive financial analysis of ABC Ltd, examining its performance through various financial ratios. The analysis begins with a calculation of key liquidity ratios, such as the current and quick ratios, assessing the company's ability to meet short-term obligations. Solvency ratios, including the debt ratio and leverage ratio, are then computed to evaluate the company's long-term financial stability and debt management. The report includes a discussion of the financial health of the company and provides recommendations for investors. Further, the report delves into cost accounting, analyzing the current cost structure of the company. It evaluates the impact of different suggestions (Jim Jackson, Tim Walter, and Sandy Smith) on sales, costs, and profit, including a break-even analysis for each scenario. Finally, the report addresses overhead allocation methods for a special order, calculating costs based on both direct labor hours and machine hours, and discussing the importance of segmenting overhead costs.
1 out of 11
Related Documents


Your All-in-One AI-Powered Toolkit for Academic Success.
+13062052269
info@desklib.com
Available 24*7 on WhatsApp / Email
![[object Object]](/_next/static/media/star-bottom.7253800d.svg)
Copyright © 2020–2026 A2Z Services. All Rights Reserved. Developed and managed by ZUCOL.