Financial Analysis of Any Organisation
Added on 2022-08-20
11 Pages1379 Words12 Views

End of preview
Want to access all the pages? Upload your documents or become a member.
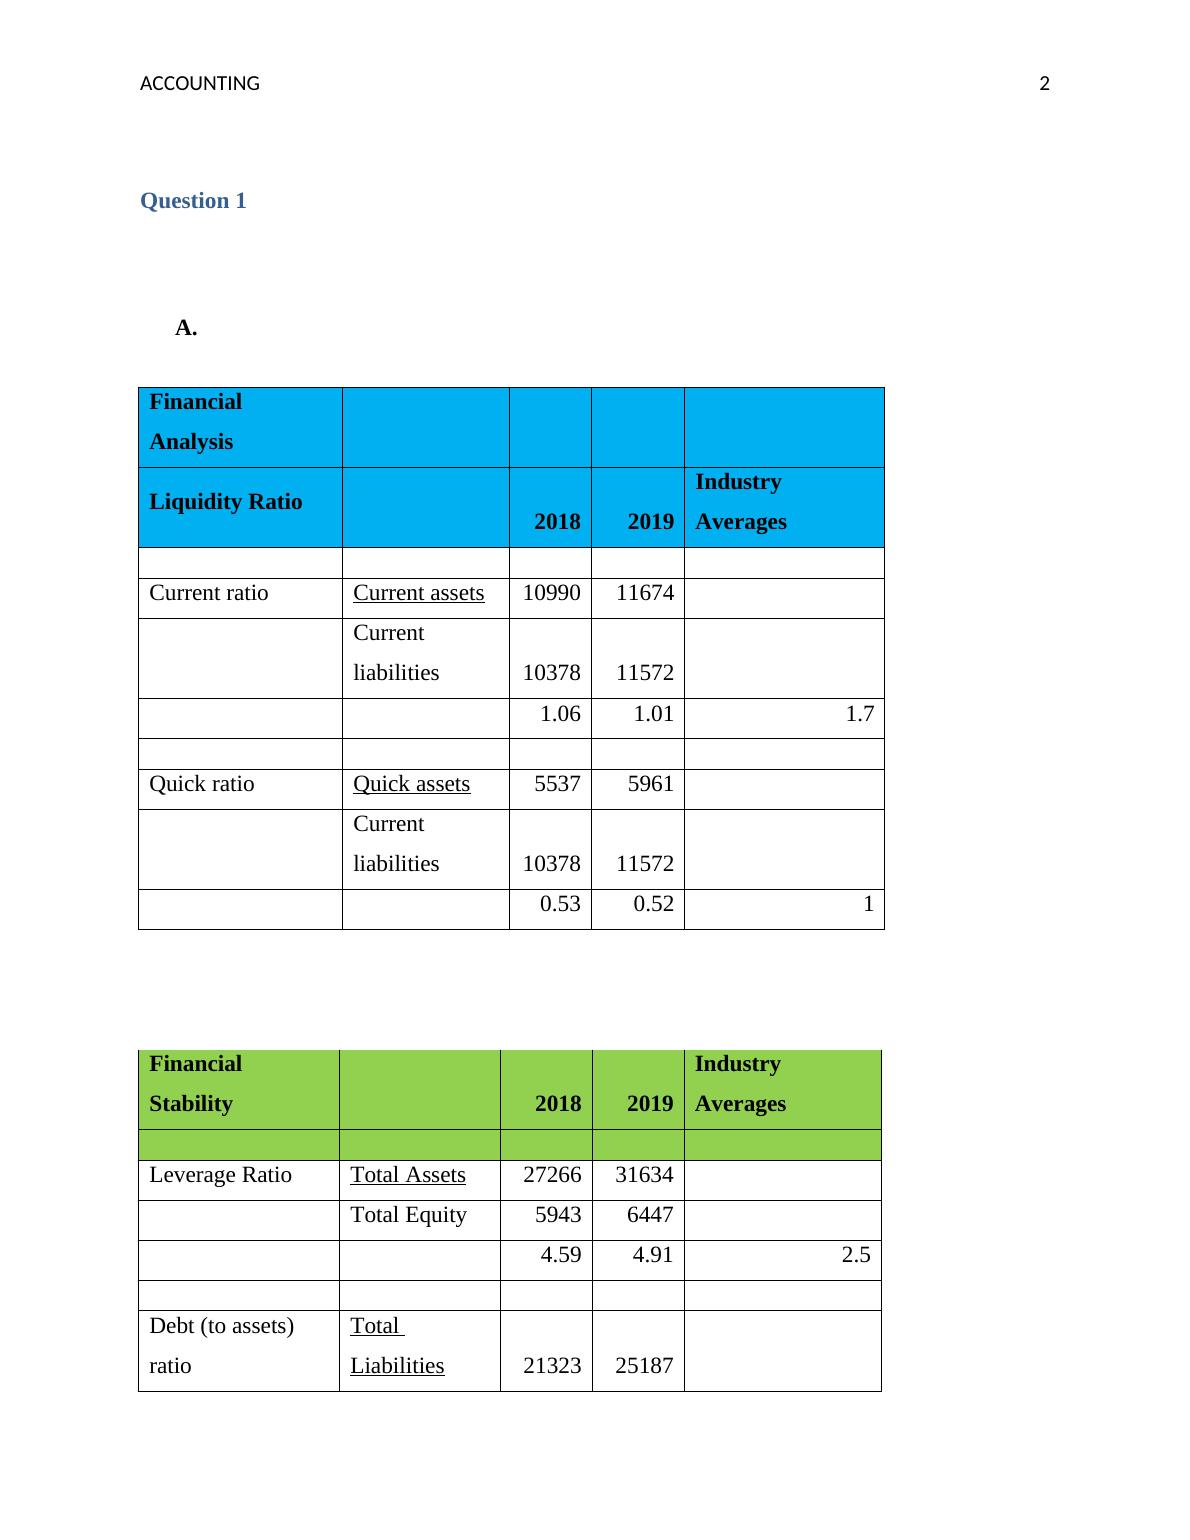
Current ratio Current assets
|11
|1340
|16
Financial Ratios and Analysis for ABC Ltd
|11
|1963
|69
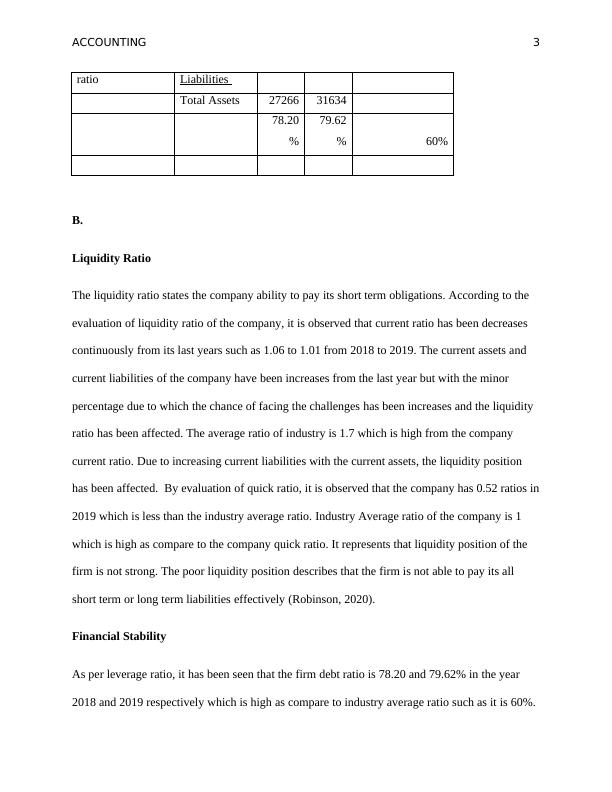
Accounting for managers Question 1 3 a) Current ratio current asset/current liabilities 1.06 1.01 Stability ratios Formula 2018 2019
|7
|1182
|285
(DOC) Assignment on Management Accounting - Desklib
|11
|1749
|12
Financial Analysis | Task Report
|14
|3027
|19
Evaluation of Company's Financial Position and Ratios
|10
|1161
|218