Quantitative Methods: Statistical Analysis in Education Assignment
VerifiedAdded on 2020/01/23
|17
|2935
|194
Homework Assignment
AI Summary
This assignment applies quantitative methods to analyze educational data across three case studies. Part A uses t-tests to examine the impact of mindfulness classes on children's sleep patterns during exams, comparing mindfulness and control groups. Part B investigates online behavior, comparing experiences of abusive or unfriendly interactions on social networking sites versus private messaging services, employing t-tests and Wilcoxon signed-rank tests. Part C explores the association between physical activity and obesity levels in children, utilizing regression analysis to assess the relationship between pedometer-recorded steps and Body Mass Index (BMI). The assignment includes descriptive statistics, hypothesis testing, and interpretations of statistical outputs from SPSS, providing a comprehensive analysis of educational data and research methods.
Statistics in Education /
Introduction to Quantitative
Methods
Introduction to Quantitative
Methods
Paraphrase This Document
Need a fresh take? Get an instant paraphrase of this document with our AI Paraphraser
TABLE OF CONTENTS
INTRODUCTION...........................................................................................................................1
PART A...........................................................................................................................................1
PART B...........................................................................................................................................2
PART C...........................................................................................................................................4
Conclusion.......................................................................................................................................7
References........................................................................................................................................9
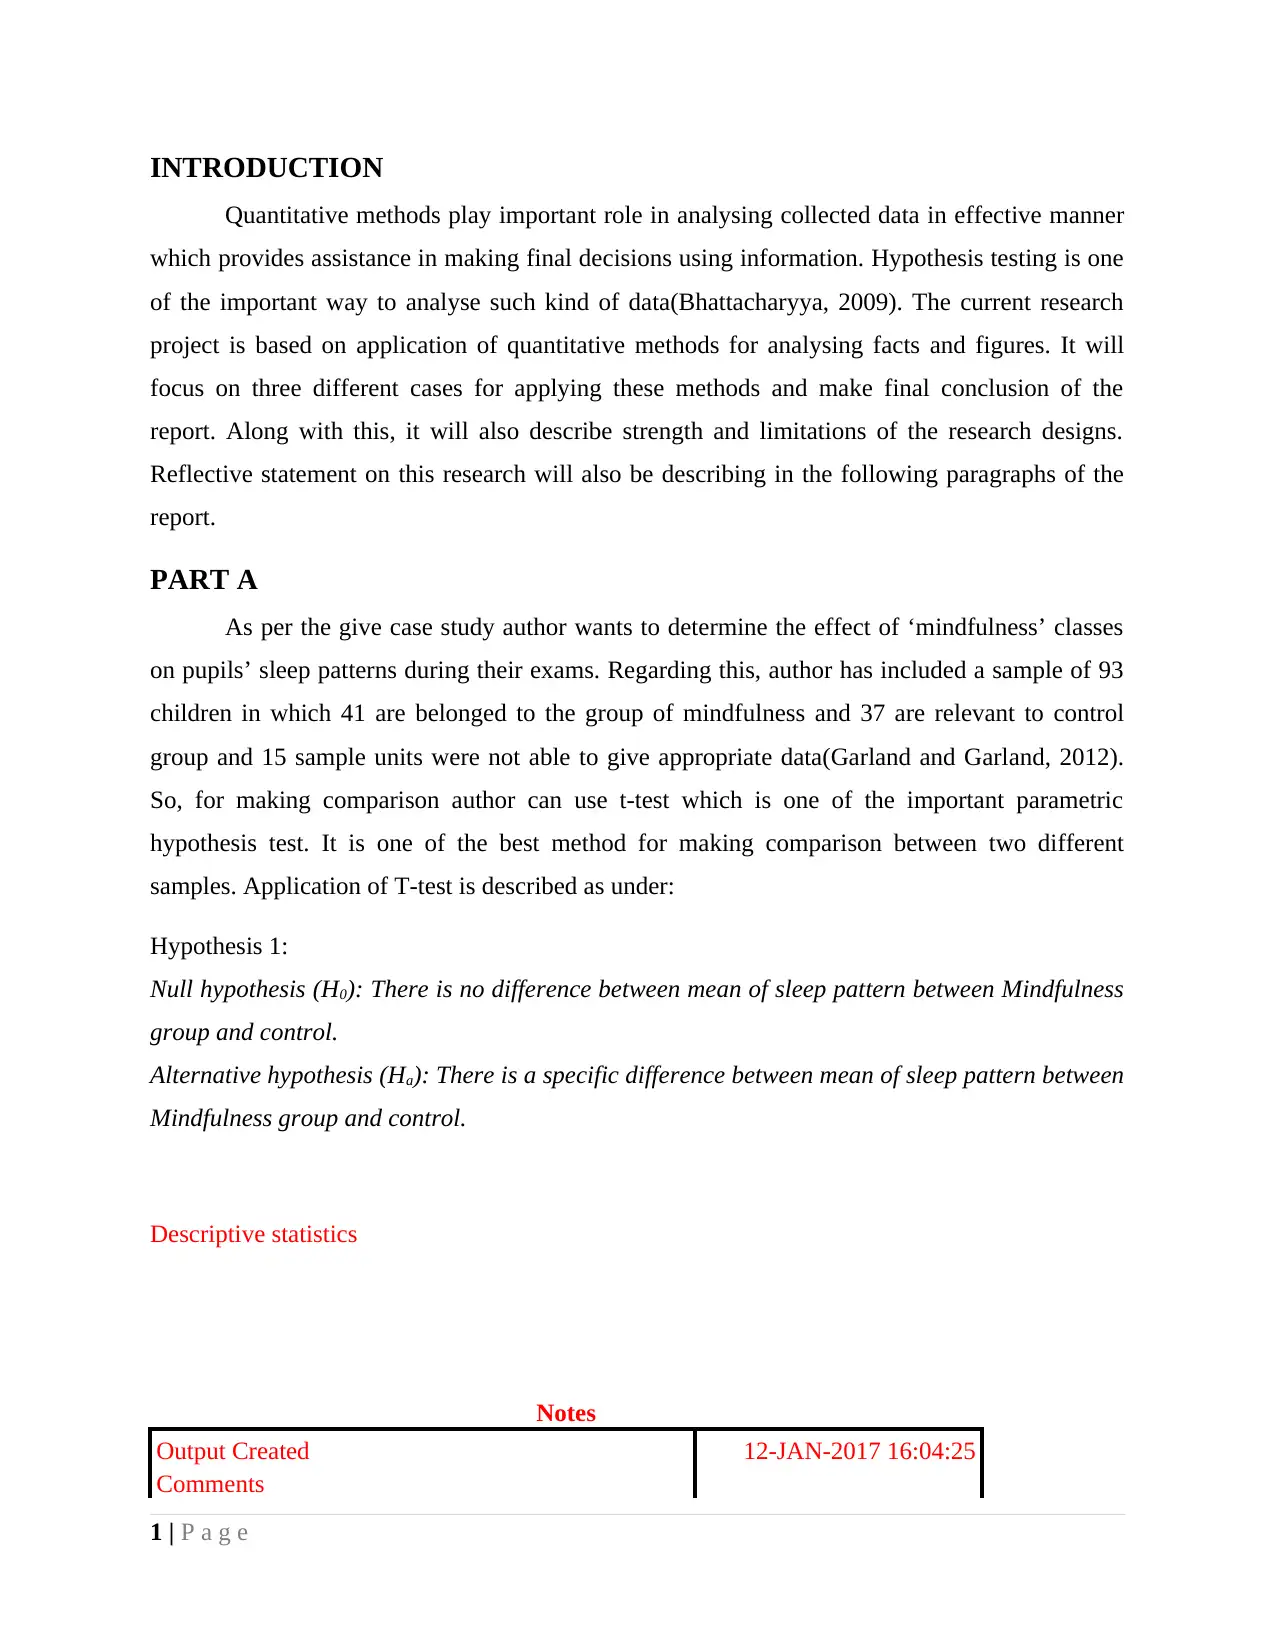
INTRODUCTION
Quantitative methods play important role in analysing collected data in effective manner
which provides assistance in making final decisions using information. Hypothesis testing is one
of the important way to analyse such kind of data(Bhattacharyya, 2009). The current research
project is based on application of quantitative methods for analysing facts and figures. It will
focus on three different cases for applying these methods and make final conclusion of the
report. Along with this, it will also describe strength and limitations of the research designs.
Reflective statement on this research will also be describing in the following paragraphs of the
report.
PART A
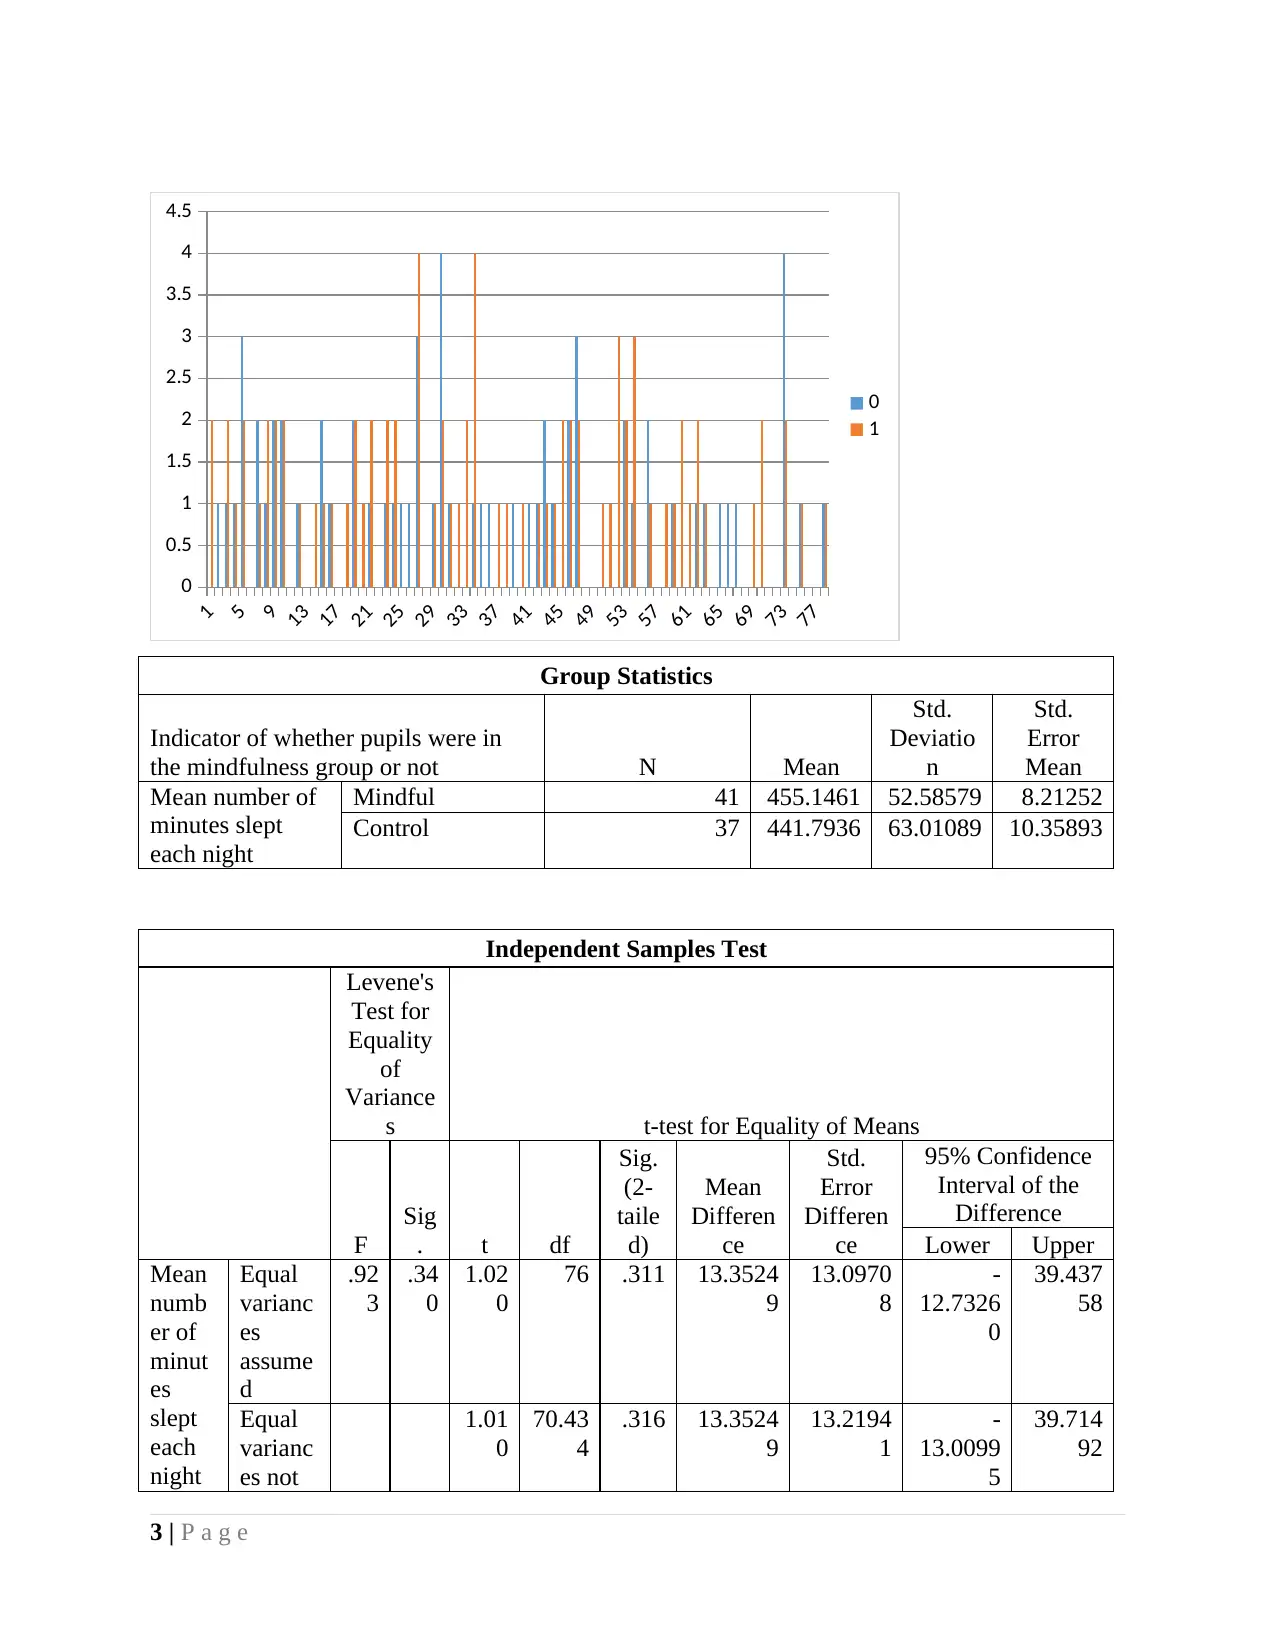
As per the give case study author wants to determine the effect of ‘mindfulness’ classes
on pupils’ sleep patterns during their exams. Regarding this, author has included a sample of 93
children in which 41 are belonged to the group of mindfulness and 37 are relevant to control
group and 15 sample units were not able to give appropriate data(Garland and Garland, 2012).
So, for making comparison author can use t-test which is one of the important parametric
hypothesis test. It is one of the best method for making comparison between two different
samples. Application of T-test is described as under:
Hypothesis 1:
Null hypothesis (H0): There is no difference between mean of sleep pattern between Mindfulness
group and control.
Alternative hypothesis (Ha): There is a specific difference between mean of sleep pattern between
Mindfulness group and control.
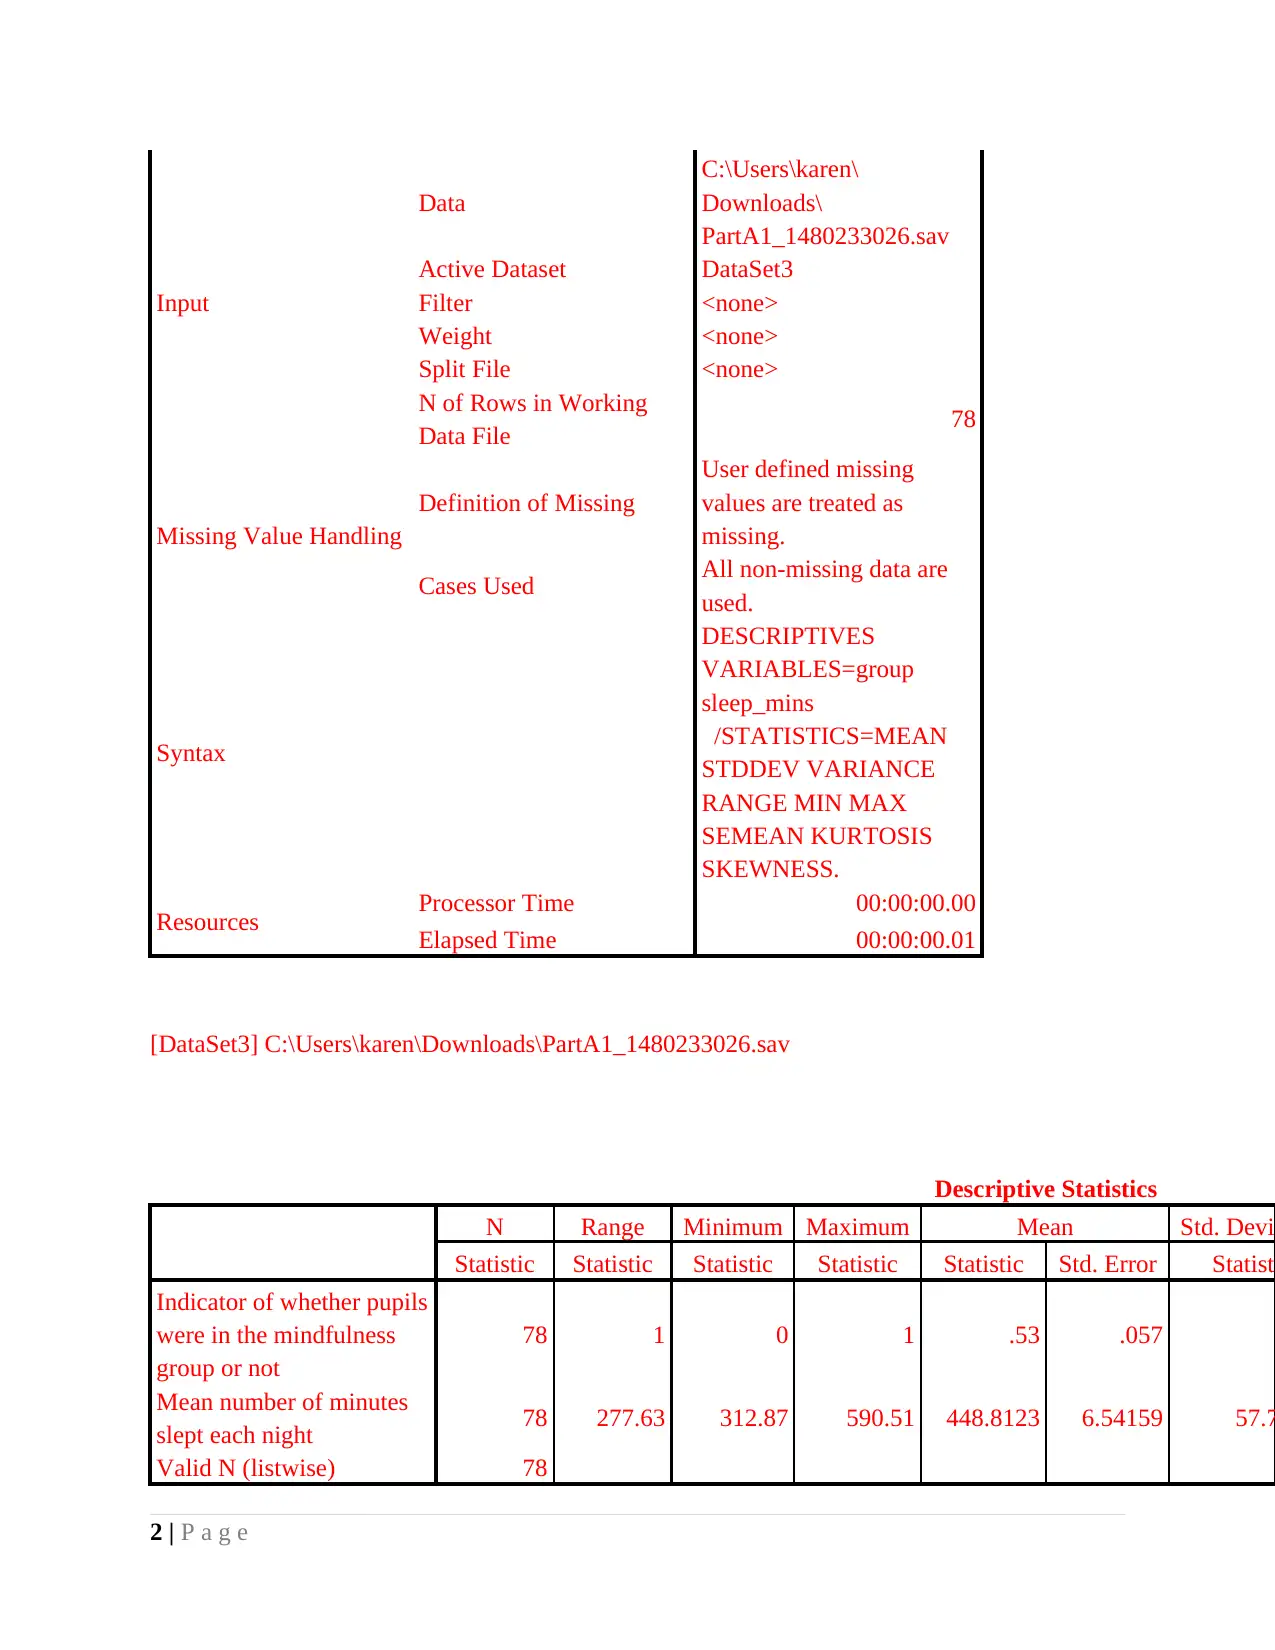
Descriptive statistics
Notes
Output Created 12-JAN-2017 16:04:25
Comments
1 | P a g e
Quantitative methods play important role in analysing collected data in effective manner
which provides assistance in making final decisions using information. Hypothesis testing is one
of the important way to analyse such kind of data(Bhattacharyya, 2009). The current research
project is based on application of quantitative methods for analysing facts and figures. It will
focus on three different cases for applying these methods and make final conclusion of the
report. Along with this, it will also describe strength and limitations of the research designs.
Reflective statement on this research will also be describing in the following paragraphs of the
report.
PART A
As per the give case study author wants to determine the effect of ‘mindfulness’ classes
on pupils’ sleep patterns during their exams. Regarding this, author has included a sample of 93
children in which 41 are belonged to the group of mindfulness and 37 are relevant to control
group and 15 sample units were not able to give appropriate data(Garland and Garland, 2012).
So, for making comparison author can use t-test which is one of the important parametric
hypothesis test. It is one of the best method for making comparison between two different
samples. Application of T-test is described as under:
Hypothesis 1:
Null hypothesis (H0): There is no difference between mean of sleep pattern between Mindfulness
group and control.
Alternative hypothesis (Ha): There is a specific difference between mean of sleep pattern between
Mindfulness group and control.
Descriptive statistics
Notes
Output Created 12-JAN-2017 16:04:25
Comments
1 | P a g e
⊘ This is a preview!⊘
Do you want full access?
Subscribe today to unlock all pages.
Trusted by 1+ million students worldwide
Input
Data
C:\Users\karen\
Downloads\
PartA1_1480233026.sav
Active Dataset DataSet3
Filter <none>
Weight <none>
Split File <none>
N of Rows in Working
Data File 78
Missing Value Handling
Definition of Missing
User defined missing
values are treated as
missing.
Cases Used All non-missing data are
used.
Syntax
DESCRIPTIVES
VARIABLES=group
sleep_mins
/STATISTICS=MEAN
STDDEV VARIANCE
RANGE MIN MAX
SEMEAN KURTOSIS
SKEWNESS.
Resources Processor Time 00:00:00.00
Elapsed Time 00:00:00.01
[DataSet3] C:\Users\karen\Downloads\PartA1_1480233026.sav
Descriptive Statistics
N Range Minimum Maximum Mean Std. Devia
Statistic Statistic Statistic Statistic Statistic Std. Error Statisti
Indicator of whether pupils
were in the mindfulness
group or not
78 1 0 1 .53 .057
Mean number of minutes
slept each night 78 277.63 312.87 590.51 448.8123 6.54159 57.7
Valid N (listwise) 78
2 | P a g e
Paraphrase This Document
Need a fresh take? Get an instant paraphrase of this document with our AI Paraphraser
1
5
9
13
17
21
25
29
33
37
41
45
49
53
57
61
65
69
73
77
0
0.5
1
1.5
2
2.5
3
3.5
4
4.5
0
1
Group Statistics
Indicator of whether pupils were in
the mindfulness group or not N Mean
Std.
Deviatio
n
Std.
Error
Mean
Mean number of
minutes slept
each night
Mindful 41 455.1461 52.58579 8.21252
Control 37 441.7936 63.01089 10.35893
Independent Samples Test
Levene's
Test for
Equality
of
Variance
s t-test for Equality of Means
F
Sig
. t df
Sig.
(2-
taile
d)
Mean
Differen
ce
Std.
Error
Differen
ce
95% Confidence
Interval of the
Difference
Lower Upper
Mean
numb
er of
minut
es
slept
each
night
Equal
varianc
es
assume
d
.92
3
.34
0
1.02
0
76 .311 13.3524
9
13.0970
8
-
12.7326
0
39.437
58
Equal
varianc
es not
1.01
0
70.43
4
.316 13.3524
9
13.2194
1
-
13.0099
5
39.714
92
3 | P a g e
5
9
13
17
21
25
29
33
37
41
45
49
53
57
61
65
69
73
77
0
0.5
1
1.5
2
2.5
3
3.5
4
4.5
0
1
Group Statistics
Indicator of whether pupils were in
the mindfulness group or not N Mean
Std.
Deviatio
n
Std.
Error
Mean
Mean number of
minutes slept
each night
Mindful 41 455.1461 52.58579 8.21252
Control 37 441.7936 63.01089 10.35893
Independent Samples Test
Levene's
Test for
Equality
of
Variance
s t-test for Equality of Means
F
Sig
. t df
Sig.
(2-
taile
d)
Mean
Differen
ce
Std.
Error
Differen
ce
95% Confidence
Interval of the
Difference
Lower Upper
Mean
numb
er of
minut
es
slept
each
night
Equal
varianc
es
assume
d
.92
3
.34
0
1.02
0
76 .311 13.3524
9
13.0970
8
-
12.7326
0
39.437
58
Equal
varianc
es not
1.01
0
70.43
4
.316 13.3524
9
13.2194
1
-
13.0099
5
39.714
92
3 | P a g e
assume
d
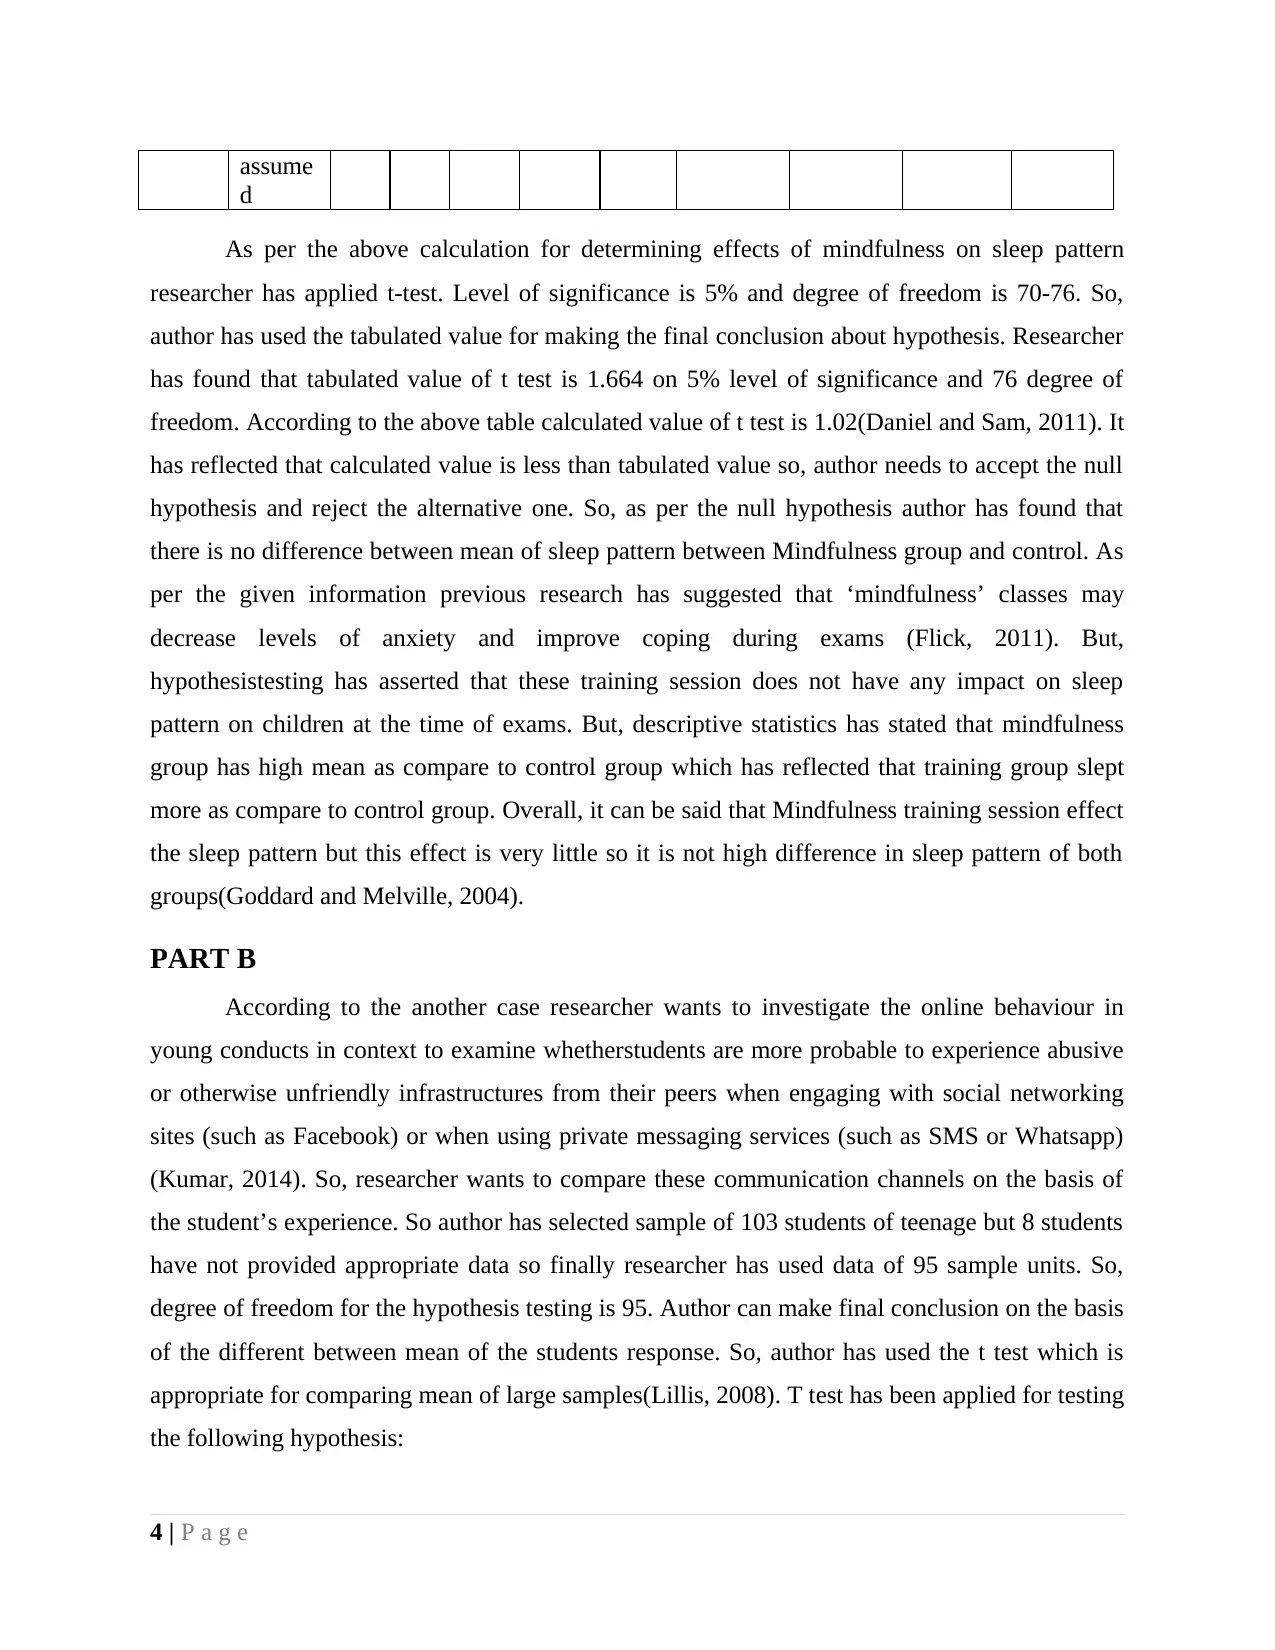
As per the above calculation for determining effects of mindfulness on sleep pattern
researcher has applied t-test. Level of significance is 5% and degree of freedom is 70-76. So,
author has used the tabulated value for making the final conclusion about hypothesis. Researcher
has found that tabulated value of t test is 1.664 on 5% level of significance and 76 degree of
freedom. According to the above table calculated value of t test is 1.02(Daniel and Sam, 2011). It
has reflected that calculated value is less than tabulated value so, author needs to accept the null
hypothesis and reject the alternative one. So, as per the null hypothesis author has found that
there is no difference between mean of sleep pattern between Mindfulness group and control. As
per the given information previous research has suggested that ‘mindfulness’ classes may
decrease levels of anxiety and improve coping during exams (Flick, 2011). But,
hypothesistesting has asserted that these training session does not have any impact on sleep
pattern on children at the time of exams. But, descriptive statistics has stated that mindfulness
group has high mean as compare to control group which has reflected that training group slept
more as compare to control group. Overall, it can be said that Mindfulness training session effect
the sleep pattern but this effect is very little so it is not high difference in sleep pattern of both
groups(Goddard and Melville, 2004).
PART B
According to the another case researcher wants to investigate the online behaviour in
young conducts in context to examine whetherstudents are more probable to experience abusive
or otherwise unfriendly infrastructures from their peers when engaging with social networking
sites (such as Facebook) or when using private messaging services (such as SMS or Whatsapp)
(Kumar, 2014). So, researcher wants to compare these communication channels on the basis of
the student’s experience. So author has selected sample of 103 students of teenage but 8 students
have not provided appropriate data so finally researcher has used data of 95 sample units. So,
degree of freedom for the hypothesis testing is 95. Author can make final conclusion on the basis
of the different between mean of the students response. So, author has used the t test which is
appropriate for comparing mean of large samples(Lillis, 2008). T test has been applied for testing
the following hypothesis:
4 | P a g e
d
As per the above calculation for determining effects of mindfulness on sleep pattern
researcher has applied t-test. Level of significance is 5% and degree of freedom is 70-76. So,
author has used the tabulated value for making the final conclusion about hypothesis. Researcher
has found that tabulated value of t test is 1.664 on 5% level of significance and 76 degree of
freedom. According to the above table calculated value of t test is 1.02(Daniel and Sam, 2011). It
has reflected that calculated value is less than tabulated value so, author needs to accept the null
hypothesis and reject the alternative one. So, as per the null hypothesis author has found that
there is no difference between mean of sleep pattern between Mindfulness group and control. As
per the given information previous research has suggested that ‘mindfulness’ classes may
decrease levels of anxiety and improve coping during exams (Flick, 2011). But,
hypothesistesting has asserted that these training session does not have any impact on sleep
pattern on children at the time of exams. But, descriptive statistics has stated that mindfulness
group has high mean as compare to control group which has reflected that training group slept
more as compare to control group. Overall, it can be said that Mindfulness training session effect
the sleep pattern but this effect is very little so it is not high difference in sleep pattern of both
groups(Goddard and Melville, 2004).
PART B
According to the another case researcher wants to investigate the online behaviour in
young conducts in context to examine whetherstudents are more probable to experience abusive
or otherwise unfriendly infrastructures from their peers when engaging with social networking
sites (such as Facebook) or when using private messaging services (such as SMS or Whatsapp)
(Kumar, 2014). So, researcher wants to compare these communication channels on the basis of
the student’s experience. So author has selected sample of 103 students of teenage but 8 students
have not provided appropriate data so finally researcher has used data of 95 sample units. So,
degree of freedom for the hypothesis testing is 95. Author can make final conclusion on the basis
of the different between mean of the students response. So, author has used the t test which is
appropriate for comparing mean of large samples(Lillis, 2008). T test has been applied for testing
the following hypothesis:
4 | P a g e
⊘ This is a preview!⊘
Do you want full access?
Subscribe today to unlock all pages.
Trusted by 1+ million students worldwide
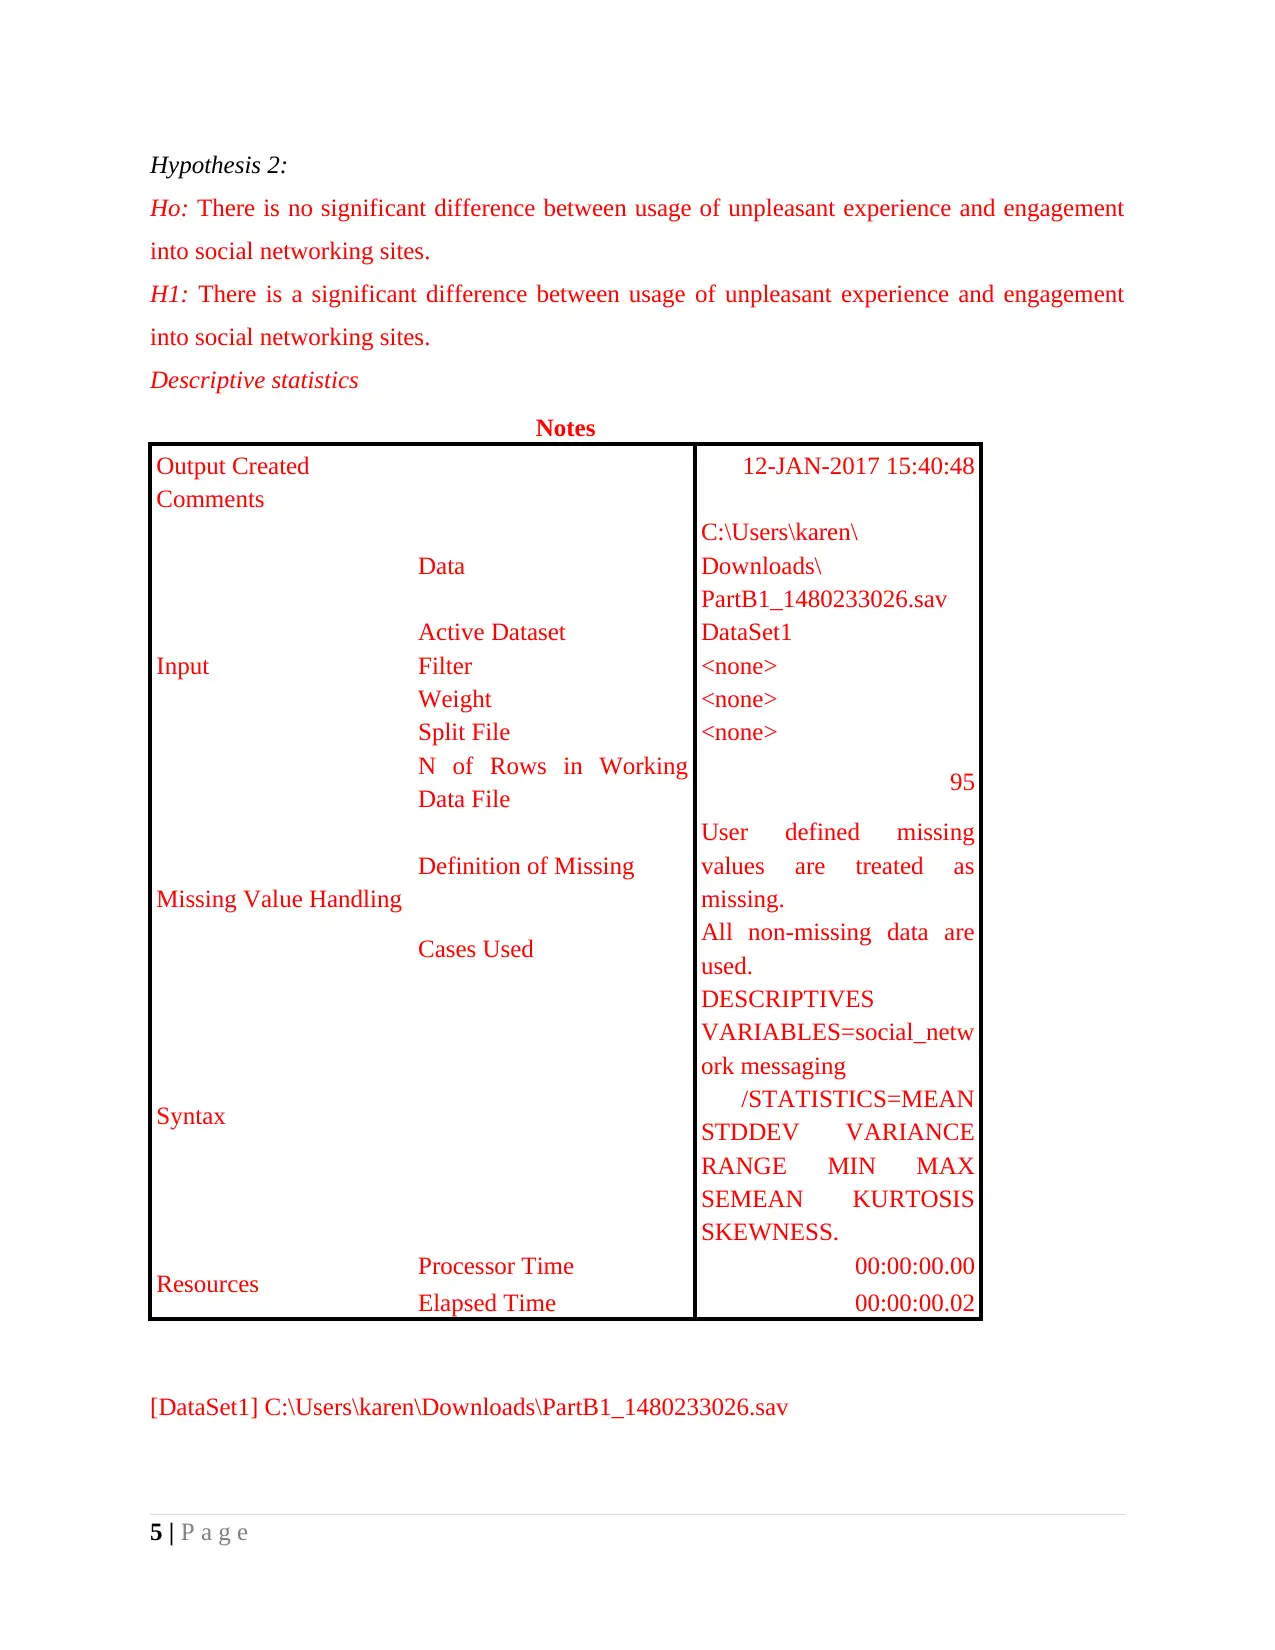
Hypothesis 2:
Ho: There is no significant difference between usage of unpleasant experience and engagement
into social networking sites.
H1: There is a significant difference between usage of unpleasant experience and engagement
into social networking sites.
Descriptive statistics
Notes
Output Created 12-JAN-2017 15:40:48
Comments
Input
Data
C:\Users\karen\
Downloads\
PartB1_1480233026.sav
Active Dataset DataSet1
Filter <none>
Weight <none>
Split File <none>
N of Rows in Working
Data File 95
Missing Value Handling
Definition of Missing
User defined missing
values are treated as
missing.
Cases Used All non-missing data are
used.
Syntax
DESCRIPTIVES
VARIABLES=social_netw
ork messaging
/STATISTICS=MEAN
STDDEV VARIANCE
RANGE MIN MAX
SEMEAN KURTOSIS
SKEWNESS.
Resources Processor Time 00:00:00.00
Elapsed Time 00:00:00.02
[DataSet1] C:\Users\karen\Downloads\PartB1_1480233026.sav
5 | P a g e
Paraphrase This Document
Need a fresh take? Get an instant paraphrase of this document with our AI Paraphraser
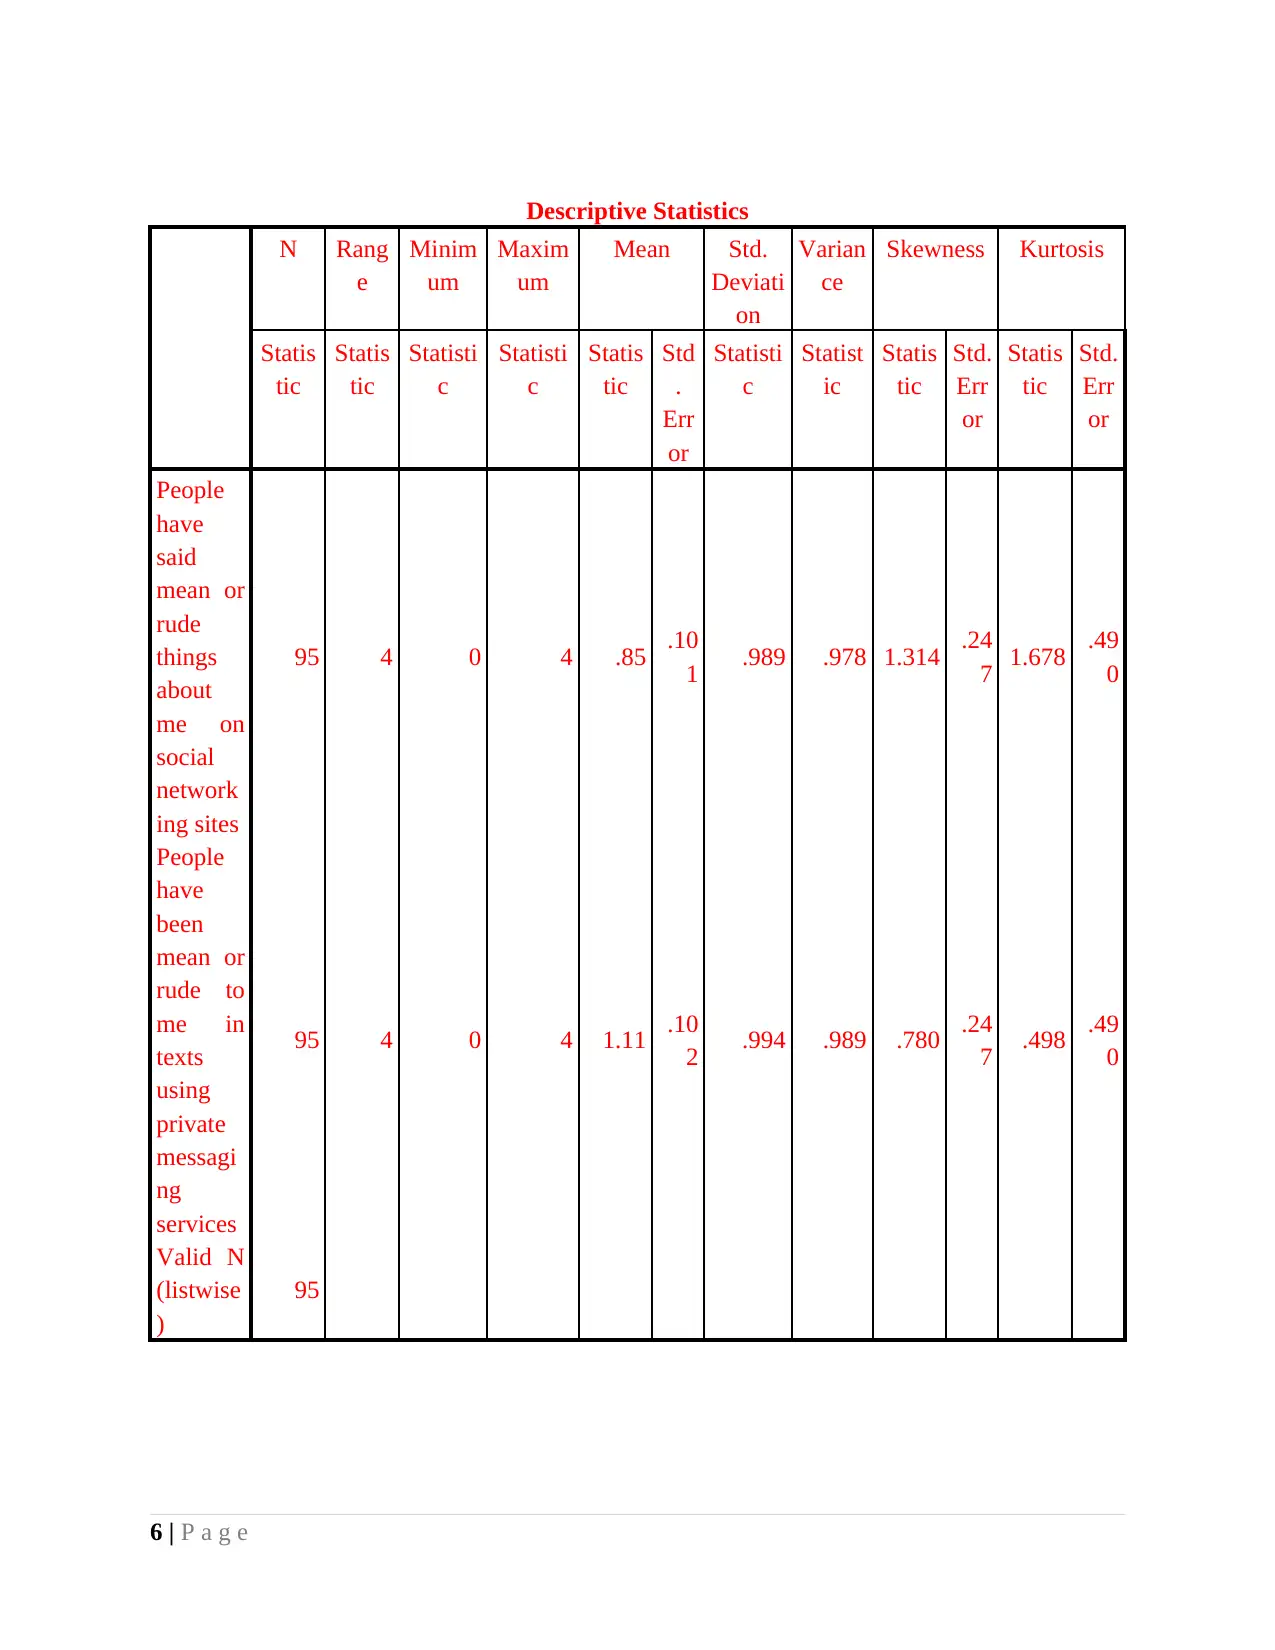
Descriptive Statistics
N Rang
e
Minim
um
Maxim
um
Mean Std.
Deviati
on
Varian
ce
Skewness Kurtosis
Statis
tic
Statis
tic
Statisti
c
Statisti
c
Statis
tic
Std
.
Err
or
Statisti
c
Statist
ic
Statis
tic
Std.
Err
or
Statis
tic
Std.
Err
or
People
have
said
mean or
rude
things
about
me on
social
network
ing sites
95 4 0 4 .85 .10
1 .989 .978 1.314 .24
7 1.678 .49
0
People
have
been
mean or
rude to
me in
texts
using
private
messagi
ng
services
95 4 0 4 1.11 .10
2 .994 .989 .780 .24
7 .498 .49
0
Valid N
(listwise
)
95
6 | P a g e
1
6
11
16
21
26
31
36
41
46
51
56
61
66
71
76
0
0.5
1
1.5
2
2.5
3
3.5
4
4.5
Social networking
Messaging
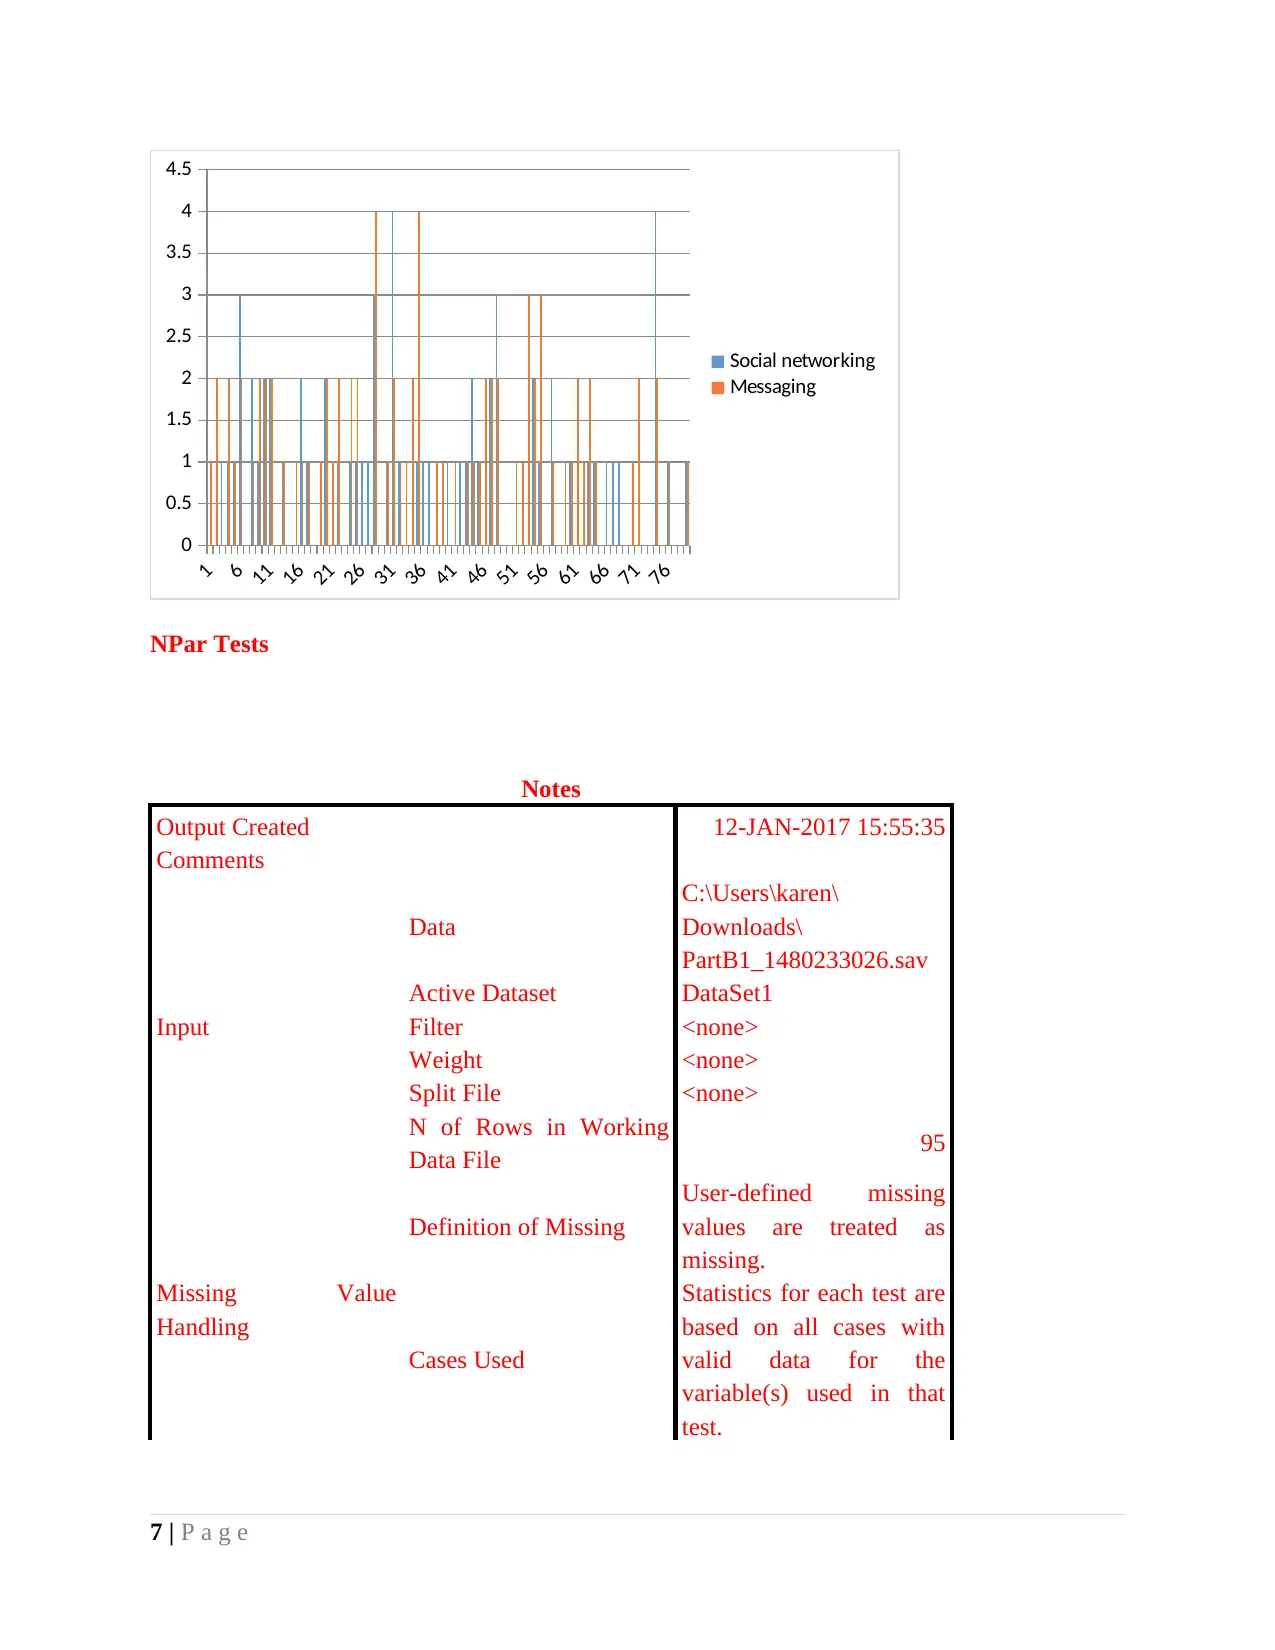
NPar Tests
Notes
Output Created 12-JAN-2017 15:55:35
Comments
Input
Data
C:\Users\karen\
Downloads\
PartB1_1480233026.sav
Active Dataset DataSet1
Filter <none>
Weight <none>
Split File <none>
N of Rows in Working
Data File 95
Missing Value
Handling
Definition of Missing
User-defined missing
values are treated as
missing.
Cases Used
Statistics for each test are
based on all cases with
valid data for the
variable(s) used in that
test.
7 | P a g e
6
11
16
21
26
31
36
41
46
51
56
61
66
71
76
0
0.5
1
1.5
2
2.5
3
3.5
4
4.5
Social networking
Messaging
NPar Tests
Notes
Output Created 12-JAN-2017 15:55:35
Comments
Input
Data
C:\Users\karen\
Downloads\
PartB1_1480233026.sav
Active Dataset DataSet1
Filter <none>
Weight <none>
Split File <none>
N of Rows in Working
Data File 95
Missing Value
Handling
Definition of Missing
User-defined missing
values are treated as
missing.
Cases Used
Statistics for each test are
based on all cases with
valid data for the
variable(s) used in that
test.
7 | P a g e
⊘ This is a preview!⊘
Do you want full access?
Subscribe today to unlock all pages.
Trusted by 1+ million students worldwide
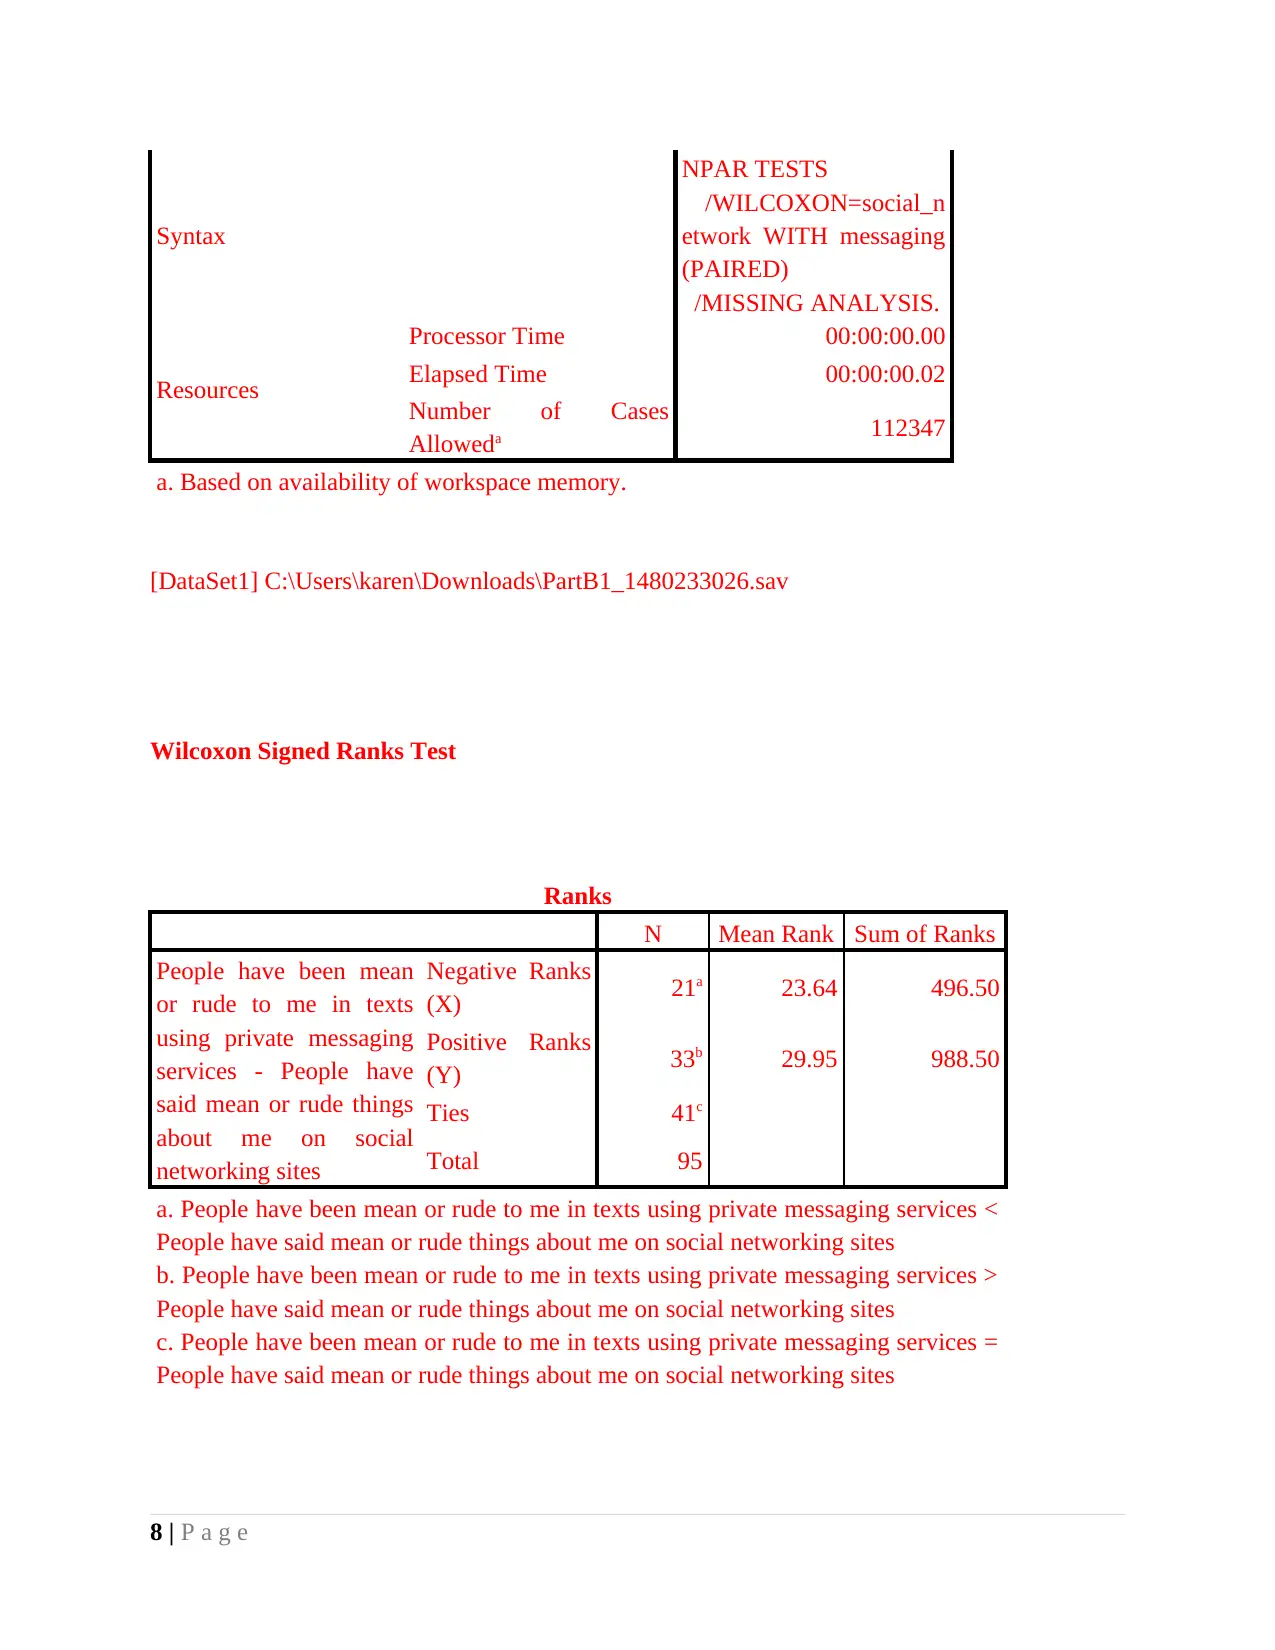
Syntax
NPAR TESTS
/WILCOXON=social_n
etwork WITH messaging
(PAIRED)
/MISSING ANALYSIS.
Resources
Processor Time 00:00:00.00
Elapsed Time 00:00:00.02
Number of Cases
Alloweda 112347
a. Based on availability of workspace memory.
[DataSet1] C:\Users\karen\Downloads\PartB1_1480233026.sav
Wilcoxon Signed Ranks Test
Ranks
N Mean Rank Sum of Ranks
People have been mean
or rude to me in texts
using private messaging
services - People have
said mean or rude things
about me on social
networking sites
Negative Ranks
(X) 21a 23.64 496.50
Positive Ranks
(Y) 33b 29.95 988.50
Ties 41c
Total 95
a. People have been mean or rude to me in texts using private messaging services <
People have said mean or rude things about me on social networking sites
b. People have been mean or rude to me in texts using private messaging services >
People have said mean or rude things about me on social networking sites
c. People have been mean or rude to me in texts using private messaging services =
People have said mean or rude things about me on social networking sites
8 | P a g e
Paraphrase This Document
Need a fresh take? Get an instant paraphrase of this document with our AI Paraphraser

Test Statisticsa
People have
been mean or
rude to me in
texts using
private
messaging
services -
People have
said mean or
rude things
about me on
social
networking
sites
Z -2.226b
Asymp. Sig. (2-
tailed) .026
a. Wilcoxon Signed Ranks Test
b. Based on negative ranks.
From the above calculation, it has been assessed that 95* 21 observations were made.
Along with this, Wilcox sign test presents that difference in the mean rank takes place by 23.64
& 29.95. Thus, by considering this, it can be said that difference in the mean rank of general
population is identified with such figure. Further, table generated through SPSS shows that Z
value is -2.22. In addition to this, such table also presents that n is greater than .026. By taking
into consideration such aspects it can be said that alternative hypothesis is accepted. It shows that
there is significance difference takes place between the median value in relation to usage of
unpleasant experience and engagement into social networking sites. In other words, it can be said
that people had not said wrong things about me on social networking sites such as Facebook and
Whatsapp. By keeping all such factors in mind it can be stated that large number of students does
not experience abusive language on social sites.
9 | P a g e
People have
been mean or
rude to me in
texts using
private
messaging
services -
People have
said mean or
rude things
about me on
social
networking
sites
Z -2.226b
Asymp. Sig. (2-
tailed) .026
a. Wilcoxon Signed Ranks Test
b. Based on negative ranks.
From the above calculation, it has been assessed that 95* 21 observations were made.
Along with this, Wilcox sign test presents that difference in the mean rank takes place by 23.64
& 29.95. Thus, by considering this, it can be said that difference in the mean rank of general
population is identified with such figure. Further, table generated through SPSS shows that Z
value is -2.22. In addition to this, such table also presents that n is greater than .026. By taking
into consideration such aspects it can be said that alternative hypothesis is accepted. It shows that
there is significance difference takes place between the median value in relation to usage of
unpleasant experience and engagement into social networking sites. In other words, it can be said
that people had not said wrong things about me on social networking sites such as Facebook and
Whatsapp. By keeping all such factors in mind it can be stated that large number of students does
not experience abusive language on social sites.
9 | P a g e
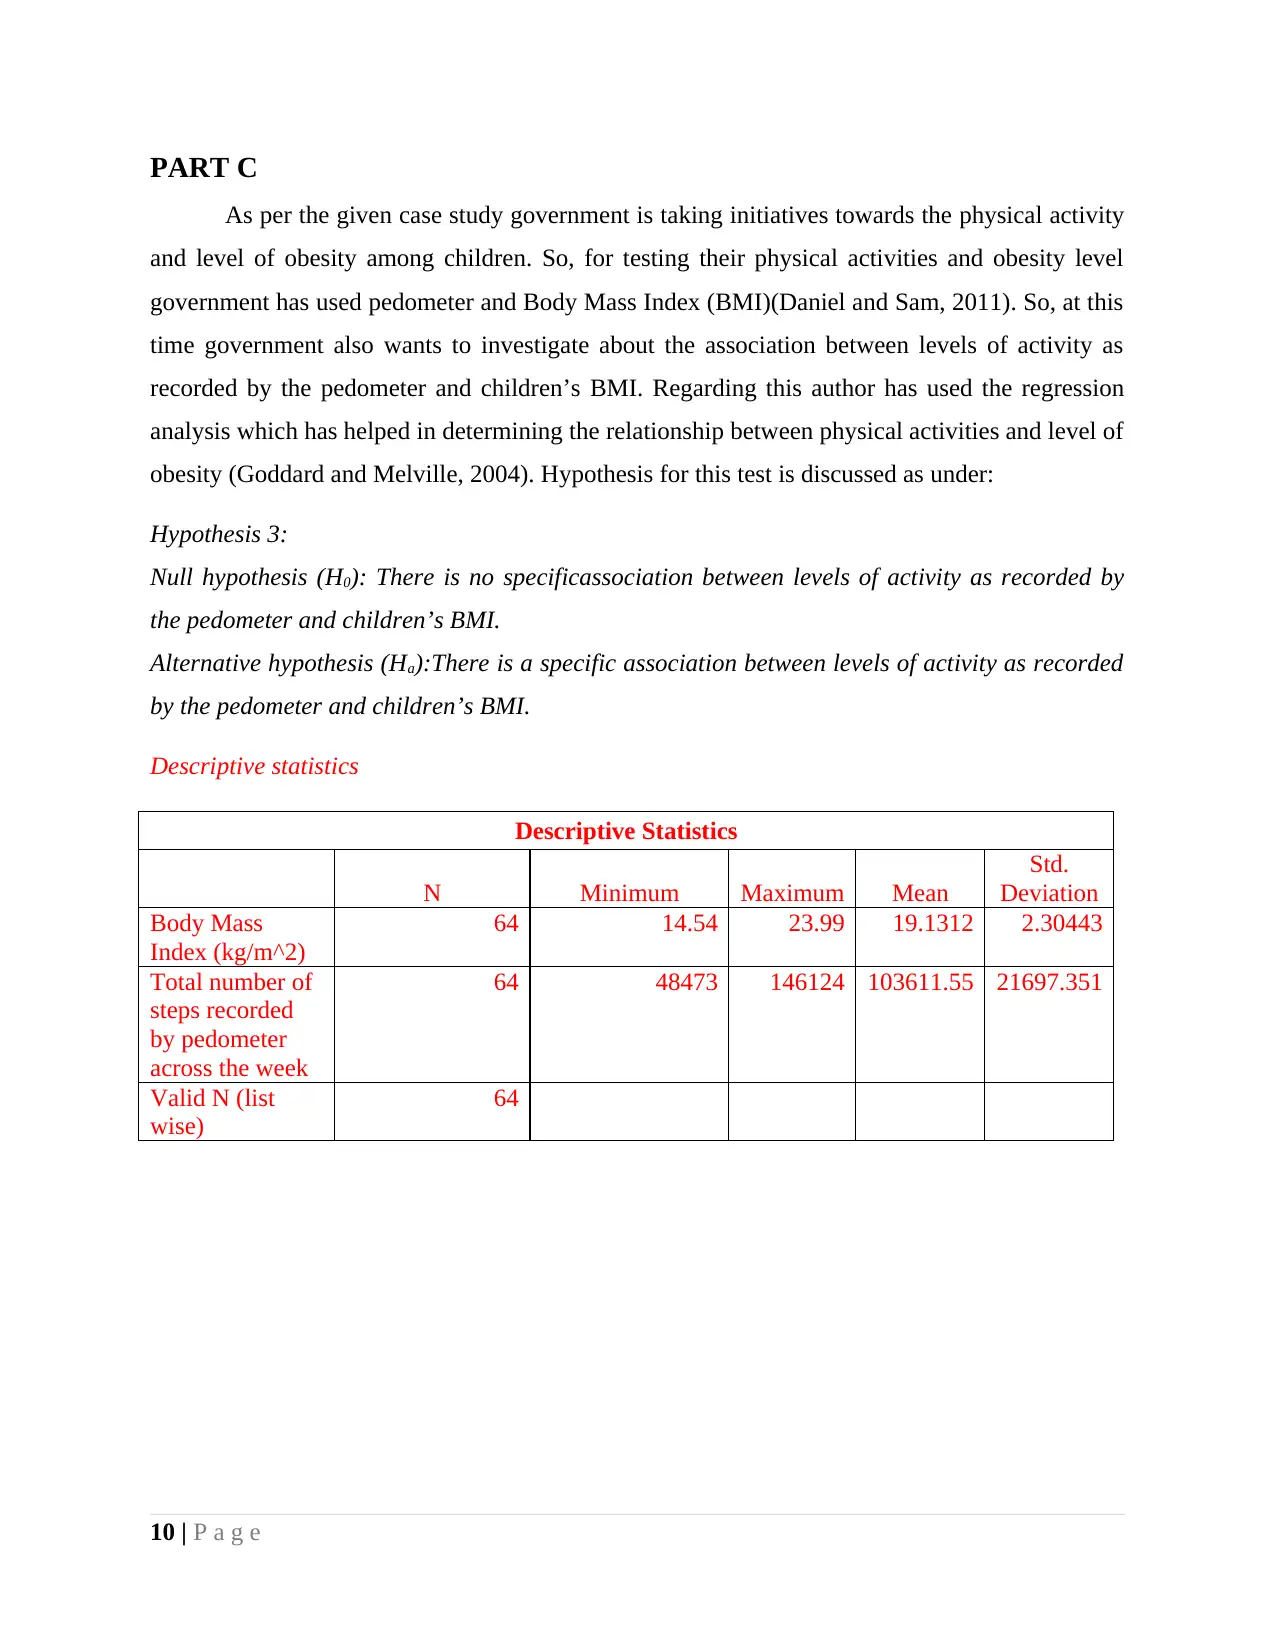
PART C
As per the given case study government is taking initiatives towards the physical activity
and level of obesity among children. So, for testing their physical activities and obesity level
government has used pedometer and Body Mass Index (BMI)(Daniel and Sam, 2011). So, at this
time government also wants to investigate about the association between levels of activity as
recorded by the pedometer and children’s BMI. Regarding this author has used the regression
analysis which has helped in determining the relationship between physical activities and level of
obesity (Goddard and Melville, 2004). Hypothesis for this test is discussed as under:
Hypothesis 3:
Null hypothesis (H0): There is no specificassociation between levels of activity as recorded by
the pedometer and children’s BMI.
Alternative hypothesis (Ha):There is a specific association between levels of activity as recorded
by the pedometer and children’s BMI.
Descriptive statistics
Descriptive Statistics
N Minimum Maximum Mean
Std.
Deviation
Body Mass
Index (kg/m^2)
64 14.54 23.99 19.1312 2.30443
Total number of
steps recorded
by pedometer
across the week
64 48473 146124 103611.55 21697.351
Valid N (list
wise)
64
10 | P a g e
⊘ This is a preview!⊘
Do you want full access?
Subscribe today to unlock all pages.
Trusted by 1+ million students worldwide
1 out of 17
Related Documents


Your All-in-One AI-Powered Toolkit for Academic Success.
+13062052269
info@desklib.com
Available 24*7 on WhatsApp / Email
![[object Object]](/_next/static/media/star-bottom.7253800d.svg)
Unlock your academic potential
Copyright © 2020–2026 A2Z Services. All Rights Reserved. Developed and managed by ZUCOL.