Yield Curves of US and Europe
Added on 2023-01-05
12 Pages4159 Words64 Views
School
Program code BP314
Course/unit name FINANCIAL MARKET
Course/unit code BAFI1002
Name of lecturer/teacher
Name of tutor/marker
Student/s
Family name
Declaration and statement of authorship
1. I/we hold a copy of this work that can be produced if the original is lost/damaged.
2. This work is my/our original work and no part of it has been copied from any other
student’s work or from any other source except where due acknowledgement is made.
3. No part of this work has been written for me/us by any other person except where such
collaboration has been authorised by the lecturer/teacher concerned.
4. I/we have correctly acknowledged the re-use of any of my/our own previously submitted work within
this submission.
5. I/we give permission for this work to be reproduced, communicated, compared and archived for the
purpose of detecting plagiarism.
6. I/we give permission for a copy of my/our marked work to be retained by the school for
review and comparison, including review by external examiners.
I/we understand that:
7. plagiarism is the presentation of the work, idea or creation of another person as though it is
my/our own. It is a form of cheating and is a very serious academic offence that may lead to
exclusion from the University. Plagiarised material can be drawn from, and presented in,
written, graphic and visual form, including electronic data and oral presentations. Plagiarism
occurs when the origin of the material used is not appropriately cited.
8. plagiarism includes the act of assisting or allowing another person to plagiarise or to copy my/our
work.
Student signature/s
I/we declare that I/we have read and understood the declaration and statement of authorship.
1NGUYEN THI THU TAM
Further information relating to the penalties for plagiarism, that range from a notation on your
student file to expulsion from the University, is contained in the Student Conduct Regulation,
Division 2. Academic Misconduct and the Assessment Policy that are available on the Policies
and Procedures website at rmit.edu.au/about/governance-management/policies.
Copies of this form can be downloaded from the student forms webpage at
rmit.edu.au/students/student-essentials/forms/assessment-forms.
Financial Market Assessment 3
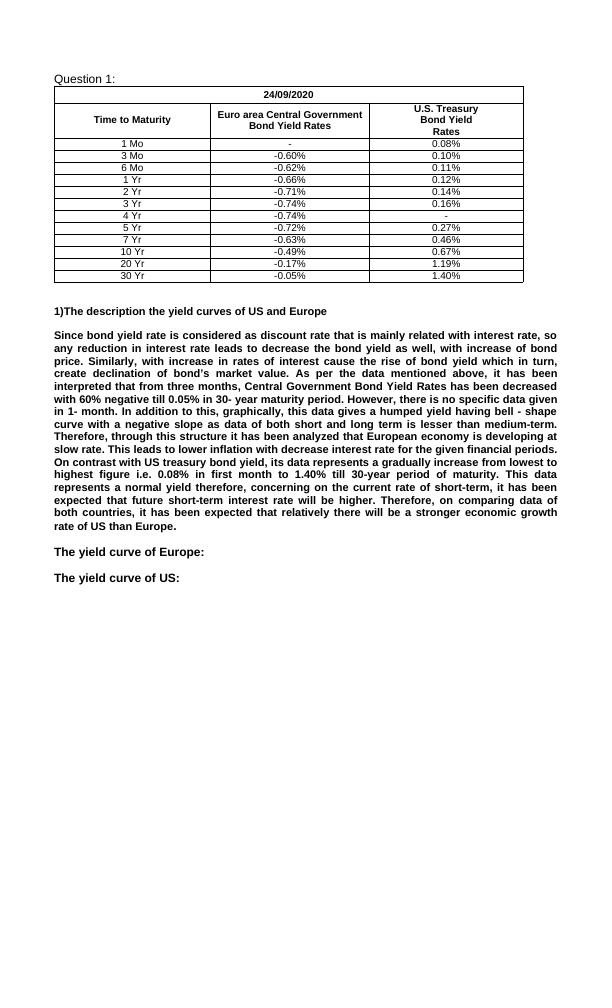
Question 1:
24/09/2020
Time to Maturity Euro area Central Government
Bond Yield Rates
U.S. Treasury
Bond Yield
Rates
1 Mo - 0.08%
3 Mo -0.60% 0.10%
6 Mo -0.62% 0.11%
1 Yr -0.66% 0.12%
2 Yr -0.71% 0.14%
3 Yr -0.74% 0.16%
4 Yr -0.74% -
5 Yr -0.72% 0.27%
7 Yr -0.63% 0.46%
10 Yr -0.49% 0.67%
20 Yr -0.17% 1.19%
30 Yr -0.05% 1.40%
1)The description the yield curves of US and Europe
Since bond yield rate is considered as discount rate that is mainly related with interest rate, so
any reduction in interest rate leads to decrease the bond yield as well, with increase of bond
price. Similarly, with increase in rates of interest cause the rise of bond yield which in turn,
create declination of bond’s market value. As per the data mentioned above, it has been
interpreted that from three months, Central Government Bond Yield Rates has been decreased
with 60% negative till 0.05% in 30- year maturity period. However, there is no specific data given
in 1- month. In addition to this, graphically, this data gives a humped yield having bell - shape
curve with a negative slope as data of both short and long term is lesser than medium-term.
Therefore, through this structure it has been analyzed that European economy is developing at
slow rate. This leads to lower inflation with decrease interest rate for the given financial periods.
On contrast with US treasury bond yield, its data represents a gradually increase from lowest to
highest figure i.e. 0.08% in first month to 1.40% till 30-year period of maturity. This data
represents a normal yield therefore, concerning on the current rate of short-term, it has been
expected that future short-term interest rate will be higher. Therefore, on comparing data of
both countries, it has been expected that relatively there will be a stronger economic growth
rate of US than Europe.
The yield curve of Europe:
The yield curve of US:
QUESTION 1 (continued)
1) Calculate the market price of each bond on 24th September 2020 that issued by North Polar
Ltd., a European company specialises in manufacturing semiconductors, using the yield
curve data provided in the table above. What is the current total value of minimum application?
Corporate Bonds Fact Sheet
Issuer North Polar Ltd.
Issuing date 24th September 2020
Bond expiration date 24th September 2025
Face value € 1000 per bond.
Minimum application 50 Bonds (€ 50,000)
Interest rate Floating Interest Rate. The Interest Rate is the sum of the
Market Rate plus the Margin.
Coupon rate (annual) Central Government Bond Yield + 1.86% p.a.
Coupon payment Annually (coupon payment is paid on 10th July every year)
Market Yield 4.5%
[4 marks]
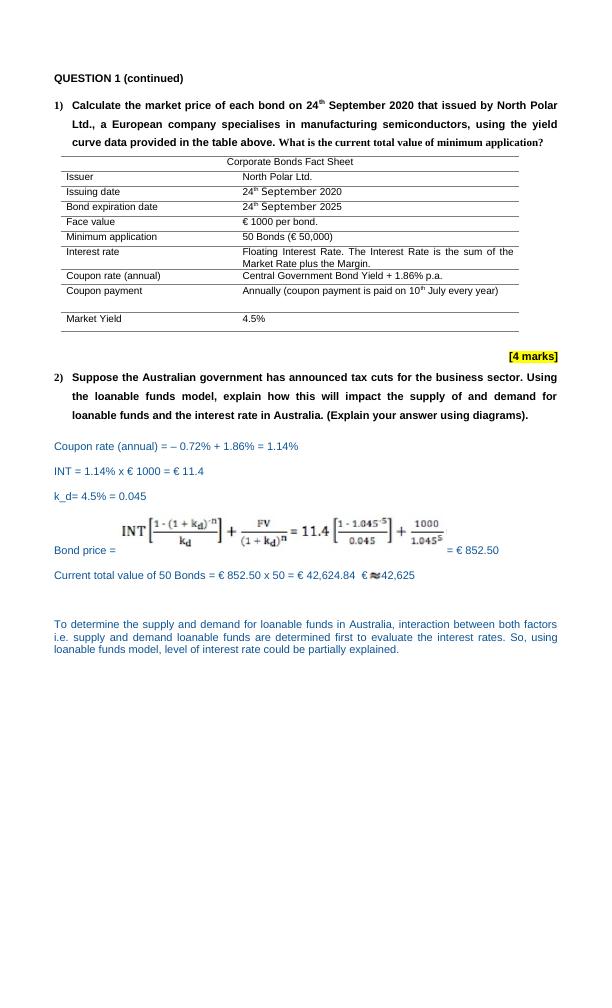
2) Suppose the Australian government has announced tax cuts for the business sector. Using
the loanable funds model, explain how this will impact the supply of and demand for
loanable funds and the interest rate in Australia. (Explain your answer using diagrams).
Coupon rate (annual) = – 0.72% + 1.86% = 1.14%
INT = 1.14% x € 1000 = € 11.4
k_d= 4.5% = 0.045
Bond price = = € 852.50
Current total value of 50 Bonds = € 852.50 x 50 = € 42,624.84 € 42,625
To determine the supply and demand for loanable funds in Australia, interaction between both factors
i.e. supply and demand loanable funds are determined first to evaluate the interest rates. So, using
loanable funds model, level of interest rate could be partially explained.
1) Calculate the market price of each bond on 24th September 2020 that issued by North Polar
Ltd., a European company specialises in manufacturing semiconductors, using the yield
curve data provided in the table above. What is the current total value of minimum application?
Corporate Bonds Fact Sheet
Issuer North Polar Ltd.
Issuing date 24th September 2020
Bond expiration date 24th September 2025
Face value € 1000 per bond.
Minimum application 50 Bonds (€ 50,000)
Interest rate Floating Interest Rate. The Interest Rate is the sum of the
Market Rate plus the Margin.
Coupon rate (annual) Central Government Bond Yield + 1.86% p.a.
Coupon payment Annually (coupon payment is paid on 10th July every year)
Market Yield 4.5%
[4 marks]
2) Suppose the Australian government has announced tax cuts for the business sector. Using
the loanable funds model, explain how this will impact the supply of and demand for
loanable funds and the interest rate in Australia. (Explain your answer using diagrams).
Coupon rate (annual) = – 0.72% + 1.86% = 1.14%
INT = 1.14% x € 1000 = € 11.4
k_d= 4.5% = 0.045
Bond price = = € 852.50
Current total value of 50 Bonds = € 852.50 x 50 = € 42,624.84 € 42,625
To determine the supply and demand for loanable funds in Australia, interaction between both factors
i.e. supply and demand loanable funds are determined first to evaluate the interest rates. So, using
loanable funds model, level of interest rate could be partially explained.
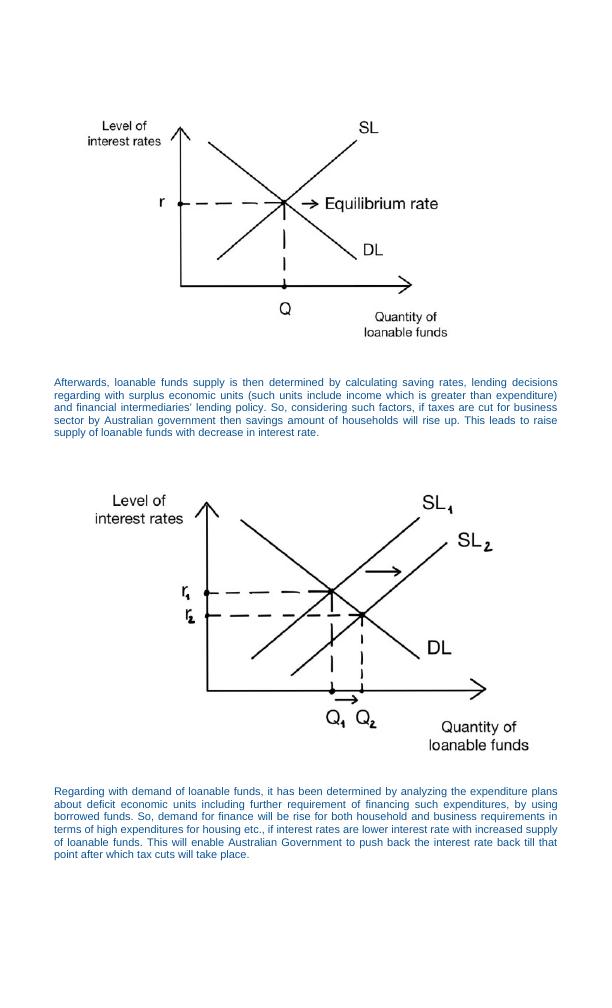
Afterwards, loanable funds supply is then determined by calculating saving rates, lending decisions
regarding with surplus economic units (such units include income which is greater than expenditure)
and financial intermediaries’ lending policy. So, considering such factors, if taxes are cut for business
sector by Australian government then savings amount of households will rise up. This leads to raise
supply of loanable funds with decrease in interest rate.
Regarding with demand of loanable funds, it has been determined by analyzing the expenditure plans
about deficit economic units including further requirement of financing such expenditures, by using
borrowed funds. So, demand for finance will be rise for both household and business requirements in
terms of high expenditures for housing etc., if interest rates are lower interest rate with increased supply
of loanable funds. This will enable Australian Government to push back the interest rate back till that
point after which tax cuts will take place.
End of preview
Want to access all the pages? Upload your documents or become a member.
Related Documents
ACCT2127: Accounting for Management Decisionlg...
|11
|2728
|80
Design Layout of Warehouse and Distribution Centrelg...
|16
|4316
|45
ISYS3374 - Business Analytics Assignmentlg...
|15
|3290
|199
CAR20001 Future Work Skills Assignment 2 Labour Market (Employer Option)lg...
|15
|3708
|372
Individual Assignment - Doclg...
|7
|2161
|135
Assignment 2 Instructionslg...
|10
|2714
|190