Elderberry Supplement Effects Analysis
VerifiedAdded on 2020/02/19
|13
|2455
|46
AI Summary
This assignment examines the effectiveness of elderberry supplements in reducing the number of cold days and symptom severity. Students will conduct hypothesis tests using independent t-tests to compare the Elderberry group to a Placebo group, analyzing data on cold days and symptom scores. The results will be presented with confidence intervals and p-values, leading to conclusions about the statistical significance of the observed differences.
Contribute Materials
Your contribution can guide someone’s learning journey. Share your
documents today.
Mathematics Assignment
Name
University
3rd September 2017
Name
University
3rd September 2017
Secure Best Marks with AI Grader
Need help grading? Try our AI Grader for instant feedback on your assignments.
Introduction
This study sought to critically analyze the outcomes of a study1 that sought to identify whether
supplementation with capsules containing extracts of elderberry can have helpful impacts for air
travelers. Specifically, the study tested whether black elderberry extricate is viable in
counteracting respiratory manifestations, and whether it can likewise positively affect the general
physical soundness of explorers utilizing whole deal business flights as their method of transport.
Methods
Participants for this study were recruited using travel agencies as well as radio, newspaper and
TV ads. They were all at least 18 years of age and in good physical health. Those suffering from
respiratory diseases e.g. asthma or any condition that could compromise the results of the study
or else taking specific medications regularly e.g. antihistamines or anti-inflammatory drugs were
excluded from the study. All study participants were economy class passengers travelling from
Australia to an overseas destination on a minimum 7-hour flight and a minimum stay of four
days at their destination. Volunteers who met the inclusion criteria were randomly assigned to
either take capsules containing elderberry extract or a placebo. Key analysis points were two
days before and four days after travel. Over the entire study period, participants maintained a
diary to record cold symptoms, as well as additional health issues or disease symptoms. At key
analysis points participants also completed questionnaires based on which a number of measures
were derived for further analysis.
2 | P a g e
Results
Results of 283 participants appeared to follow a symmetric distribution as show in the
descriptive statistics summary table where we observed the kurtosis and skewness values to be
close to zero. According to the descriptive statistic of the sample the mean BMI score for
Elderberry group was found to be 25.581 while that of the Placebo group was 24.946. There was
no significant difference in the scores for two days before travel (M=55.42, SD=10.92) and four
days after travel (M=54.94, SD=12.13) conditions; t(143)=0.49, p = 0.625.
In the second part of this study, we performed an independent samples t-test to compare the
mean number of cold days for Elderberry group and that of the Placebo group. Results showed
that the mean number of day for the Elderberry group (M = 4.67, SD = 2.27, N = 12) was not
significantly different from the Placebo group (M = 6.94, SD = 3.65, N = 17), t(27) = -1.91, p
> .05, two-tailed. In the other section of part two, an independent samples t-test was performed
comparing the mean symptom scores for Elderberry group and that of the Placebo group. Results
showed that the mean symptom scores for the Elderberry group (M = 21.40, SD = 10.10, N = 12)
was significantly different from the Placebo group (M = 37.50, SD = 20.00, N = 17), t(27) = -
2.56, p < .05, two-tailed.
Discussion
This study sought to understand the effect of Elderberry on some key concepts that affect the
human health. The paper first compared the Physical Health Composite Scores (PCS) of two
groups of individuals (two days before travel and four days after travel). For the Elderberry
group, there was no significant differences in the scores before and after. However, there was
significant difference in the scores before and after for the placebo group. When it came to
3 | P a g e
compare the mean number of cold days between Elderberry and placebo, it was again found to
be no significant difference in the mean number of days for the two groups but there was
significant difference in the symptom scores for the two groups.
Conclusion
Results showed that there is no enough statistical evidence to conclude that the population mean
PCS scores for two days before travel are different from the means scores four days after travel
for the treatment group (Elderberry) however, for the control group (Placebo), there was enough
statistical evidence to conclude that the population mean PCS scores for two days before travel
are different from the means scores four days after travel.
4 | P a g e
Secure Best Marks with AI Grader
Need help grading? Try our AI Grader for instant feedback on your assignments.
Appendix
Question 1 (28 marks)
(a) (6 marks) We wish to test the effects of elderberry supplementation on health of air
travelers. However, before proceeding we should check whether our two groups of
participants have similar characteristics. Use Minitab to obtain descriptive statistics and
boxplots of BMI scores by treatment group. Ensure that appropriate axis labels as well as
a meaningful title is included with your boxplots. For full marks show all your output
here. Do there appear to be any differences in BMI for the two treatment groups? How do
you know? Explain briefly by referring to relevant summary measures and features of
your boxplots.
Answers
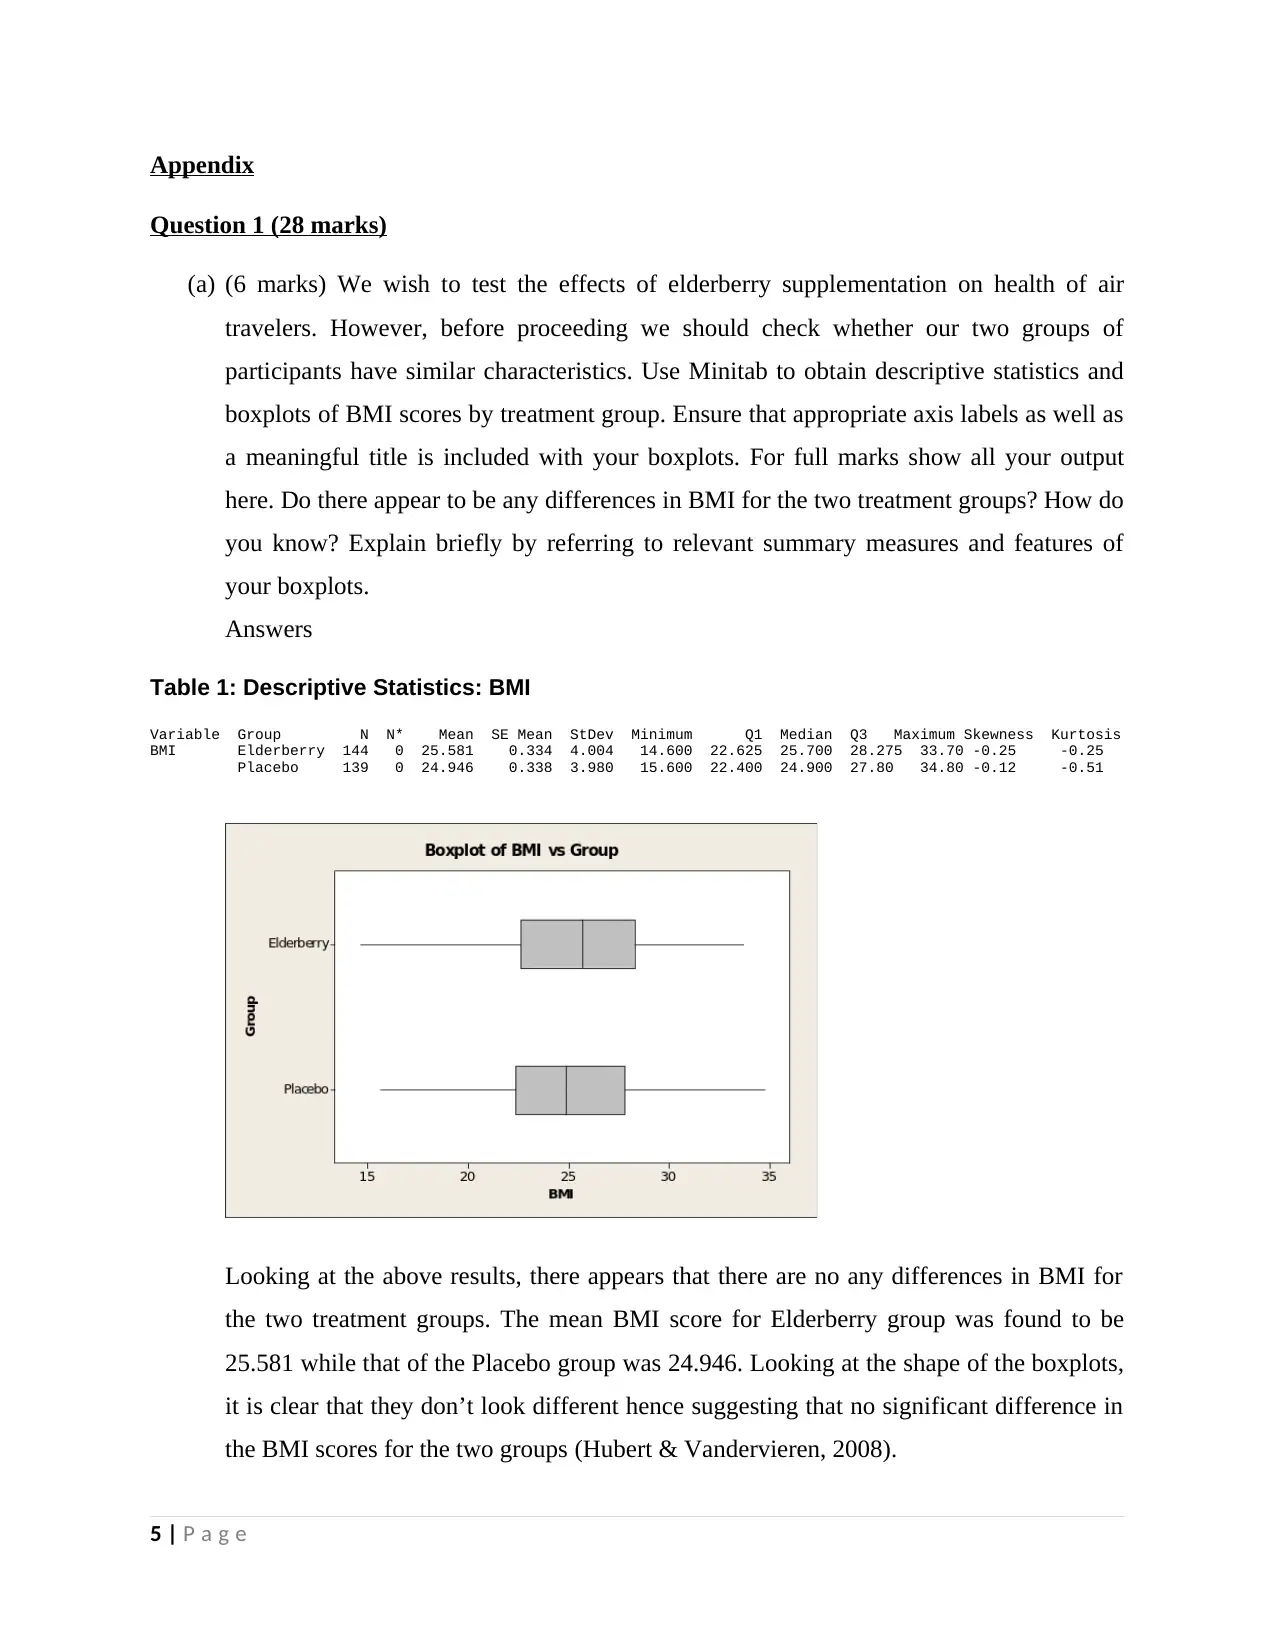
Table 1: Descriptive Statistics: BMI
Variable Group N N* Mean SE Mean StDev Minimum Q1 Median Q3 Maximum Skewness Kurtosis
BMI Elderberry 144 0 25.581 0.334 4.004 14.600 22.625 25.700 28.275 33.70 -0.25 -0.25
Placebo 139 0 24.946 0.338 3.980 15.600 22.400 24.900 27.80 34.80 -0.12 -0.51
Looking at the above results, there appears that there are no any differences in BMI for
the two treatment groups. The mean BMI score for Elderberry group was found to be
25.581 while that of the Placebo group was 24.946. Looking at the shape of the boxplots,
it is clear that they don’t look different hence suggesting that no significant difference in
the BMI scores for the two groups (Hubert & Vandervieren, 2008).
5 | P a g e
Question 1 (28 marks)
(a) (6 marks) We wish to test the effects of elderberry supplementation on health of air
travelers. However, before proceeding we should check whether our two groups of
participants have similar characteristics. Use Minitab to obtain descriptive statistics and
boxplots of BMI scores by treatment group. Ensure that appropriate axis labels as well as
a meaningful title is included with your boxplots. For full marks show all your output
here. Do there appear to be any differences in BMI for the two treatment groups? How do
you know? Explain briefly by referring to relevant summary measures and features of
your boxplots.
Answers
Table 1: Descriptive Statistics: BMI
Variable Group N N* Mean SE Mean StDev Minimum Q1 Median Q3 Maximum Skewness Kurtosis
BMI Elderberry 144 0 25.581 0.334 4.004 14.600 22.625 25.700 28.275 33.70 -0.25 -0.25
Placebo 139 0 24.946 0.338 3.980 15.600 22.400 24.900 27.80 34.80 -0.12 -0.51
Looking at the above results, there appears that there are no any differences in BMI for
the two treatment groups. The mean BMI score for Elderberry group was found to be
25.581 while that of the Placebo group was 24.946. Looking at the shape of the boxplots,
it is clear that they don’t look different hence suggesting that no significant difference in
the BMI scores for the two groups (Hubert & Vandervieren, 2008).
5 | P a g e
(b) (2 marks) Long-haul air travel can be exhausting. We want to know whether elderberry
supplementation has any effect on the overall physical health of air travelers. In
particular, we are interested in comparing Physical Health Composite Scores (PCS) from
two days before travel to those obtained four days after travel. Should a matched pairs
procedure or a two-sample t procedure be applied? Justify your answer briefly.
Answer
Matched pairs procedure should be used; this is because data on two measurements were
on each person before and after.
(c) Hypothesis Test
STATE: We will test the claim that elderberry supplementation influences Physical
Health Composite Scores (PCS) i.e. the PCS for two days before travel to those obtained
four days after travel are same.
FORMULATE: We will test the following hypotheses at 5% significance level
Matched Pair
Differences: Before – After
H0 : μd =0
H1 : μd ≠ 0
α=0.05
SOLVE: We first check the requirements. Assume that tablets were randomly selected
for testing. The sample is large (n = 144 > 30) hence assumption of normality was made.
Normality test also confirmed that the sample can be assumed to come from a Normal
population.
We will perform paired t-test
The following Minitab output has been obtained:
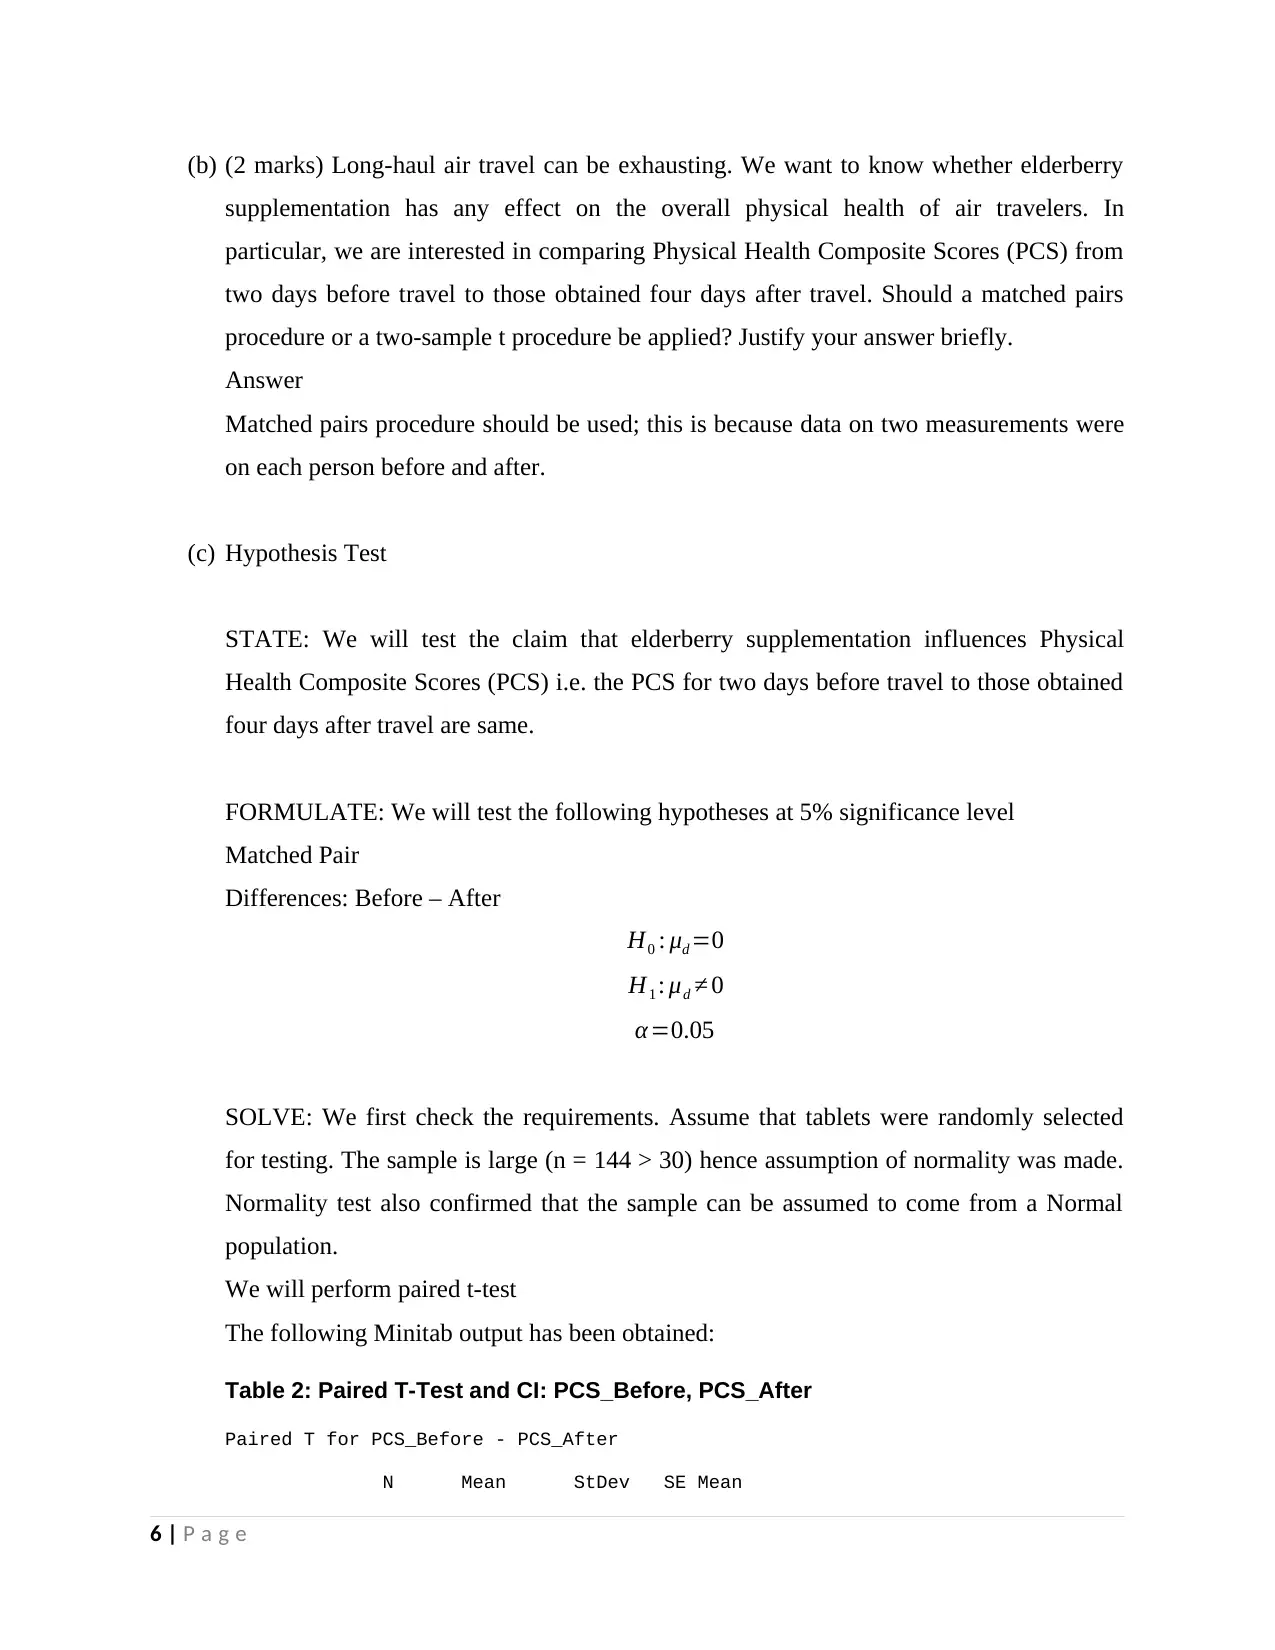
Table 2: Paired T-Test and CI: PCS_Before, PCS_After
Paired T for PCS_Before - PCS_After
N Mean StDev SE Mean
6 | P a g e
supplementation has any effect on the overall physical health of air travelers. In
particular, we are interested in comparing Physical Health Composite Scores (PCS) from
two days before travel to those obtained four days after travel. Should a matched pairs
procedure or a two-sample t procedure be applied? Justify your answer briefly.
Answer
Matched pairs procedure should be used; this is because data on two measurements were
on each person before and after.
(c) Hypothesis Test
STATE: We will test the claim that elderberry supplementation influences Physical
Health Composite Scores (PCS) i.e. the PCS for two days before travel to those obtained
four days after travel are same.
FORMULATE: We will test the following hypotheses at 5% significance level
Matched Pair
Differences: Before – After
H0 : μd =0
H1 : μd ≠ 0
α=0.05
SOLVE: We first check the requirements. Assume that tablets were randomly selected
for testing. The sample is large (n = 144 > 30) hence assumption of normality was made.
Normality test also confirmed that the sample can be assumed to come from a Normal
population.
We will perform paired t-test
The following Minitab output has been obtained:
Table 2: Paired T-Test and CI: PCS_Before, PCS_After
Paired T for PCS_Before - PCS_After
N Mean StDev SE Mean
6 | P a g e
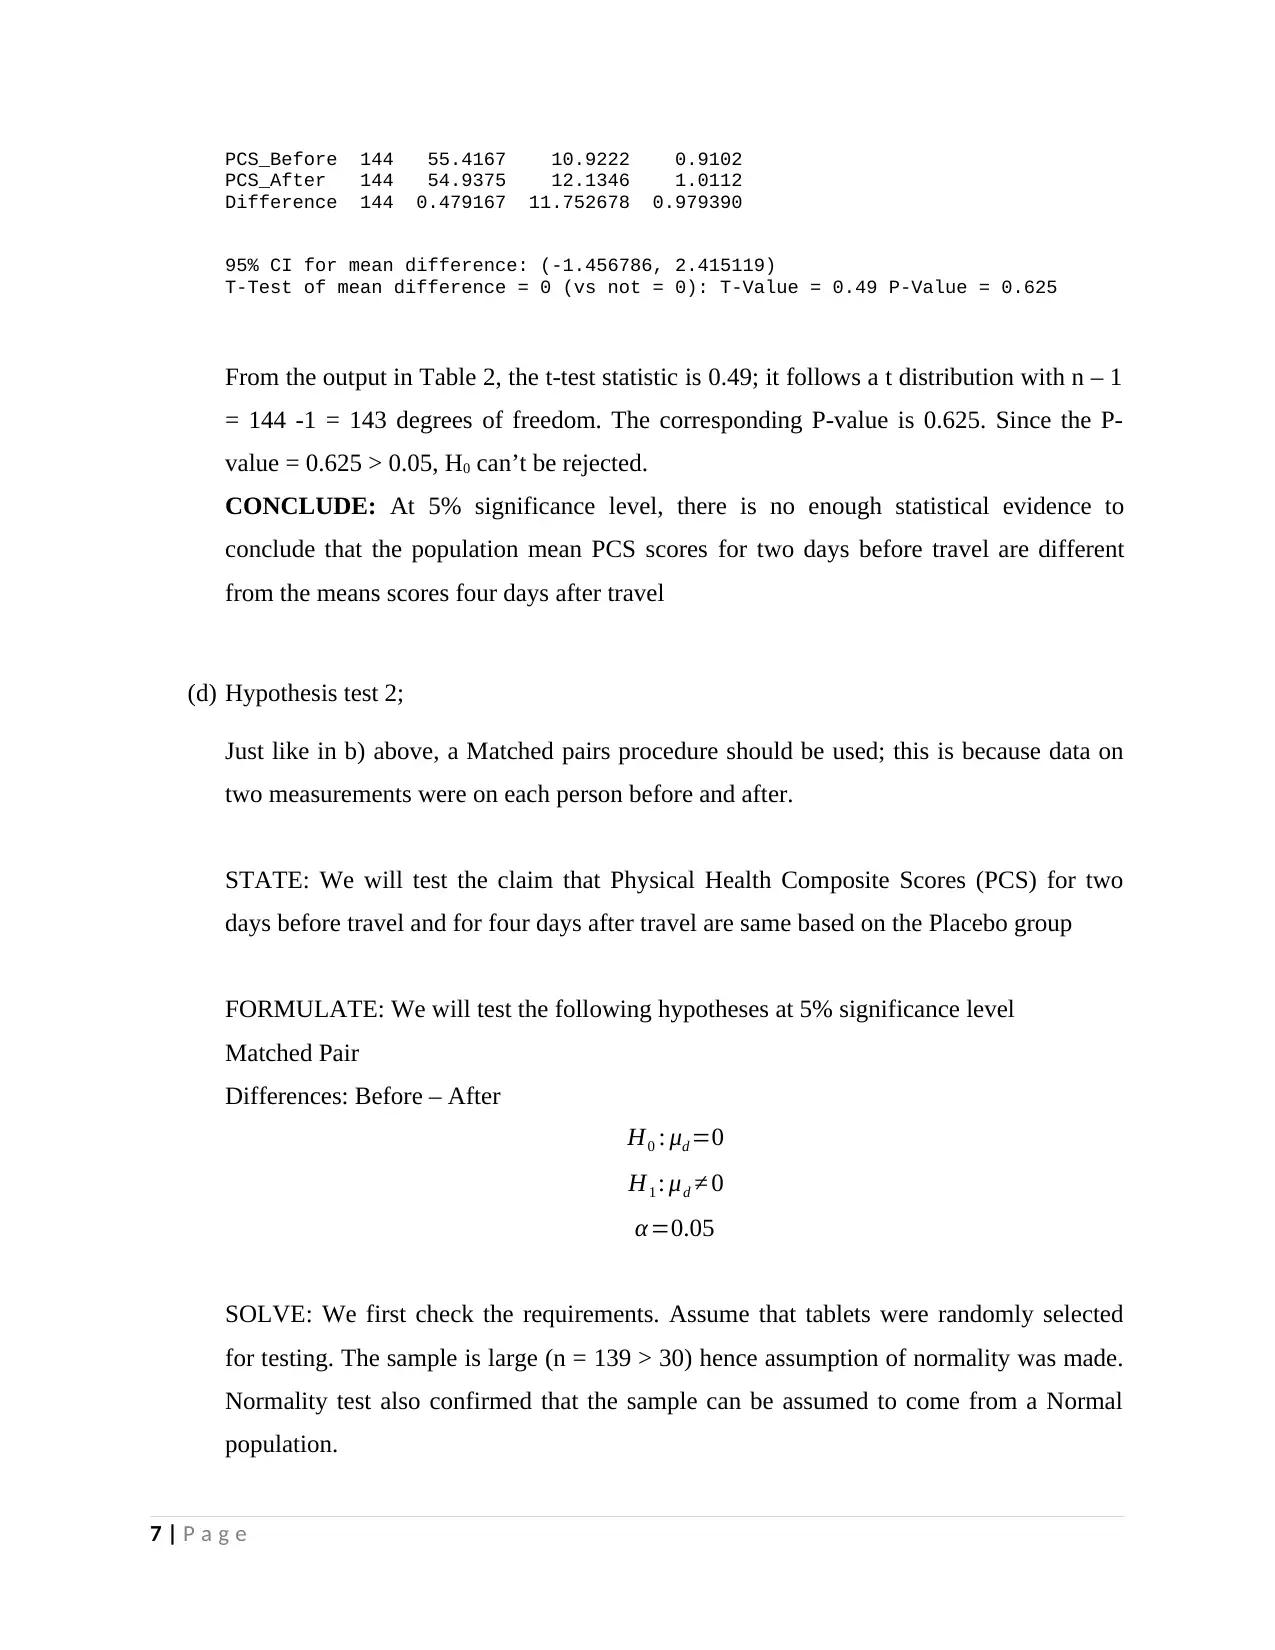
PCS_Before 144 55.4167 10.9222 0.9102
PCS_After 144 54.9375 12.1346 1.0112
Difference 144 0.479167 11.752678 0.979390
95% CI for mean difference: (-1.456786, 2.415119)
T-Test of mean difference = 0 (vs not = 0): T-Value = 0.49 P-Value = 0.625
From the output in Table 2, the t-test statistic is 0.49; it follows a t distribution with n – 1
= 144 -1 = 143 degrees of freedom. The corresponding P-value is 0.625. Since the P-
value = 0.625 > 0.05, H0 can’t be rejected.
CONCLUDE: At 5% significance level, there is no enough statistical evidence to
conclude that the population mean PCS scores for two days before travel are different
from the means scores four days after travel
(d) Hypothesis test 2;
Just like in b) above, a Matched pairs procedure should be used; this is because data on
two measurements were on each person before and after.
STATE: We will test the claim that Physical Health Composite Scores (PCS) for two
days before travel and for four days after travel are same based on the Placebo group
FORMULATE: We will test the following hypotheses at 5% significance level
Matched Pair
Differences: Before – After
H0 : μd =0
H1 : μd ≠ 0
α=0.05
SOLVE: We first check the requirements. Assume that tablets were randomly selected
for testing. The sample is large (n = 139 > 30) hence assumption of normality was made.
Normality test also confirmed that the sample can be assumed to come from a Normal
population.
7 | P a g e
Paraphrase This Document
Need a fresh take? Get an instant paraphrase of this document with our AI Paraphraser
We will perform paired t-test
The following Minitab output has been obtained:
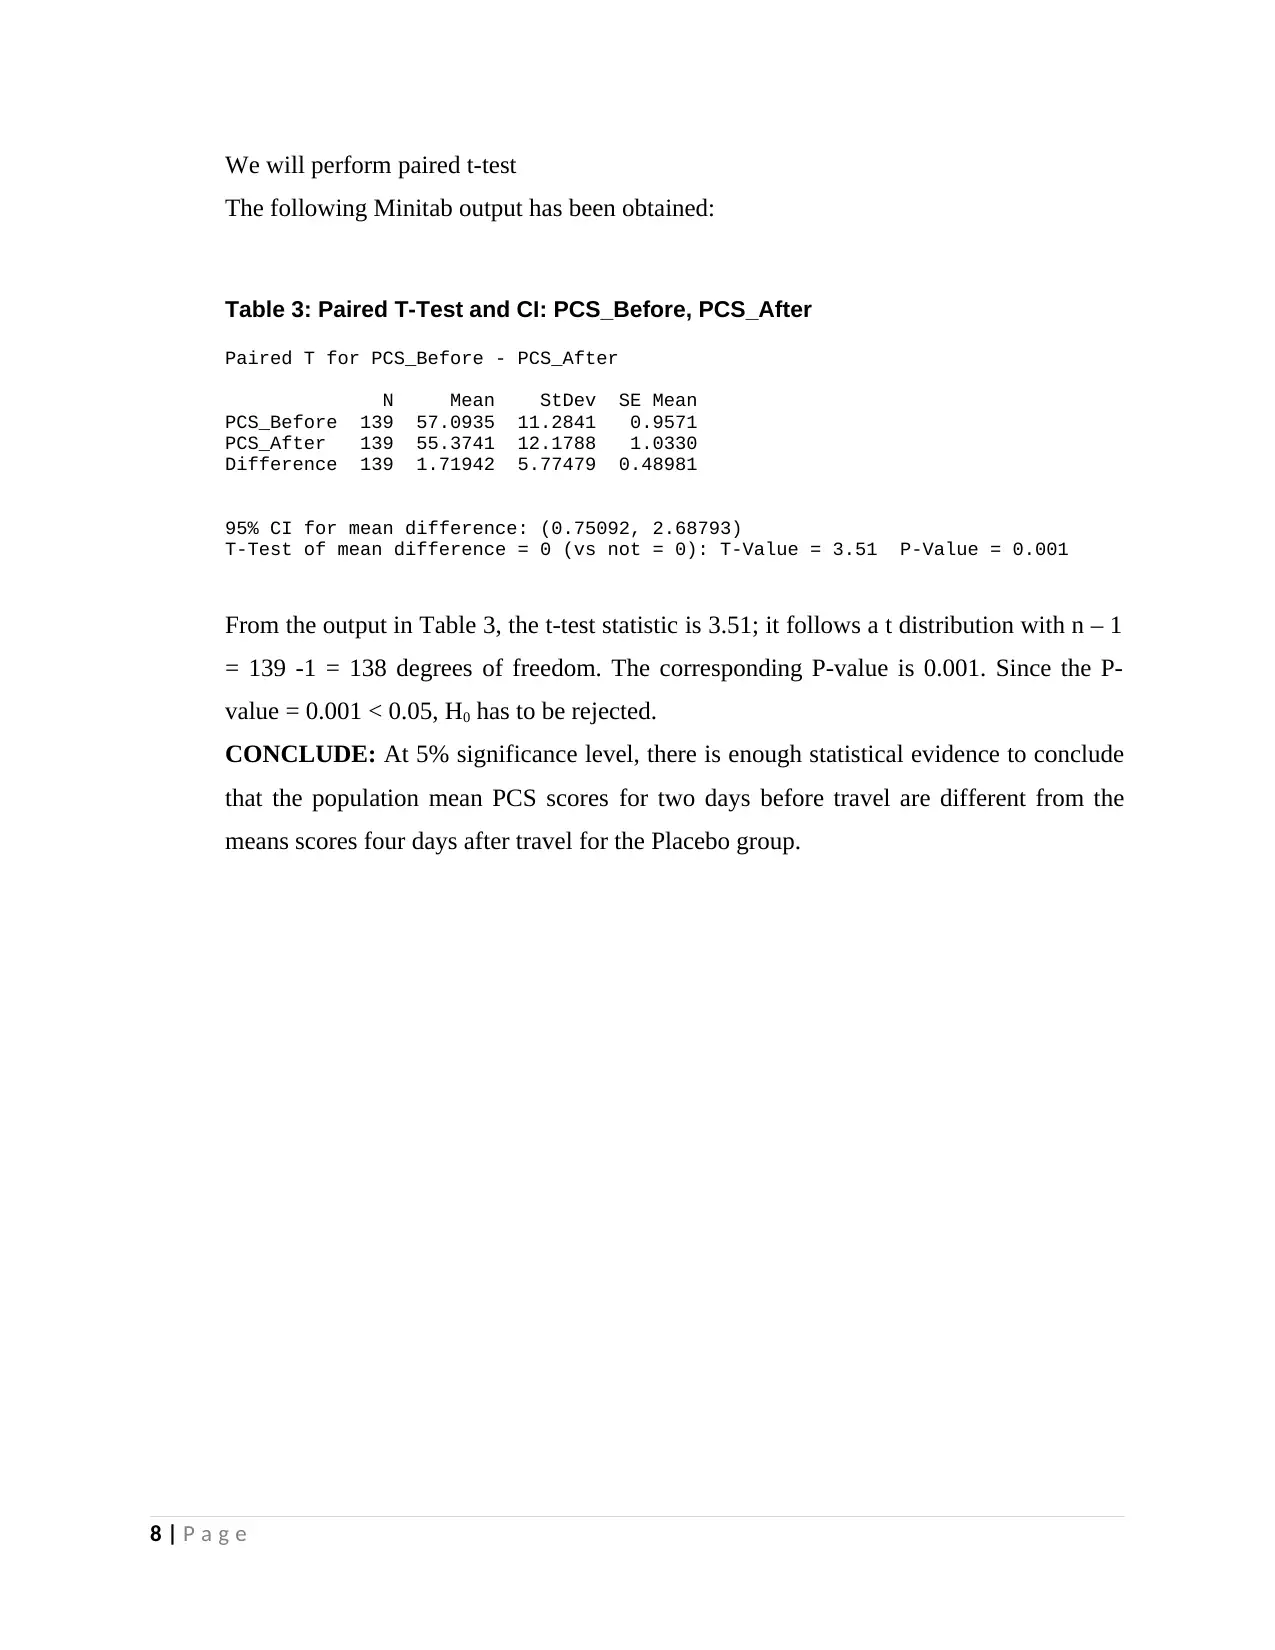
Table 3: Paired T-Test and CI: PCS_Before, PCS_After
Paired T for PCS_Before - PCS_After
N Mean StDev SE Mean
PCS_Before 139 57.0935 11.2841 0.9571
PCS_After 139 55.3741 12.1788 1.0330
Difference 139 1.71942 5.77479 0.48981
95% CI for mean difference: (0.75092, 2.68793)
T-Test of mean difference = 0 (vs not = 0): T-Value = 3.51 P-Value = 0.001
From the output in Table 3, the t-test statistic is 3.51; it follows a t distribution with n – 1
= 139 -1 = 138 degrees of freedom. The corresponding P-value is 0.001. Since the P-
value = 0.001 < 0.05, H0 has to be rejected.
CONCLUDE: At 5% significance level, there is enough statistical evidence to conclude
that the population mean PCS scores for two days before travel are different from the
means scores four days after travel for the Placebo group.
8 | P a g e
The following Minitab output has been obtained:
Table 3: Paired T-Test and CI: PCS_Before, PCS_After
Paired T for PCS_Before - PCS_After
N Mean StDev SE Mean
PCS_Before 139 57.0935 11.2841 0.9571
PCS_After 139 55.3741 12.1788 1.0330
Difference 139 1.71942 5.77479 0.48981
95% CI for mean difference: (0.75092, 2.68793)
T-Test of mean difference = 0 (vs not = 0): T-Value = 3.51 P-Value = 0.001
From the output in Table 3, the t-test statistic is 3.51; it follows a t distribution with n – 1
= 139 -1 = 138 degrees of freedom. The corresponding P-value is 0.001. Since the P-
value = 0.001 < 0.05, H0 has to be rejected.
CONCLUDE: At 5% significance level, there is enough statistical evidence to conclude
that the population mean PCS scores for two days before travel are different from the
means scores four days after travel for the Placebo group.
8 | P a g e
Question 2 (32 marks)
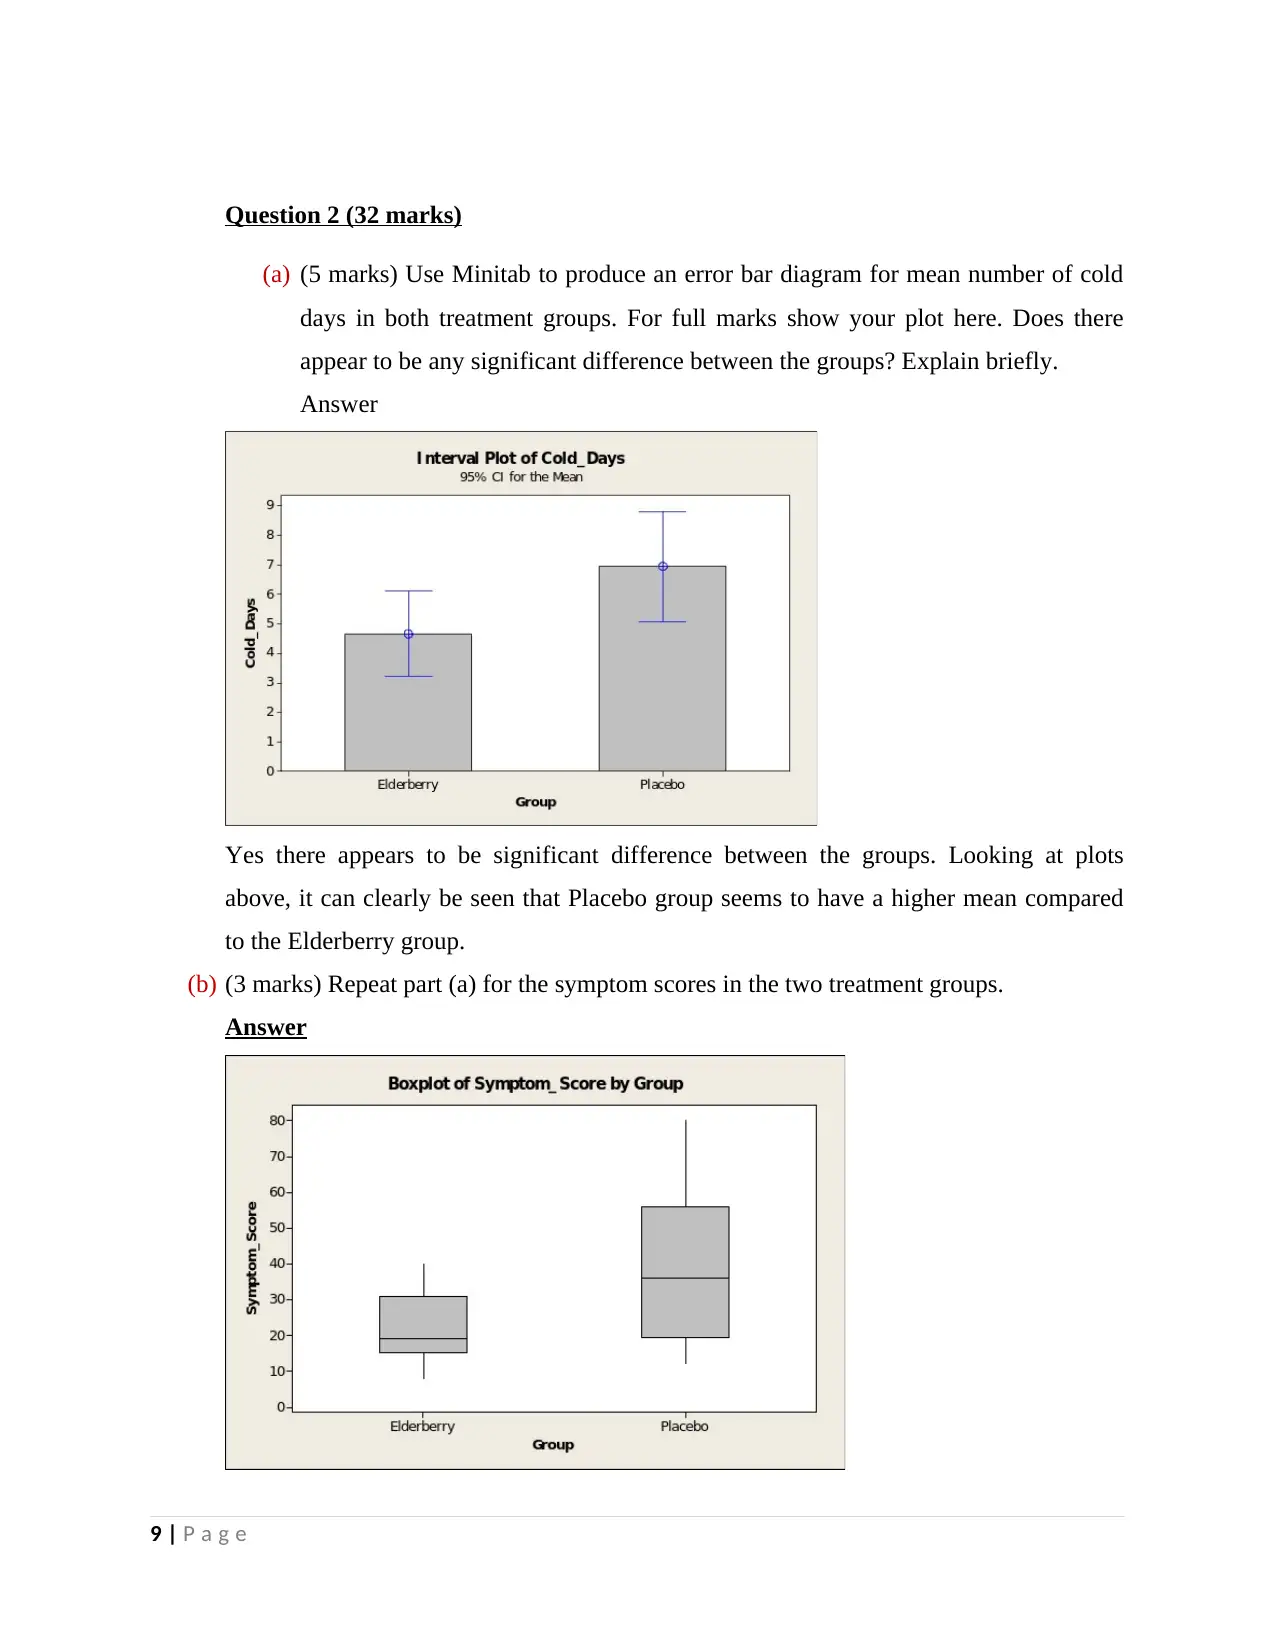
(a) (5 marks) Use Minitab to produce an error bar diagram for mean number of cold
days in both treatment groups. For full marks show your plot here. Does there
appear to be any significant difference between the groups? Explain briefly.
Answer
Yes there appears to be significant difference between the groups. Looking at plots
above, it can clearly be seen that Placebo group seems to have a higher mean compared
to the Elderberry group.
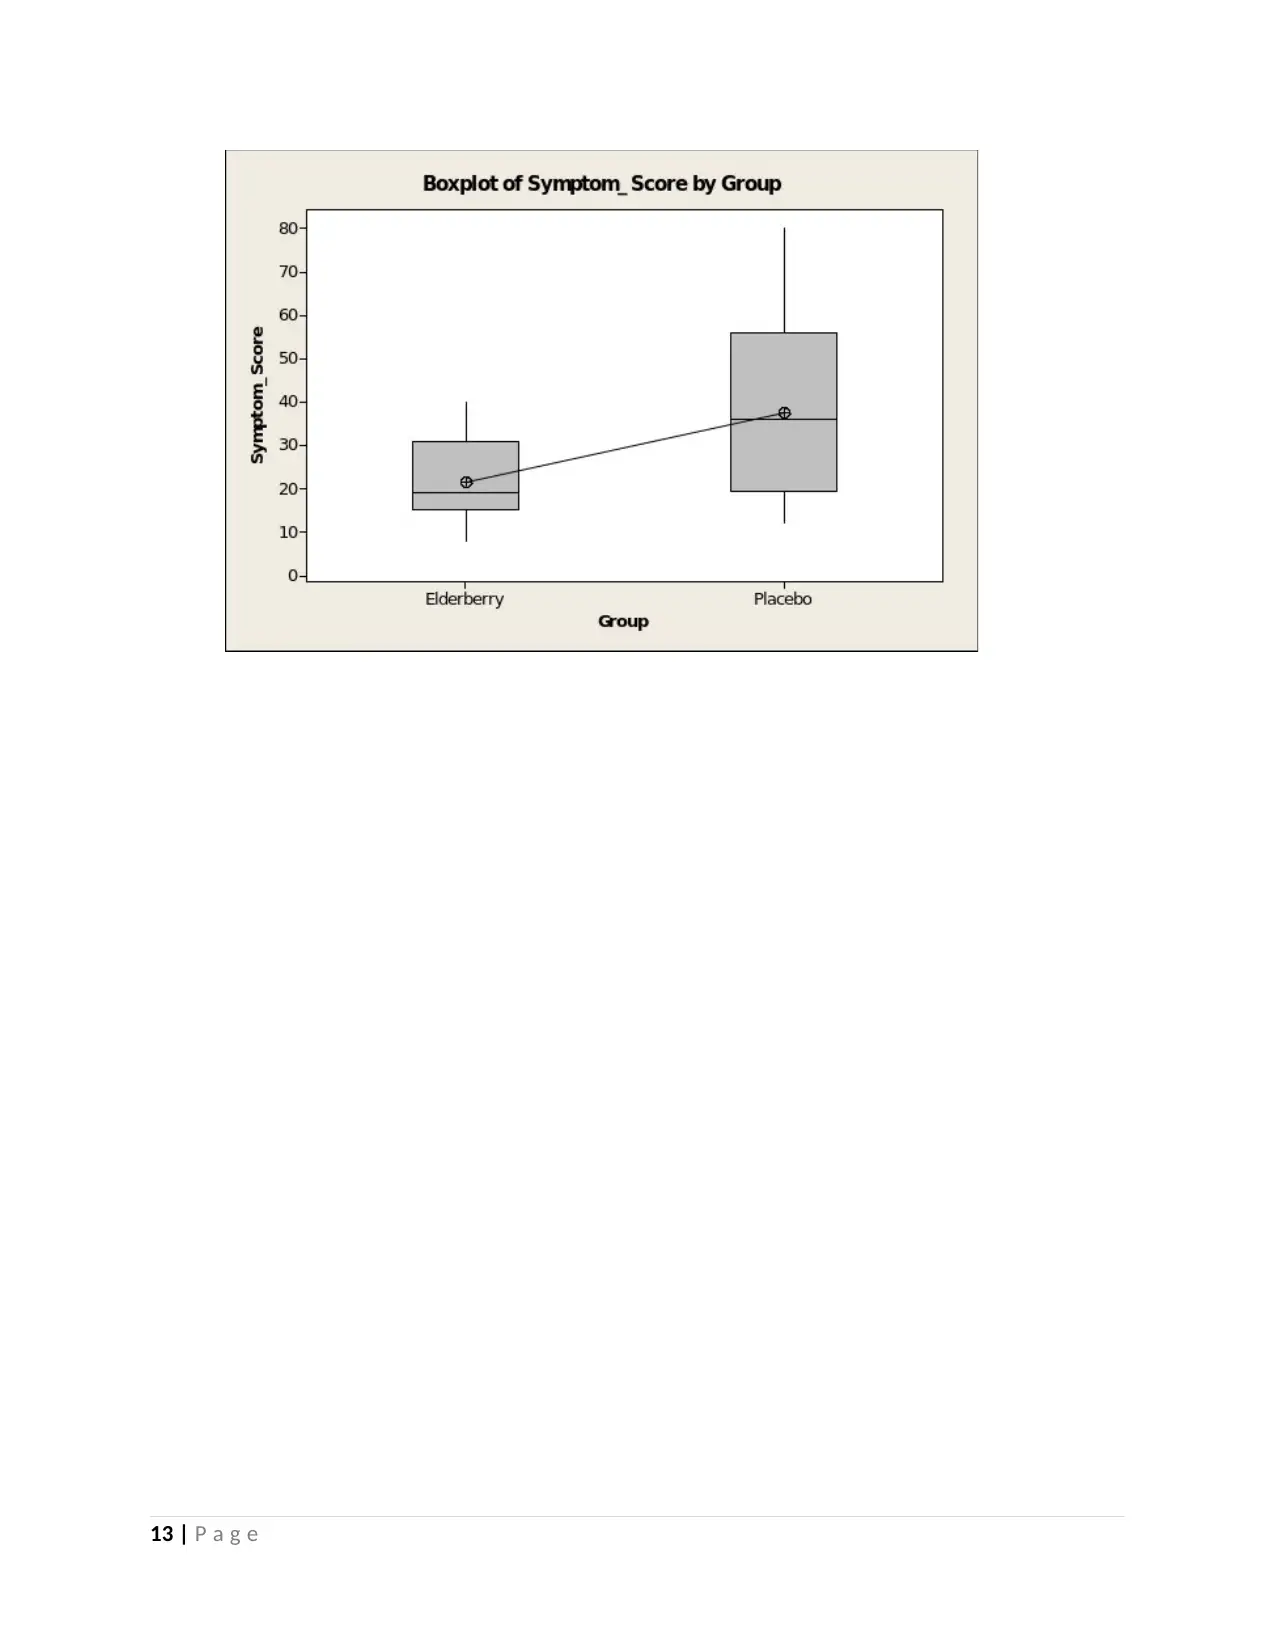
(b) (3 marks) Repeat part (a) for the symptom scores in the two treatment groups.
Answer
9 | P a g e
(a) (5 marks) Use Minitab to produce an error bar diagram for mean number of cold
days in both treatment groups. For full marks show your plot here. Does there
appear to be any significant difference between the groups? Explain briefly.
Answer
Yes there appears to be significant difference between the groups. Looking at plots
above, it can clearly be seen that Placebo group seems to have a higher mean compared
to the Elderberry group.
(b) (3 marks) Repeat part (a) for the symptom scores in the two treatment groups.
Answer
9 | P a g e
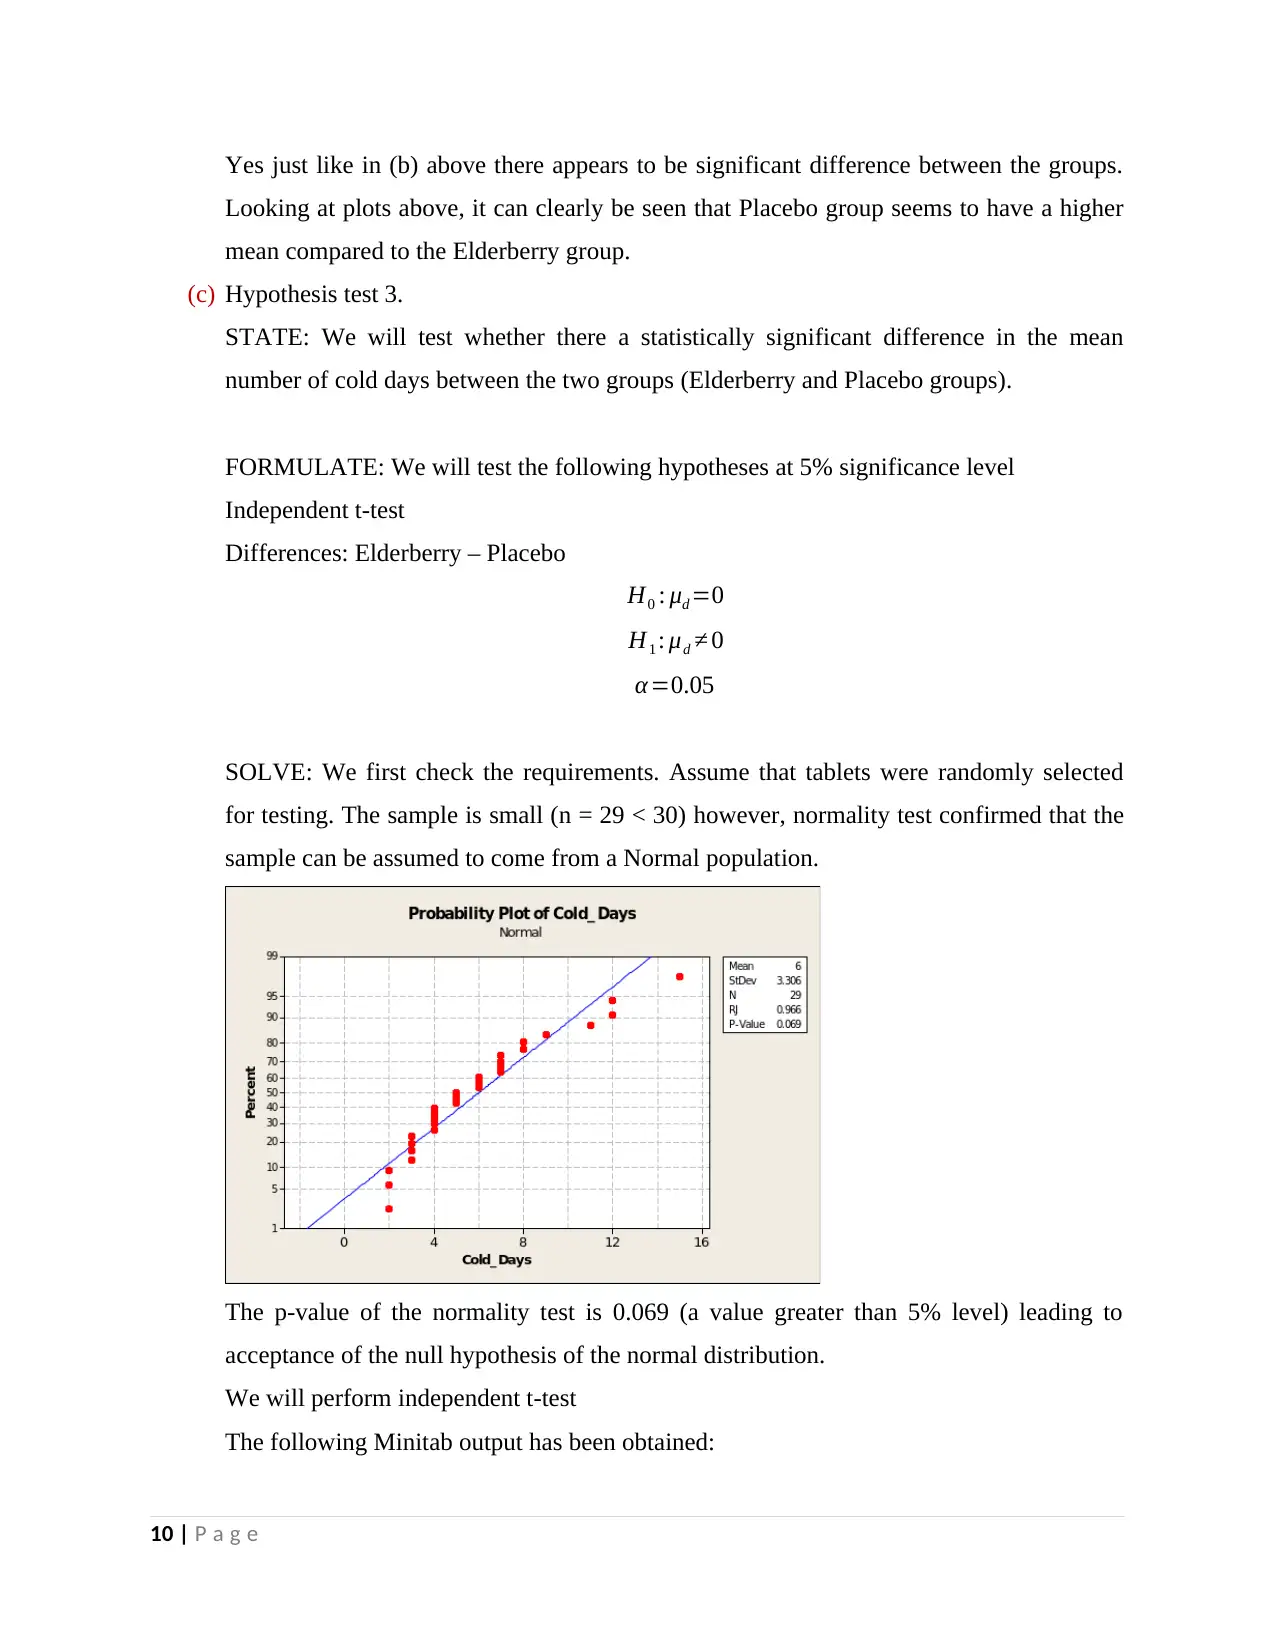
Yes just like in (b) above there appears to be significant difference between the groups.
Looking at plots above, it can clearly be seen that Placebo group seems to have a higher
mean compared to the Elderberry group.
(c) Hypothesis test 3.
STATE: We will test whether there a statistically significant difference in the mean
number of cold days between the two groups (Elderberry and Placebo groups).
FORMULATE: We will test the following hypotheses at 5% significance level
Independent t-test
Differences: Elderberry – Placebo
H0 : μd =0
H1 : μd ≠ 0
α=0.05
SOLVE: We first check the requirements. Assume that tablets were randomly selected
for testing. The sample is small (n = 29 < 30) however, normality test confirmed that the
sample can be assumed to come from a Normal population.
The p-value of the normality test is 0.069 (a value greater than 5% level) leading to
acceptance of the null hypothesis of the normal distribution.
We will perform independent t-test
The following Minitab output has been obtained:
10 | P a g e
Secure Best Marks with AI Grader
Need help grading? Try our AI Grader for instant feedback on your assignments.
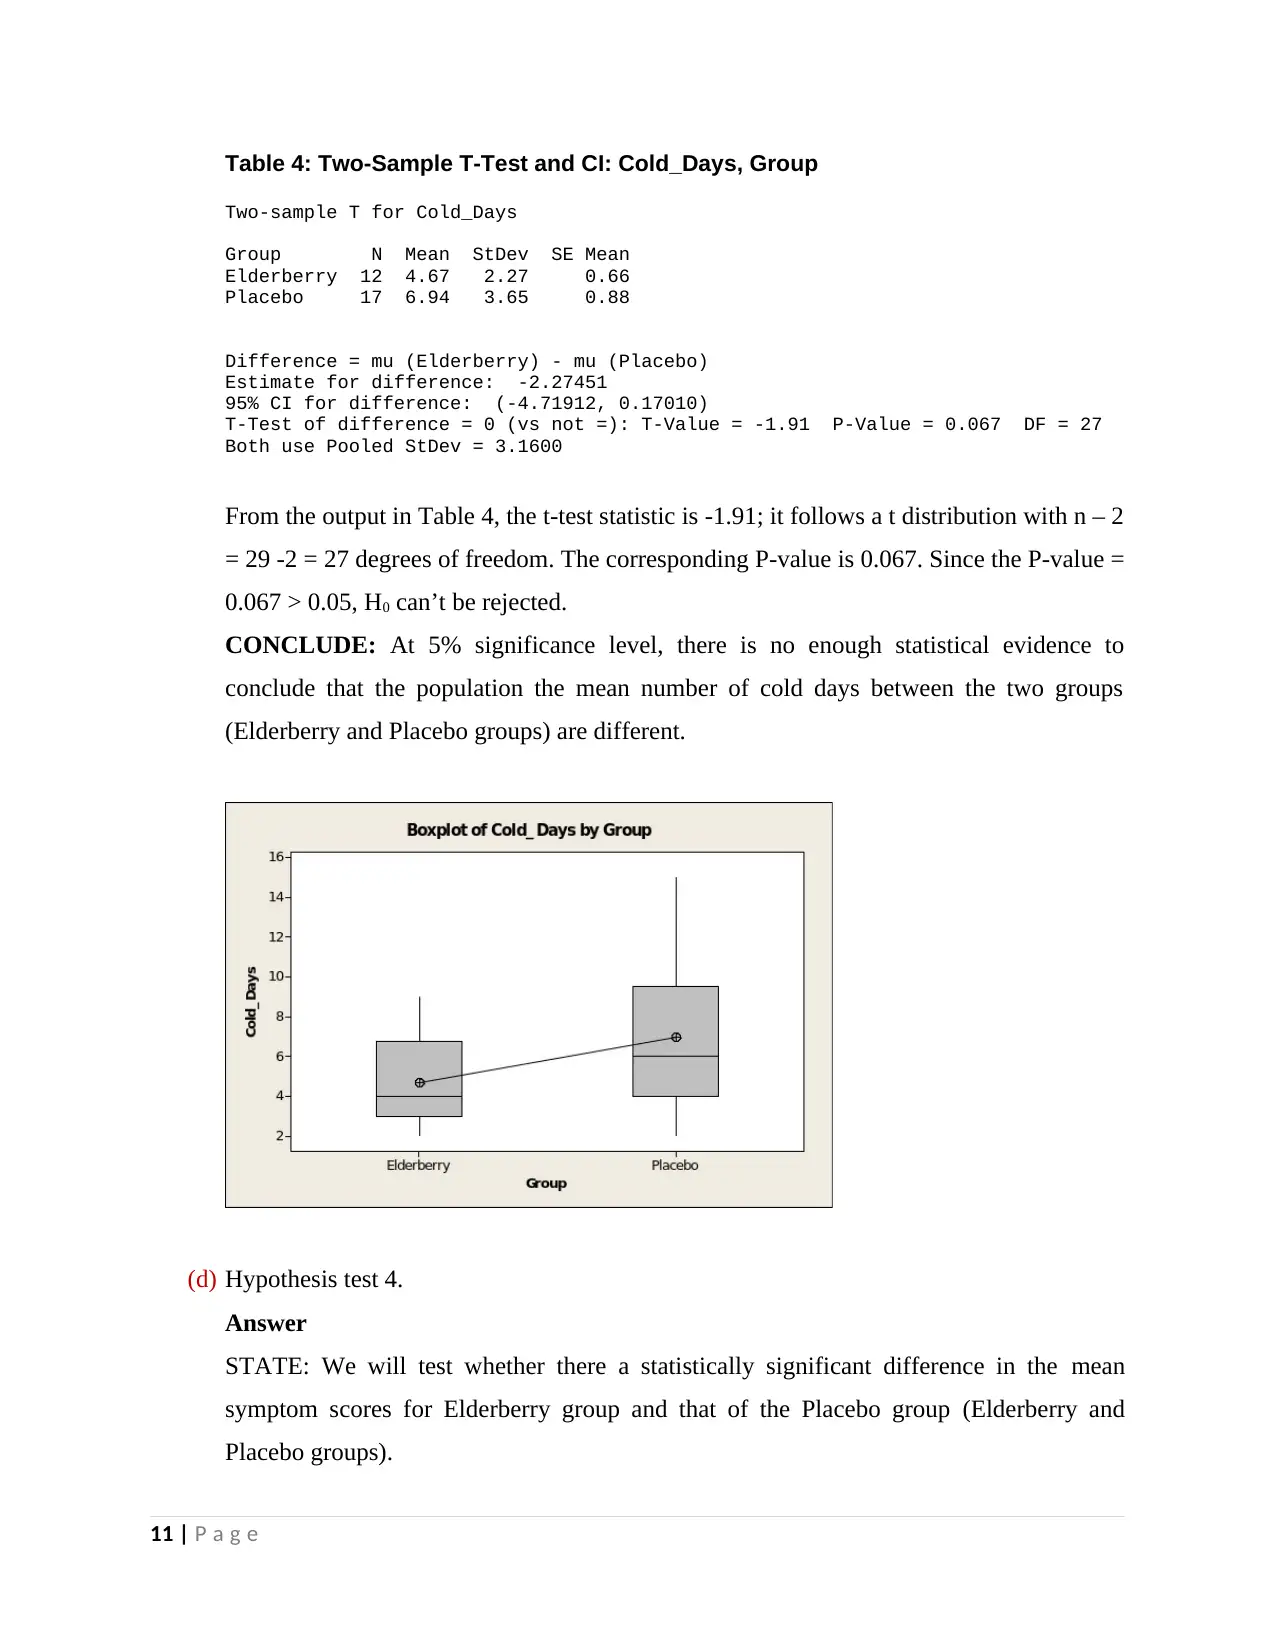
Table 4: Two-Sample T-Test and CI: Cold_Days, Group
Two-sample T for Cold_Days
Group N Mean StDev SE Mean
Elderberry 12 4.67 2.27 0.66
Placebo 17 6.94 3.65 0.88
Difference = mu (Elderberry) - mu (Placebo)
Estimate for difference: -2.27451
95% CI for difference: (-4.71912, 0.17010)
T-Test of difference = 0 (vs not =): T-Value = -1.91 P-Value = 0.067 DF = 27
Both use Pooled StDev = 3.1600
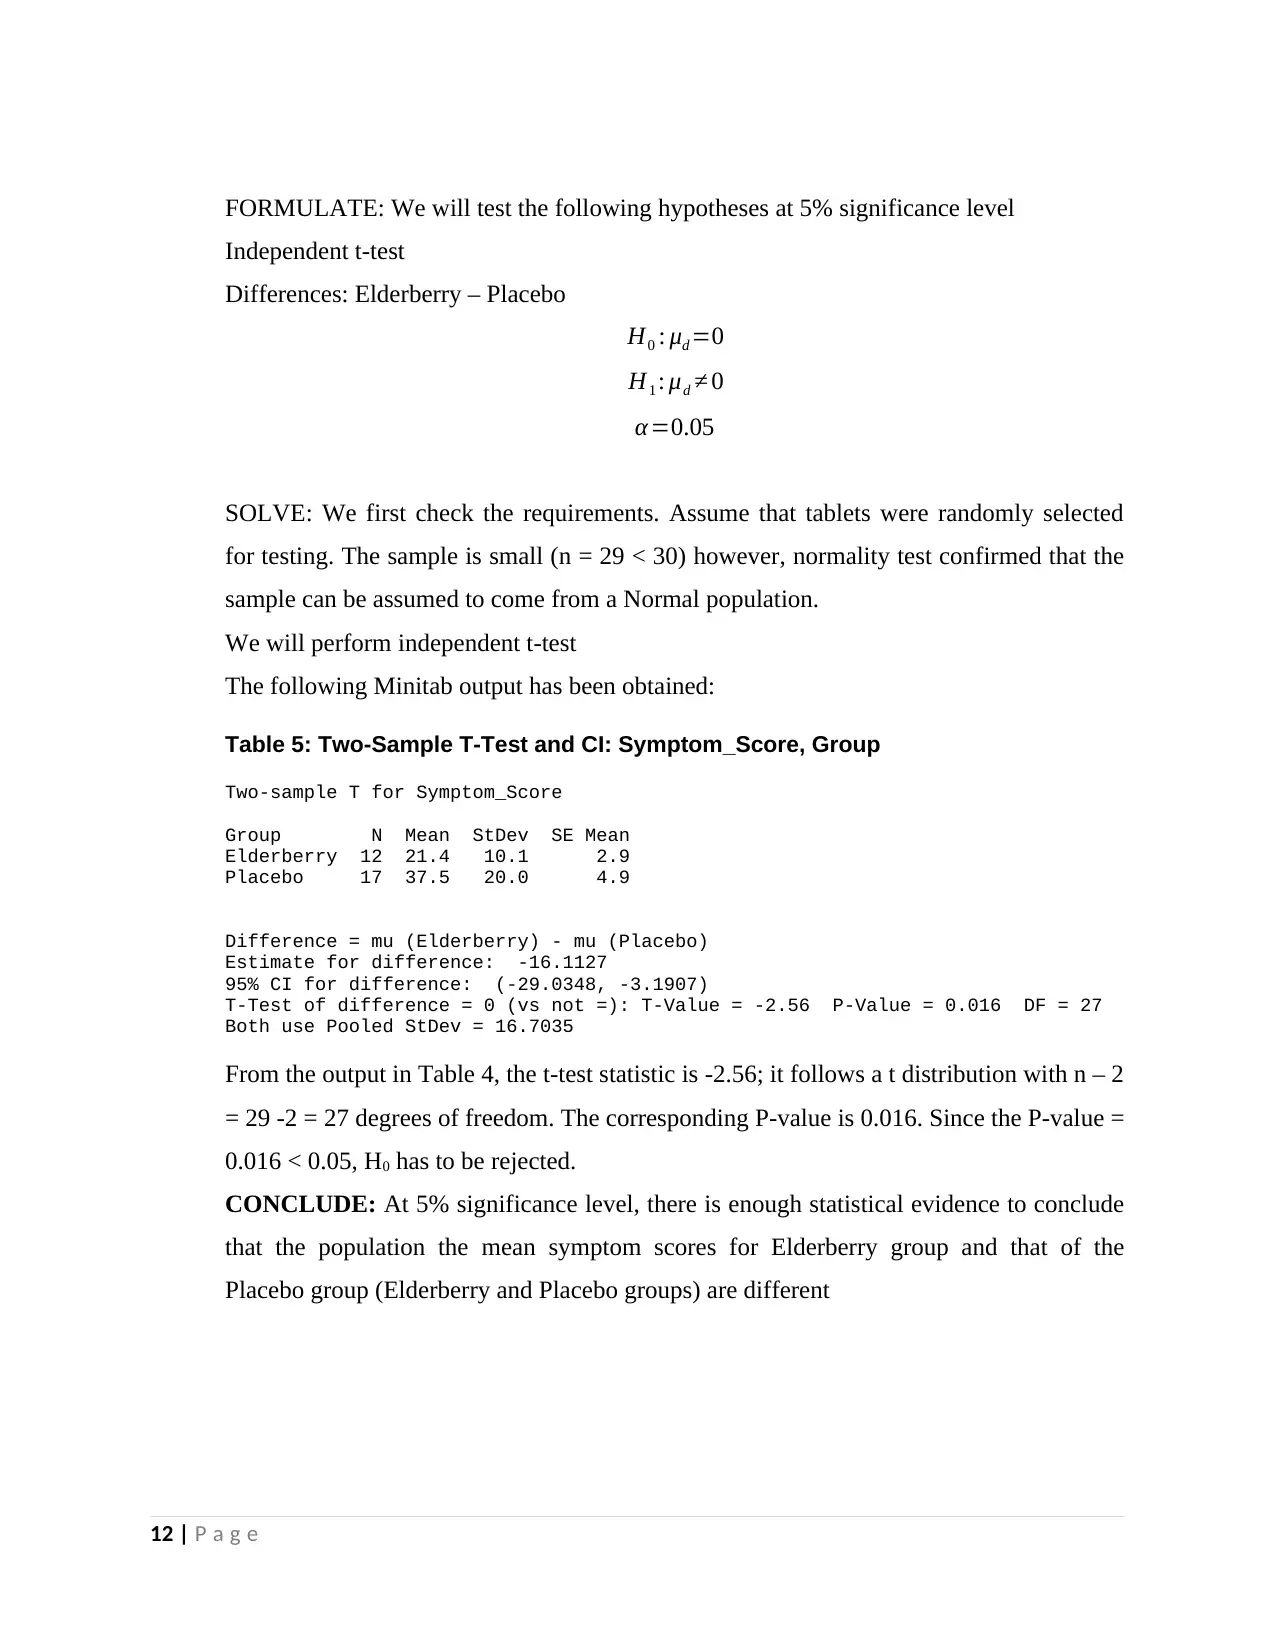
From the output in Table 4, the t-test statistic is -1.91; it follows a t distribution with n – 2
= 29 -2 = 27 degrees of freedom. The corresponding P-value is 0.067. Since the P-value =
0.067 > 0.05, H0 can’t be rejected.
CONCLUDE: At 5% significance level, there is no enough statistical evidence to
conclude that the population the mean number of cold days between the two groups
(Elderberry and Placebo groups) are different.
(d) Hypothesis test 4.
Answer
STATE: We will test whether there a statistically significant difference in the mean
symptom scores for Elderberry group and that of the Placebo group (Elderberry and
Placebo groups).
11 | P a g e
Two-sample T for Cold_Days
Group N Mean StDev SE Mean
Elderberry 12 4.67 2.27 0.66
Placebo 17 6.94 3.65 0.88
Difference = mu (Elderberry) - mu (Placebo)
Estimate for difference: -2.27451
95% CI for difference: (-4.71912, 0.17010)
T-Test of difference = 0 (vs not =): T-Value = -1.91 P-Value = 0.067 DF = 27
Both use Pooled StDev = 3.1600
From the output in Table 4, the t-test statistic is -1.91; it follows a t distribution with n – 2
= 29 -2 = 27 degrees of freedom. The corresponding P-value is 0.067. Since the P-value =
0.067 > 0.05, H0 can’t be rejected.
CONCLUDE: At 5% significance level, there is no enough statistical evidence to
conclude that the population the mean number of cold days between the two groups
(Elderberry and Placebo groups) are different.
(d) Hypothesis test 4.
Answer
STATE: We will test whether there a statistically significant difference in the mean
symptom scores for Elderberry group and that of the Placebo group (Elderberry and
Placebo groups).
11 | P a g e
FORMULATE: We will test the following hypotheses at 5% significance level
Independent t-test
Differences: Elderberry – Placebo
H0 : μd =0
H1 : μd ≠ 0
α=0.05
SOLVE: We first check the requirements. Assume that tablets were randomly selected
for testing. The sample is small (n = 29 < 30) however, normality test confirmed that the
sample can be assumed to come from a Normal population.
We will perform independent t-test
The following Minitab output has been obtained:
Table 5: Two-Sample T-Test and CI: Symptom_Score, Group
Two-sample T for Symptom_Score
Group N Mean StDev SE Mean
Elderberry 12 21.4 10.1 2.9
Placebo 17 37.5 20.0 4.9
Difference = mu (Elderberry) - mu (Placebo)
Estimate for difference: -16.1127
95% CI for difference: (-29.0348, -3.1907)
T-Test of difference = 0 (vs not =): T-Value = -2.56 P-Value = 0.016 DF = 27
Both use Pooled StDev = 16.7035
From the output in Table 4, the t-test statistic is -2.56; it follows a t distribution with n – 2
= 29 -2 = 27 degrees of freedom. The corresponding P-value is 0.016. Since the P-value =
0.016 < 0.05, H0 has to be rejected.
CONCLUDE: At 5% significance level, there is enough statistical evidence to conclude
that the population the mean symptom scores for Elderberry group and that of the
Placebo group (Elderberry and Placebo groups) are different
12 | P a g e
13 | P a g e
1 out of 13
Related Documents


Your All-in-One AI-Powered Toolkit for Academic Success.
+13062052269
info@desklib.com
Available 24*7 on WhatsApp / Email
![[object Object]](/_next/static/media/star-bottom.7253800d.svg)
Unlock your academic potential
© 2024 | Zucol Services PVT LTD | All rights reserved.