Assignment of Statistics for Management
21 Pages5135 Words28 Views
Added on 2020-09-17
Assignment of Statistics for Management
Added on 2020-09-17
ShareRelated Documents
STATISTICS FORMANAGEMENT
TABLE OF CONTENTSINTRODUCTION...........................................................................................................................1ACTIVITY 1....................................................................................................................................1A Information relevant with annual earnings.........................................................................1M1...........................................................................................................................................6D1...........................................................................................................................................6B. Analysing the gross annual earnings by industry sector on Office of National Statisticswebsite....................................................................................................................................6ACTIVITY 2....................................................................................................................................8M2 1. Ascertaining the hourly payment in UK are various regions.......................................8ACTIVITY 3..................................................................................................................................11A. Analysing the deliveries which are currently made in each year....................................11B. Ascertaining the numbers of bags currently delivered in every delivery........................12C. Analysing the EOQ..........................................................................................................12D. Comparison between current ordering policies and new policies...................................12M3........................................................................................................................................13D2.........................................................................................................................................14ACTIVITY 4..................................................................................................................................14M4 A. Producing the line chart as per Activity 1.................................................................14B. Producing the ogive chart as per Activity 2.....................................................................16D3.........................................................................................................................................16CONCLUSION..............................................................................................................................16REFERENCES..............................................................................................................................18
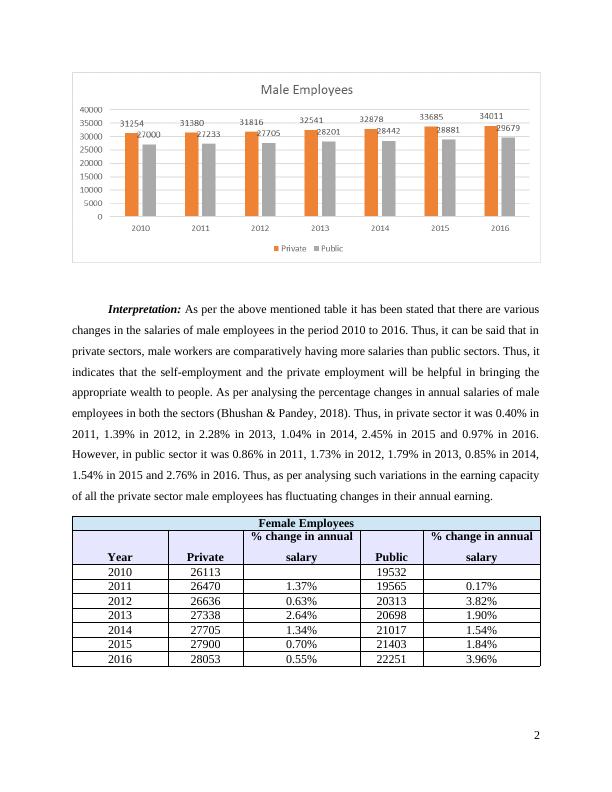
INTRODUCTIONTo implicate the use of statistical techniques and tool for analysing the huge data serieswhich will be helpful in terms of bringing the adequate analysis over the proposed data set. In thepresent report there will be use of various statistical measurement methods to analyse appropriateoutcomes. Thus, such results will be helpful in managing the operations of the work in suchsectors. It will be a beneficial tool in terms of analysing the requirements as well as proposednew ideas to implicate changes in such activities. The use of statistical measurement techniquessuch as mean, mode, median, standard deviation will be helpful in ascertaining the data set ofsales personnel. The EOQ measurements on analysing the rice bags orders and deliveries madein a year. Moreover, this study will be helpful in enhancing the appropriate knowledge regardingstatistical measurements which will bring accurate solutions.ACTIVITY 1A Information relevant with annual earnings1. Changes in the gross annual earning in public and private sector:There has been changes in the gross annual salaries in both the sectors such as private andpublic from 2010. It has drastic changes in the wages acquired by male and female employees insuch sectors such as:Male EmployeesYearPrivate% change in annualsalaryPublic% change in annualsalary201031254270002011313800.40%272330.86%2012318161.39%277051.73%2013325412.28%282011.79%2014328781.04%284420.85%2015336852.45%288811.54%2016340110.97%296792.76%1
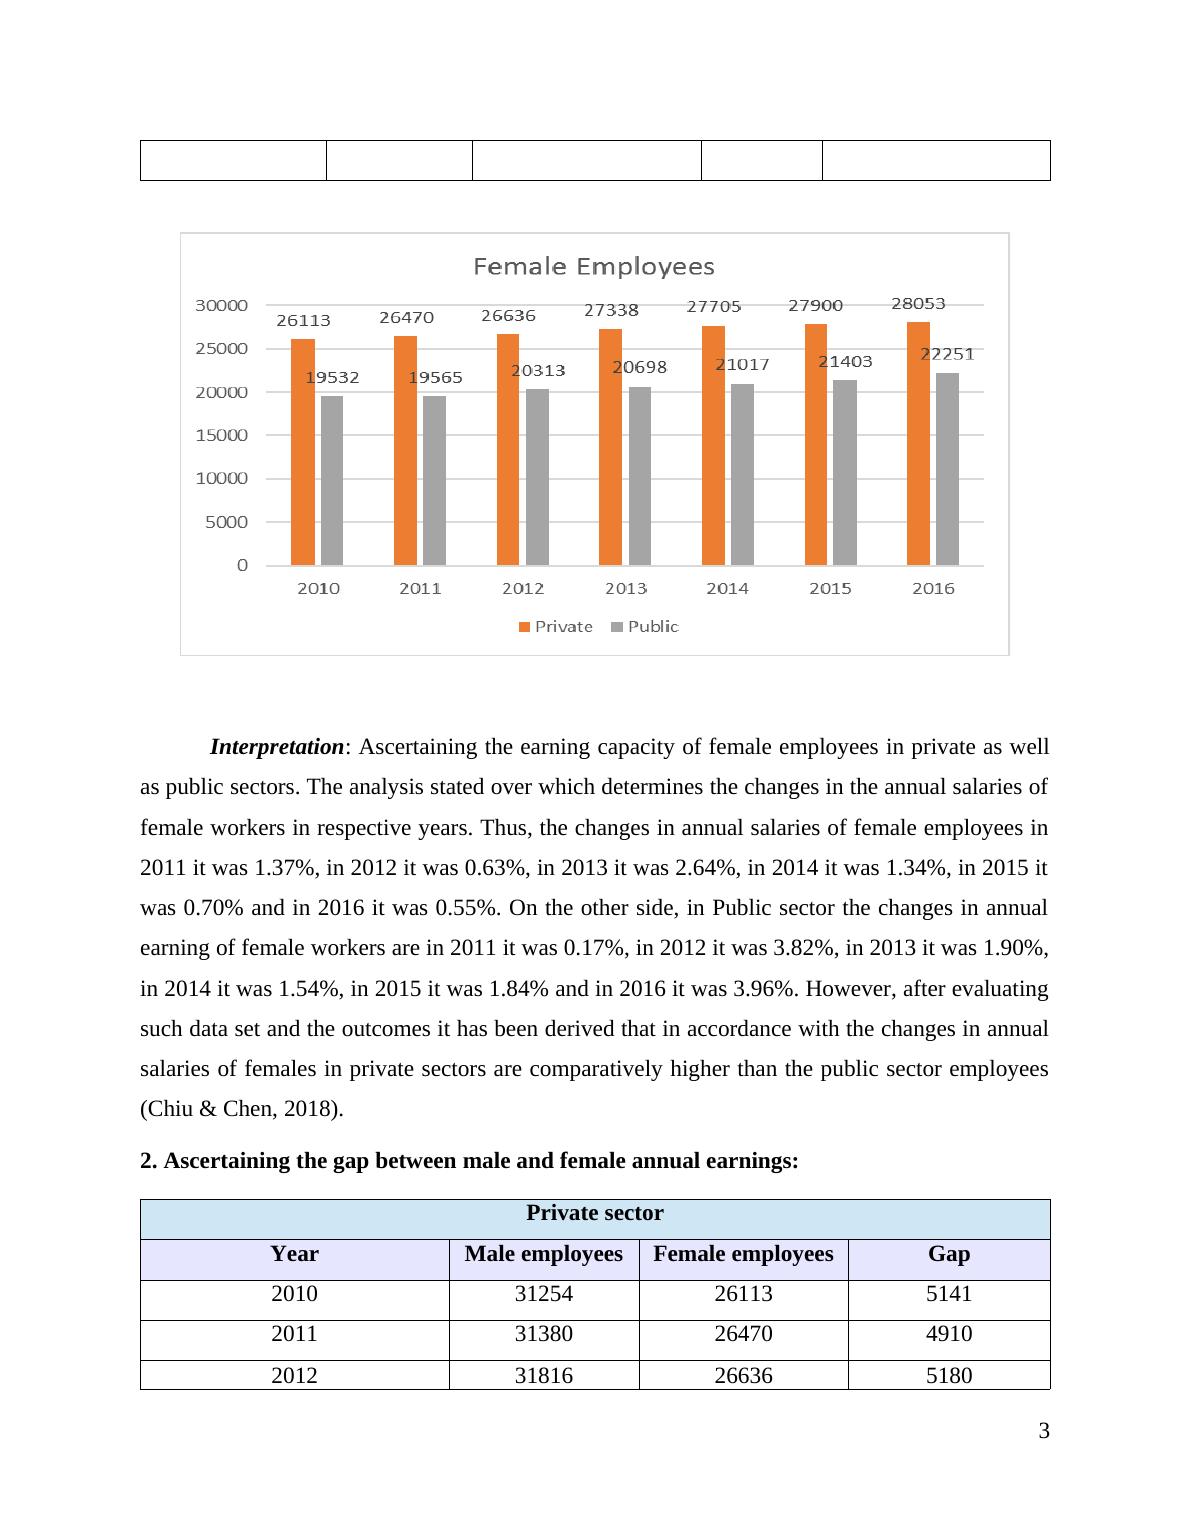
Interpretation: As per the above mentioned table it has been stated that there are variouschanges in the salaries of male employees in the period 2010 to 2016. Thus, it can be said that inprivate sectors, male workers are comparatively having more salaries than public sectors. Thus, itindicates that the self-employment and the private employment will be helpful in bringing theappropriate wealth to people. As per analysing the percentage changes in annual salaries of maleemployees in both the sectors (Bhushan & Pandey, 2018). Thus, in private sector it was 0.40% in2011, 1.39% in 2012, in 2.28% in 2013, 1.04% in 2014, 2.45% in 2015 and 0.97% in 2016.However, in public sector it was 0.86% in 2011, 1.73% in 2012, 1.79% in 2013, 0.85% in 2014,1.54% in 2015 and 2.76% in 2016. Thus, as per analysing such variations in the earning capacityof all the private sector male employees has fluctuating changes in their annual earning. Female EmployeesYearPrivate% change in annualsalaryPublic% change in annualsalary201026113195322011264701.37%195650.17%2012266360.63%203133.82%2013273382.64%206981.90%2014277051.34%210171.54%2015279000.70%214031.84%2016280530.55%222513.96%2
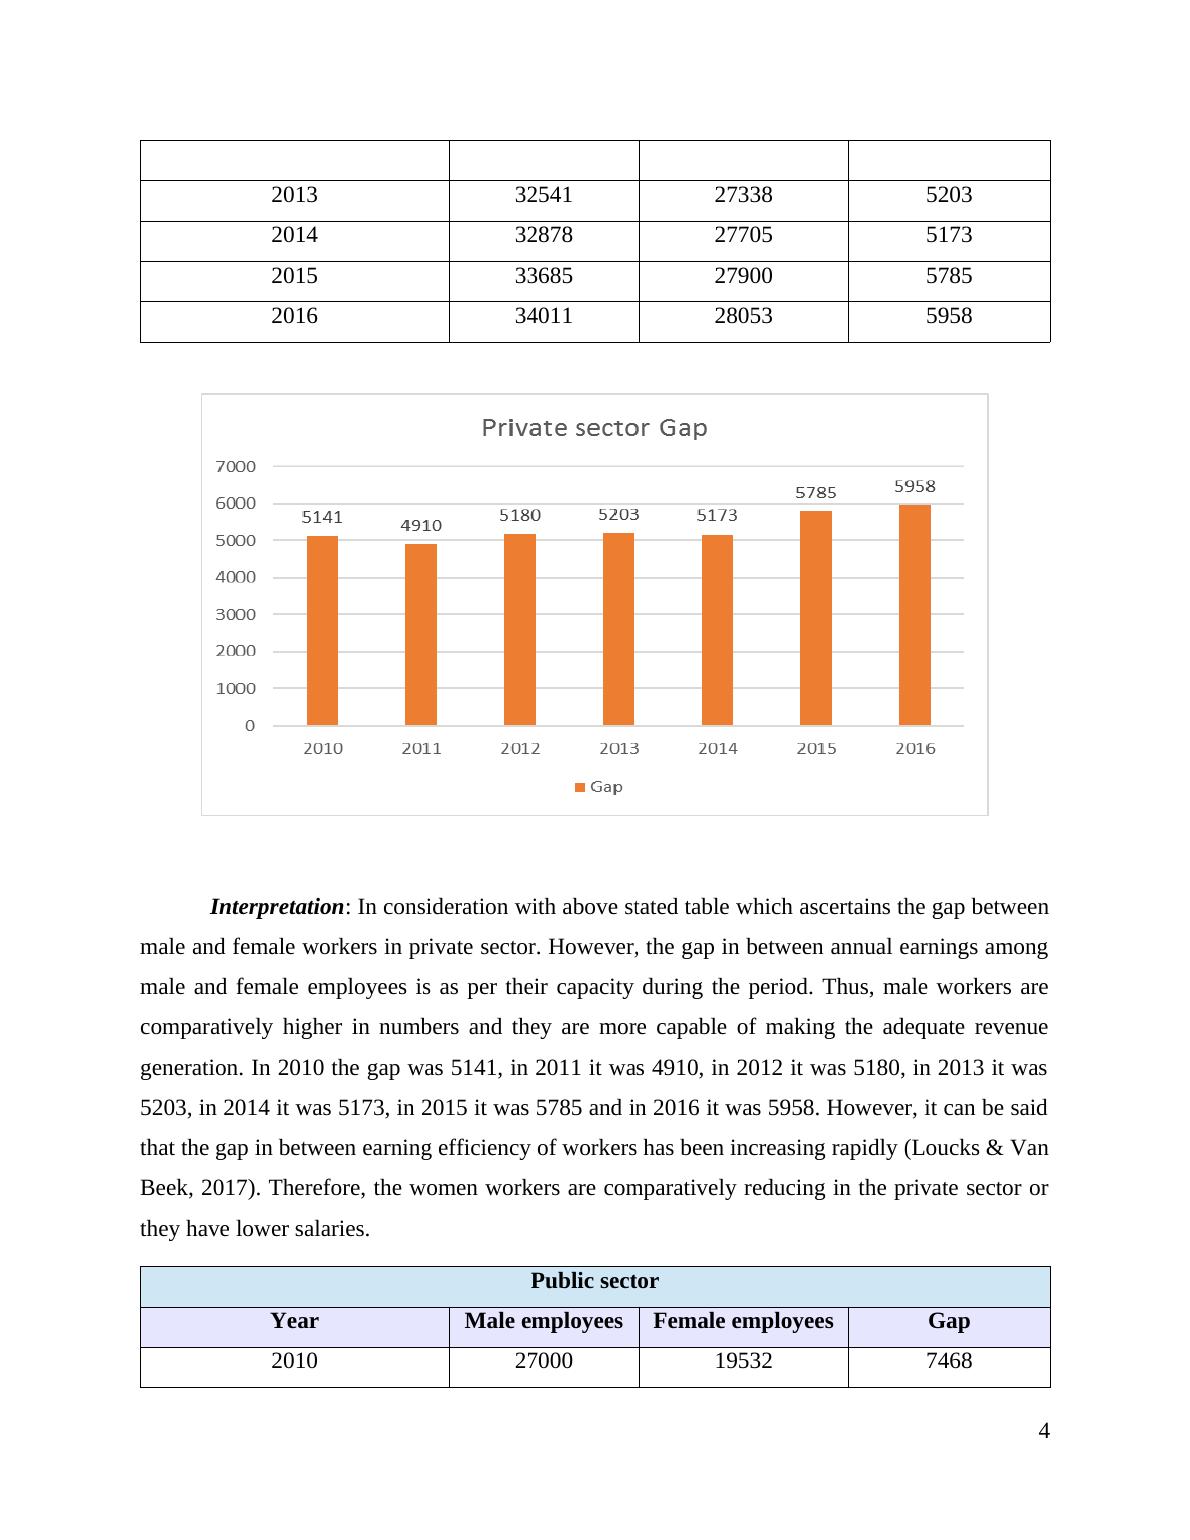
Interpretation: Ascertaining the earning capacity of female employees in private as wellas public sectors. The analysis stated over which determines the changes in the annual salaries offemale workers in respective years. Thus, the changes in annual salaries of female employees in2011 it was 1.37%, in 2012 it was 0.63%, in 2013 it was 2.64%, in 2014 it was 1.34%, in 2015 itwas 0.70% and in 2016 it was 0.55%. On the other side, in Public sector the changes in annualearning of female workers are in 2011 it was 0.17%, in 2012 it was 3.82%, in 2013 it was 1.90%,in 2014 it was 1.54%, in 2015 it was 1.84% and in 2016 it was 3.96%. However, after evaluatingsuch data set and the outcomes it has been derived that in accordance with the changes in annualsalaries of females in private sectors are comparatively higher than the public sector employees(Chiu & Chen, 2018).2. Ascertaining the gap between male and female annual earnings:Private sectorYearMale employeesFemale employeesGap2010312542611351412011313802647049102012318162663651802013325412733852032014328782770551732015336852790057852016340112805359583
Interpretation: In consideration with above stated table which ascertains the gap betweenmale and female workers in private sector. However, the gap in between annual earnings amongmale and female employees is as per their capacity during the period. Thus, male workers arecomparatively higher in numbers and they are more capable of making the adequate revenuegeneration. In 2010 the gap was 5141, in 2011 it was 4910, in 2012 it was 5180, in 2013 it was5203, in 2014 it was 5173, in 2015 it was 5785 and in 2016 it was 5958. However, it can be saidthat the gap in between earning efficiency of workers has been increasing rapidly (Loucks & VanBeek, 2017). Therefore, the women workers are comparatively reducing in the private sector orthey have lower salaries.Public sectorYearMale employeesFemale employeesGap2010270001953274682011272331956576682012277052031373922013282012069875032014284422101774252015288812140374782016296792225174284
End of preview
Want to access all the pages? Upload your documents or become a member.
Related Documents
Statistics for Management PDFlg...
|19
|3977
|326
Assignment: Statistics for Managementlg...
|19
|3721
|88
Statistics For Management Sample Assignment PDFlg...
|21
|4631
|478
Statistics in Management ACTIVTIY 1 1lg...
|17
|3350
|361
Statistic for Management - Reportlg...
|18
|3321
|200
Statistics for Management Assignment Solution (Doc)lg...
|15
|3020
|285