Statistic for Management - Report
18 Pages3321 Words200 Views
Added on 2020-06-04
Statistic for Management - Report
Added on 2020-06-04
ShareRelated Documents
Statistic for management
Table of ContentsINTRODUCTION...........................................................................................................................1TASK 1............................................................................................................................................1Evaluation of economic and business data:...............................................................................1a). Change in gross annual earnings in the public and the private sector since 2009.................1b). Gap between male and female annual earnings:....................................................................3TASK 2............................................................................................................................................5A). Analyse raw firm by implementing statistical tools:............................................................5B. Comparative analysis:............................................................................................................8A). Scatter diagram:....................................................................................................................8b). Equation on scatter line:......................................................................................................10c) Calculation of total turnover.................................................................................................10d).Correlation Coefficient:........................................................................................................10e). Statistical validity:................................................................................................................11TASK 3..........................................................................................................................................11A). Number of delivery in a current year;.................................................................................11B. Number of bottles delivery delivered with each delivery:...................................................11C. Calculation of EOQ:.............................................................................................................12D. Comparison between current operating model and economic order quantity:....................12TASK 4..........................................................................................................................................14a) Scatter diagram:....................................................................................................................14b). Line chart:............................................................................................................................14C). Ogive graph:........................................................................................................................15CONCLUSION:.............................................................................................................................15REFERENCES..............................................................................................................................16

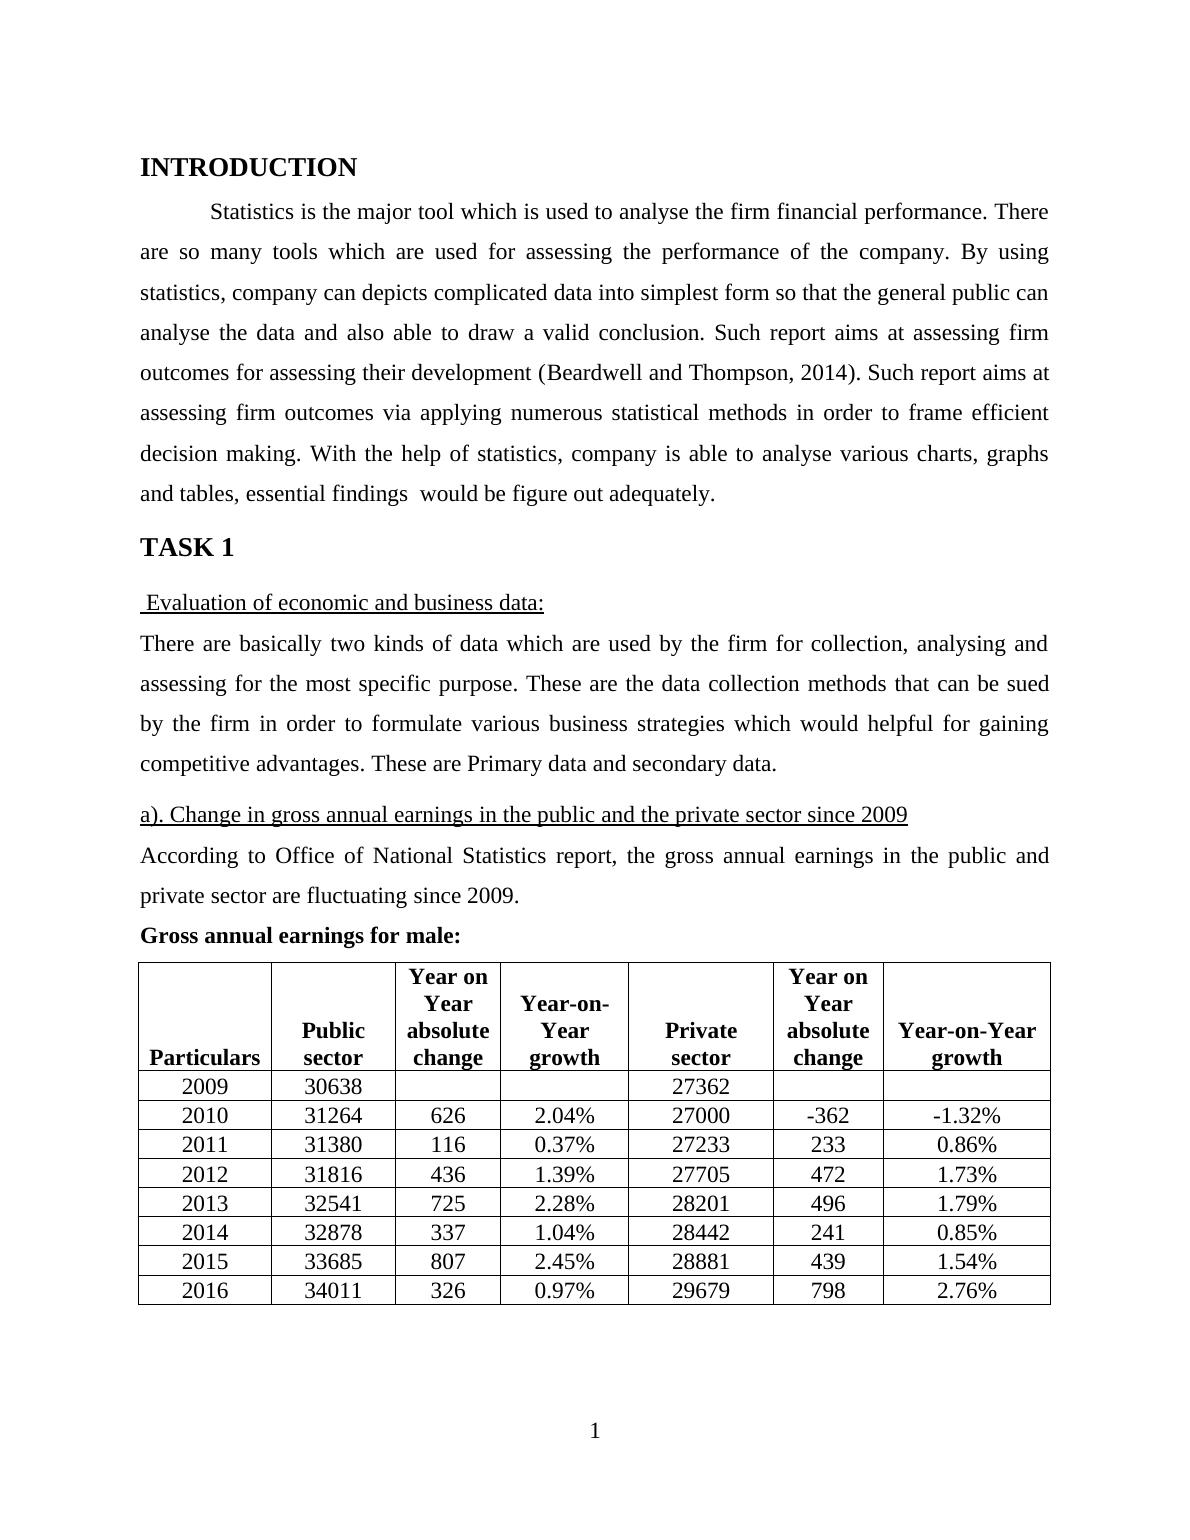
INTRODUCTIONStatistics is the major tool which is used to analyse the firm financial performance. Thereare so many tools which are used for assessing the performance of the company. By usingstatistics, company can depicts complicated data into simplest form so that the general public cananalyse the data and also able to draw a valid conclusion. Such report aims at assessing firmoutcomes for assessing their development (Beardwell and Thompson, 2014). Such report aims atassessing firm outcomes via applying numerous statistical methods in order to frame efficientdecision making. With the help of statistics, company is able to analyse various charts, graphsand tables, essential findings would be figure out adequately.TASK 1 Evaluation of economic and business data:There are basically two kinds of data which are used by the firm for collection, analysing andassessing for the most specific purpose. These are the data collection methods that can be suedby the firm in order to formulate various business strategies which would helpful for gainingcompetitive advantages. These are Primary data and secondary data.a). Change in gross annual earnings in the public and the private sector since 2009According to Office of National Statistics report, the gross annual earnings in the public andprivate sector are fluctuating since 2009.Gross annual earnings for male:Particulars Publicsector Year onYearabsolutechange Year-on-Yeargrowth Privatesector Year onYearabsolutechange Year-on-Yeargrowth 200930638273622010312646262.04%27000-362-1.32%2011313801160.37%272332330.86%2012318164361.39%277054721.73%2013325417252.28%282014961.79%2014328783371.04%284422410.85%2015336858072.45%288814391.54%2016340113260.97%296797982.76%1
End of preview
Want to access all the pages? Upload your documents or become a member.
Related Documents
Statistical for management in the public and private sectorlg...
|23
|3733
|122
Statistics Of Management Project Reportlg...
|22
|4330
|43
MB0040 Statistics for Management Assignmentlg...
|23
|4808
|56
(doc) Statistics for Managementlg...
|17
|3736
|34
Assignment: Statistics for Managementlg...
|19
|3721
|88
Statistical Statistics for Management Table of Contents Interruptionlg...
|19
|2556
|227