Comprehensive Analysis of the Australian Economy: Key Indicators
VerifiedAdded on 2022/10/17
|12
|2606
|13
Report
AI Summary
This economics report provides a comprehensive overview of the Australian economy, examining key indicators and trends. It begins with an introduction to the mixed market economy of Australia, highlighting major sectors like agriculture, manufacturing, and services, along with its main exports and...
Running head: ECONOMICS
Economics
Name of the Student
Name of the University
Author Note
Economics
Name of the Student
Name of the University
Author Note
Paraphrase This Document
Need a fresh take? Get an instant paraphrase of this document with our AI Paraphraser
1ECONOMICS
Section 1: Introduction
The market economy of Australia is that of mixed kind and accounts for the largest
economy of mixed market possessing a Gross Domestic Product (GDP) of approximately 1.69
trillion dollars.
One of the most important sectors of the economy is the agricultural sector which
accounts for 3% of the total GDP belonging to Australia with respect to the farm level and 12%
when the processing of the products beyond the form level has been considered. Another
important factor that can be mentioned you have been operating in this economy is the
manufacturing sector that contributes towards 6% belonging to the GDP. Another important
sector in the Australian economy is a service sector and it has been accounting for 70% with
respect to GDP (Courvisanos, Jain & Mardaneh, 2016).
The main products and services in Australia are:
• Iron ore and derivatives
• Coal
• Education based services of travelling
• Natural gas
• Travel services of personal nature
The major export countries or market in Australia are:
• China (29.6%)
• Japan (12%)
2ECONOMICS
• South Korea (6.1%)
• United States (5.6%)
• India (5.1%)
Some of the big companies belonging to Australia are:
• Wesfarmers ($69billion)
• Wordsworth ($56billion)
• Commonwealth Bank of Australia ($45billion)
• BHP ($39billion)
• Westpac Banking Corporation ($38billion)
Although there has been an expansion in the GDP by 0.5% with respect to June quarter
along with a 1.4 % with respect to the year but it can be conceived as a slowdown in the annual
growth in line with the sluggish rate of growth of economy in the last 10 years
(tradingeconomics.com, 2019).
⊘ This is a preview!⊘
Do you want full access?
Subscribe today to unlock all pages.
Trusted by 1+ million students worldwide
3ECONOMICS
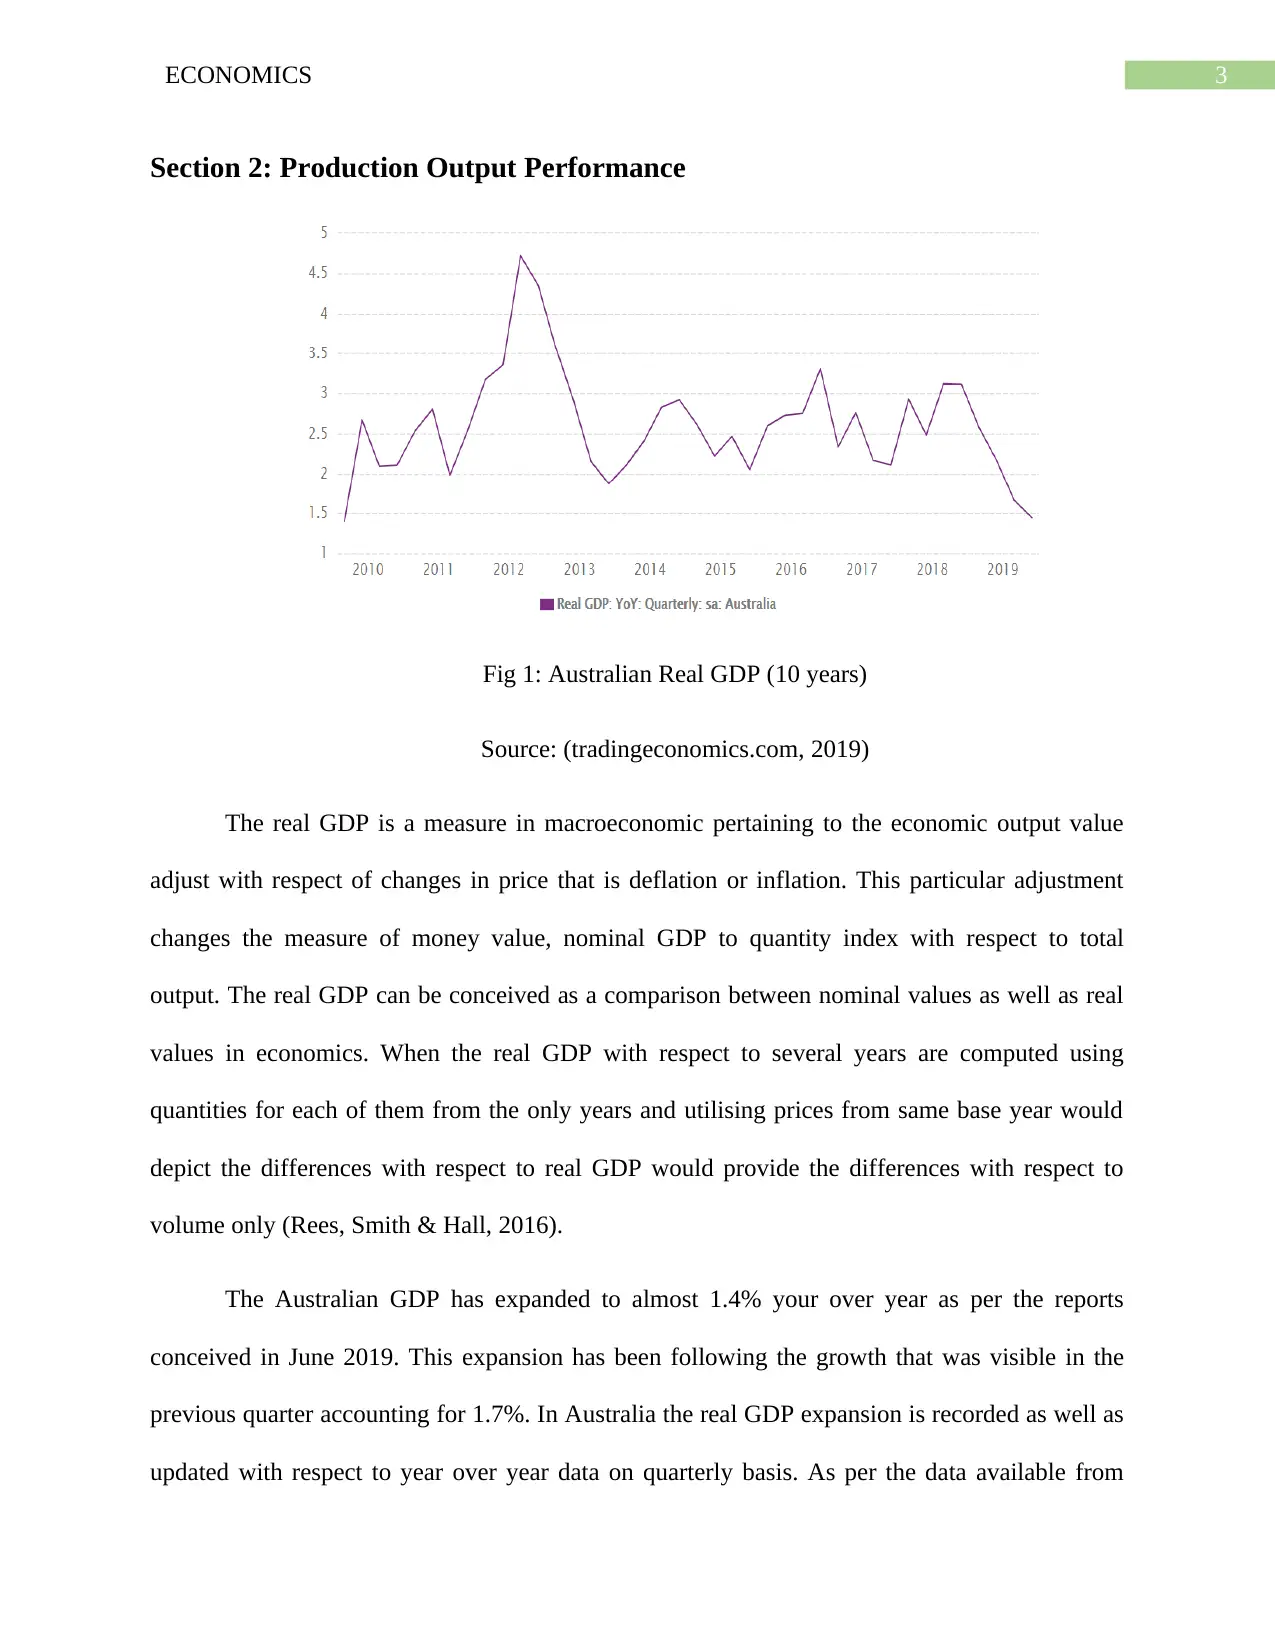
Section 2: Production Output Performance
Fig 1: Australian Real GDP (10 years)
Source: (tradingeconomics.com, 2019)
The real GDP is a measure in macroeconomic pertaining to the economic output value
adjust with respect of changes in price that is deflation or inflation. This particular adjustment
changes the measure of money value, nominal GDP to quantity index with respect to total
output. The real GDP can be conceived as a comparison between nominal values as well as real
values in economics. When the real GDP with respect to several years are computed using
quantities for each of them from the only years and utilising prices from same base year would
depict the differences with respect to real GDP would provide the differences with respect to
volume only (Rees, Smith & Hall, 2016).
The Australian GDP has expanded to almost 1.4% your over year as per the reports
conceived in June 2019. This expansion has been following the growth that was visible in the
previous quarter accounting for 1.7%. In Australia the real GDP expansion is recorded as well as
updated with respect to year over year data on quarterly basis. As per the data available from
Paraphrase This Document
Need a fresh take? Get an instant paraphrase of this document with our AI Paraphraser
4ECONOMICS
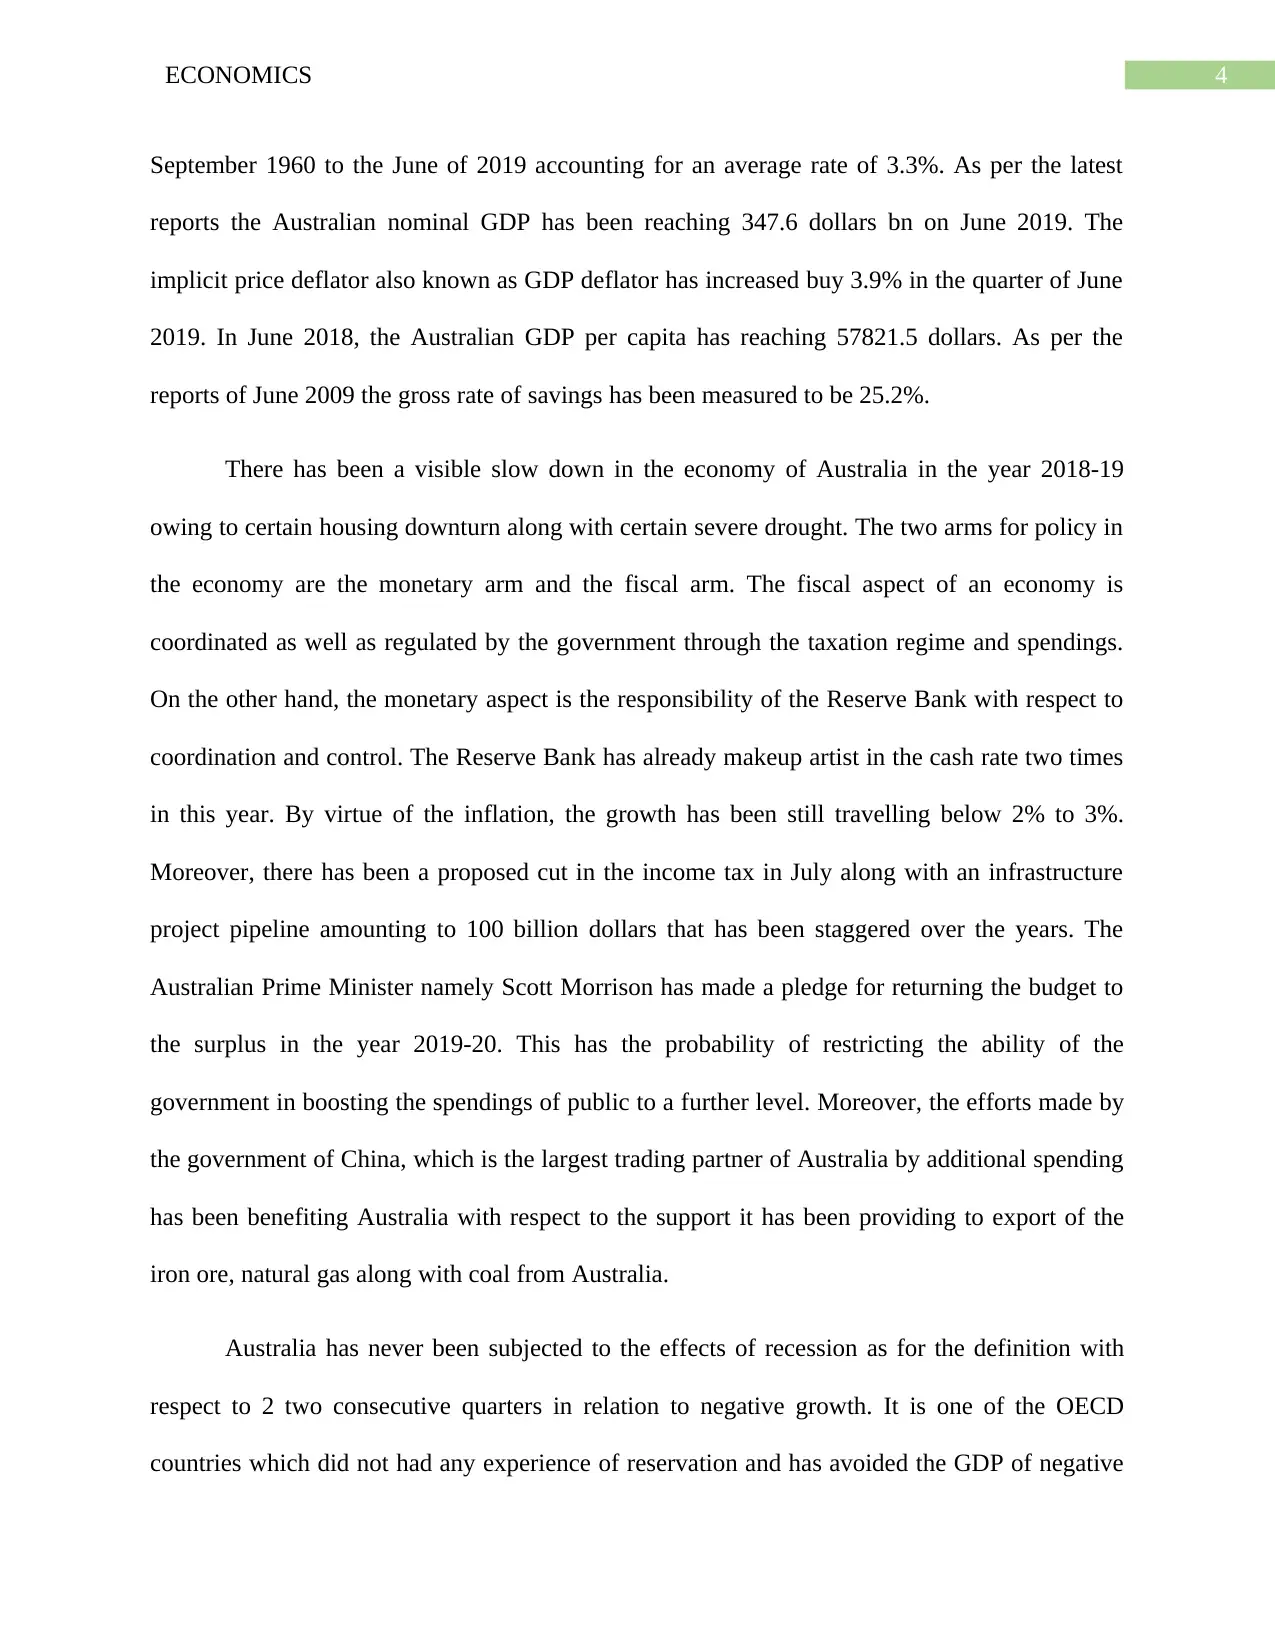
September 1960 to the June of 2019 accounting for an average rate of 3.3%. As per the latest
reports the Australian nominal GDP has been reaching 347.6 dollars bn on June 2019. The
implicit price deflator also known as GDP deflator has increased buy 3.9% in the quarter of June
2019. In June 2018, the Australian GDP per capita has reaching 57821.5 dollars. As per the
reports of June 2009 the gross rate of savings has been measured to be 25.2%.
There has been a visible slow down in the economy of Australia in the year 2018-19
owing to certain housing downturn along with certain severe drought. The two arms for policy in
the economy are the monetary arm and the fiscal arm. The fiscal aspect of an economy is
coordinated as well as regulated by the government through the taxation regime and spendings.
On the other hand, the monetary aspect is the responsibility of the Reserve Bank with respect to
coordination and control. The Reserve Bank has already makeup artist in the cash rate two times
in this year. By virtue of the inflation, the growth has been still travelling below 2% to 3%.
Moreover, there has been a proposed cut in the income tax in July along with an infrastructure
project pipeline amounting to 100 billion dollars that has been staggered over the years. The
Australian Prime Minister namely Scott Morrison has made a pledge for returning the budget to
the surplus in the year 2019-20. This has the probability of restricting the ability of the
government in boosting the spendings of public to a further level. Moreover, the efforts made by
the government of China, which is the largest trading partner of Australia by additional spending
has been benefiting Australia with respect to the support it has been providing to export of the
iron ore, natural gas along with coal from Australia.
Australia has never been subjected to the effects of recession as for the definition with
respect to 2 two consecutive quarters in relation to negative growth. It is one of the OECD
countries which did not had any experience of reservation and has avoided the GDP of negative
5ECONOMICS
urine during the global recession. Australia has the crisis of 2008-09 by virtue of certain factors
that included government stimulated spending, the proximity with the economy boom in China
along with other mining booms in Australia.
The growth of labour productivity has been continuing as well as expected to continue as
the principal determinant for growth in the living standards in Australia. Indore last 5 years prior
to 2015-16, there has been a growth of 1.8% annually which can be contrasted to 1.4% over the
last 15 years and 1.6 % over the last 30 years (Simon, 2019).
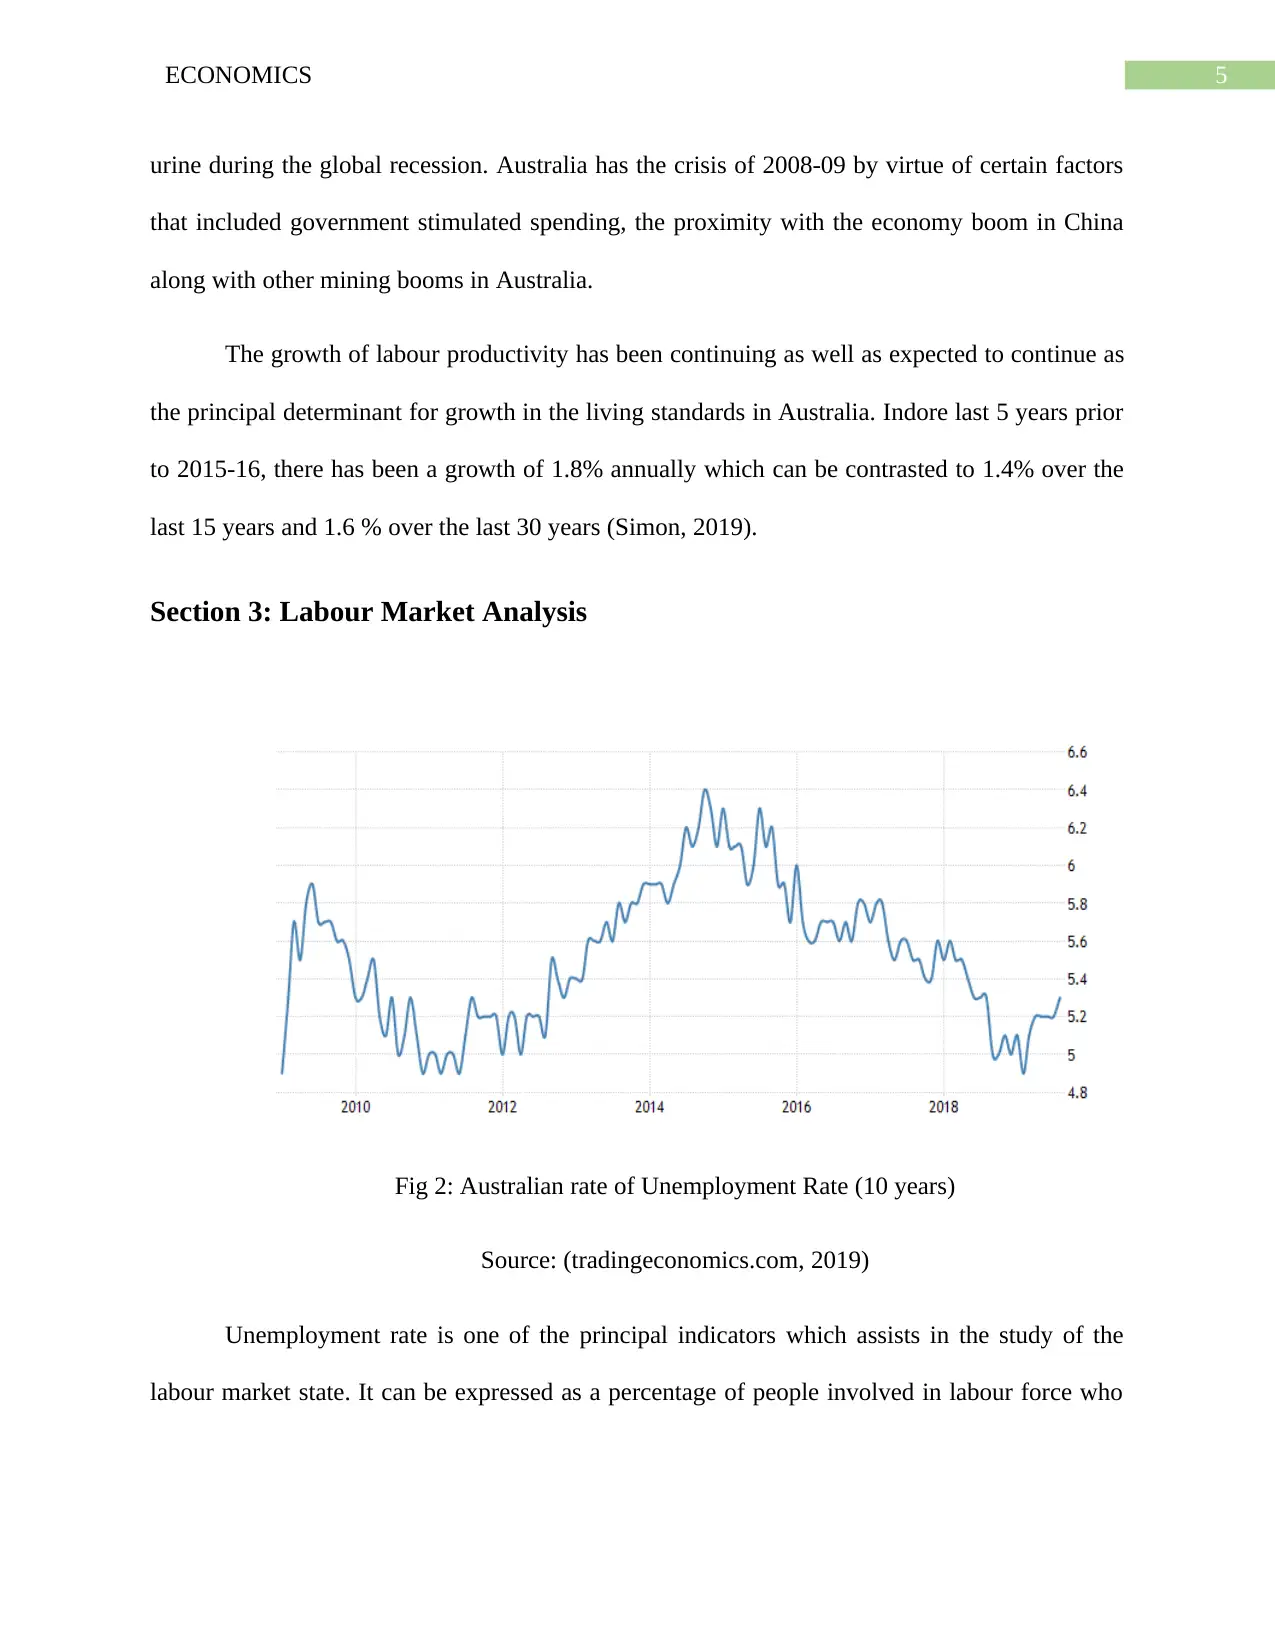
Section 3: Labour Market Analysis
Fig 2: Australian rate of Unemployment Rate (10 years)
Source: (tradingeconomics.com, 2019)
Unemployment rate is one of the principal indicators which assists in the study of the
labour market state. It can be expressed as a percentage of people involved in labour force who
urine during the global recession. Australia has the crisis of 2008-09 by virtue of certain factors
that included government stimulated spending, the proximity with the economy boom in China
along with other mining booms in Australia.
The growth of labour productivity has been continuing as well as expected to continue as
the principal determinant for growth in the living standards in Australia. Indore last 5 years prior
to 2015-16, there has been a growth of 1.8% annually which can be contrasted to 1.4% over the
last 15 years and 1.6 % over the last 30 years (Simon, 2019).
Section 3: Labour Market Analysis
Fig 2: Australian rate of Unemployment Rate (10 years)
Source: (tradingeconomics.com, 2019)
Unemployment rate is one of the principal indicators which assists in the study of the
labour market state. It can be expressed as a percentage of people involved in labour force who
⊘ This is a preview!⊘
Do you want full access?
Subscribe today to unlock all pages.
Trusted by 1+ million students worldwide
6ECONOMICS
have not been employed. It can be calculated by dividing the hundred times of the number of
unemployed individuals by the labour force. Mathematically,
Rate of unemployment = (No. of unemployed individuals * 100) / labour force
Another concept in relation to this topic is the employment to population ratio which
depicts the percentage of individuals belonging to the working age having a job. This can be
calculated by dividing the hundred times of the number of employed individual by the population
belonging to the working age. Mathematically,
Employment to population ratio = (no. of employed individuals * 100) / population
belonging to the working age
The concept labour force participation rate indicates the willingness of the individuals
belonging to the working age to indulge into work. This depicts the percentage of the individuals
belonging to the working age who have been the members belonging to labour force. This can be
calculated by dividing the hundred times of the labour force by the population belonging to the
working age. Mathematically,
Rate of labour force participation = (labour force * 100) / population belonging to the
working age
The typical kinds of unemployment can be of 3 variations belonging to an economy.
These are:
• Frictional unemployment
• Structural unemployment
• Cyclical unemployment
Paraphrase This Document
Need a fresh take? Get an instant paraphrase of this document with our AI Paraphraser
7ECONOMICS
Frictional unemployment depicts the form of unemployment in which the normal labour
turnover for individuals leaving or entering the labour force or even the continuous creation as
well as destruction of employment opportunities. This situation occurs when individuals are
temporarily looking for new jobs.
Structural unemployment on the other hand is said to have occurred when due to a
change in technology or an alteration in the international competition there has been a change in
the skills required for the performance of a job.
Cyclical unemployment depicts a situation where during the recession period owing to a
decline in the production output there has been fall in the participation of labour force.
There has been a fall in the rate of unemployment by 0.4% over the last year to 25.7
percent in the June of 2016. During this time span the individuals unemployed fell in number
over 40000 from 726000. The recent recorded low rate of employment in Australia has been in
April 2008 which accounted for 4.1 %.
One of the basic form of unemployment in Australia is the youth unemployment in which
labour force aged between 15 years and 24 years have been faced with unemployment. To
combat this form of employment the Government of Australia has introduced strategy for youth
employment which has been inculcated in their 2015-16 budget. Moreover another form of
unemployment in Australia is underemployment which indicates the underutilization of labour
force within the economy. Another form of unemployment that has been prominent in Australia
is the long term unemployment in which individuals are unemployed for a period of 12 months
or above (Keen, 2017).
8ECONOMICS
Section 4: Price Level
Inflation depicts of persistent rise within the price level and can be measured by the
utilisation of CPI (Consumer Price Index). The rate of inflation can be conceived as the change
in the percentage of price level with respect to 1 year towards the subsequent year. The
mathematical expression for the computation of inflation rate can be given as,
Inflation rate = [{CPI (Y1) – CPI (Y2)} * 100] / CPI (Y1)
The causes underlying inflation can be of two kinds. These are:
• Demand-pull inflation
• Cost push inflation
The demand pull inflation is safe to have caused when there has been an increase in
aggregate demand with respect to goods as well as services. Two conditions can be said to have
the ability to involve the demand pull inflation. The first condition is the increase in the
aggregate demand, during a situation at which the economy has been evidencing of full
employment with respect to resources. The second condition is the excess of demand with
respect to goods as well as services for each of the price level. The firms involved in this
situation presents their response by escalating the prices and raising the production they have
been involved in (Ciro, 2016).
Cost push inflation on the other hand has been involved with a persistent increase in the
production cost occurring independently with respect to aggregate demand. This kind of inflation
can be faced when the labour force has been forming unions and negotiating an escalation in the
remuneration pertaining to the workers, which has been in excess of the productivity. Such a
claim would escalate the unit production cost.
⊘ This is a preview!⊘
Do you want full access?
Subscribe today to unlock all pages.
Trusted by 1+ million students worldwide
9ECONOMICS
There are other causes behind the cost push inflation where there has been a rise in the
indirect taxes such as the GST which has been hiring the unit costs with respect to production
pertaining to the firms. It can also be evidenced by a decrease in the external value with respect
to domestic currency that has been promoting the increasing of expenses with respect to raw
materials which in turn would raise the unit production cost.
The inflation rate annually computed in Australia has been raised to 1.6% during June
quarter of 2019 from two and half year less with respect to 1.3 person as depicted in previous
period. As per the recent CPI readings it has been above the market consensus of about 1.5%.
The most affected regions are the food sector as well as the transport prices which has been
strongly impacted by the inflation in Australia.
The causes pertaining to inflation in Australia has been firstly the demand side factors
that it has been evidenced from greater confidence within the consumers, stronger confidence
within the business, rigorous growth with respect to household, good economic conditions low
interest rates over credits an expanding budget. There has been certain supply side factors that
includes efficiency as well as minimised production costs and availability with respect to
resources and profitability.
In Australia the inflation target has been resolved to maintain the annual inflation of
consumer price within the limit of two to three percent on an average. The Reserve Bank utilizes
this inflation target to assist the achievement of its goals with respect to price stability, full
employment prosperity and welfare belonging to the Australian individuals (www.bbc.com,
2019).
Paraphrase This Document
Need a fresh take? Get an instant paraphrase of this document with our AI Paraphraser
10ECONOMICS
Section 5: Conclusion
Hence, it can be concluded that Australia is the largest economy of mixed market
possessing a Gross Domestic Product (GDP) of approximately 1.69 trillion dollars having the
agricultural, services and manufacturing as its principle sector. The Australian GDP has
expanded to almost 1.4% year over year as per the reports conceived in June 2019. The recent
recorded low rate of employment in Australia has been in April 2008 which accounted for 4.1 %.
One of the basic form of unemployment in Australia is the youth unemployment in which labour
force aged between 15 years and 24 years have been faced with unemployment. The causes
pertaining to inflation in Australia has been firstly the demand side factors and supply side
factors.
11ECONOMICS
Reference
tradingeconomics.com. (2019). Australia GDP Growth Rate | 2019 | Data | Chart | Calendar |
Forecast | News. Retrieved 25 September 2019, from
https://tradingeconomics.com/australia/gdp-growth
https://tradingeconomics.com/australia/unemployment-rate. (2019). Australia Unemployment
Rate | 2019 | Data | Chart | Calendar | Forecast. Retrieved 25 September 2019, from
https://tradingeconomics.com/australia/unemployment-rate
www.bbc.com. (2019). Australia goes 25 years without recession. Retrieved 25 September 2019,
from https://www.bbc.com/news/business-39124272
Courvisanos, J., Jain, A., & K. Mardaneh, K. (2016). Economic resilience of regions under
crises: A study of the Australian economy. Regional Studies, 50(4), 629-643.
Keen, S. (2017). Can we avoid another financial crisis?. John Wiley & Sons.
Ciro, T. (2016). The global financial crisis: Triggers, responses and aftermath. Routledge.
Rees, D. M., Smith, P., & Hall, J. (2016). A Multi‐sector Model of the Australian Economy.
Economic Record, 92(298), 374-408.
Simon, J. (2019). Ten years of research—What have we learnt since the financial crisis?.
Economic Analysis and Policy, 64, 152-158.
⊘ This is a preview!⊘
Do you want full access?
Subscribe today to unlock all pages.
Trusted by 1+ million students worldwide
1 out of 12
Related Documents


Your All-in-One AI-Powered Toolkit for Academic Success.
+13062052269
info@desklib.com
Available 24*7 on WhatsApp / Email
![[object Object]](/_next/static/media/star-bottom.7253800d.svg)
Unlock your academic potential
© 2024 | Zucol Services PVT LTD | All rights reserved.