Value at Risk (VaR) Analysis of Australian Stocks
VerifiedAdded on 2020/03/23
|8
|1796
|100
AI Summary
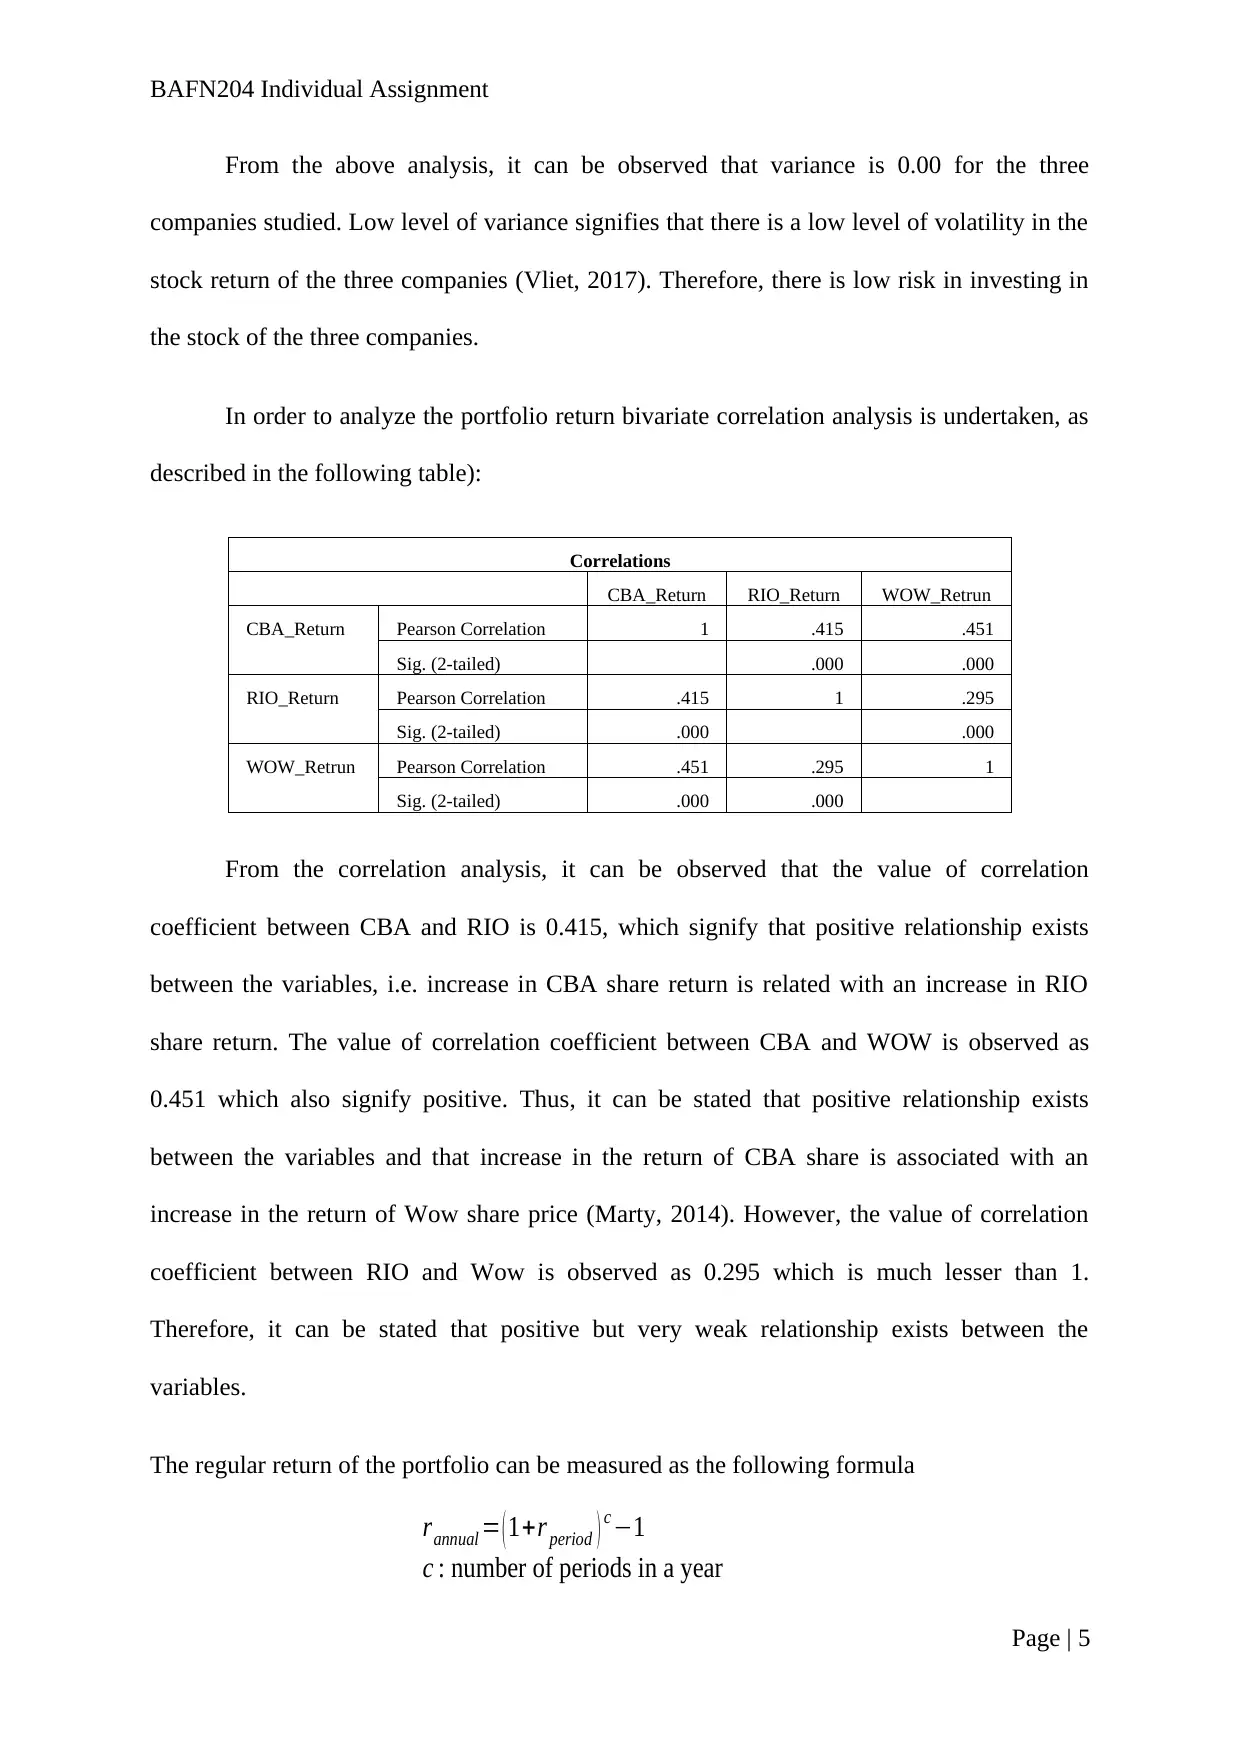
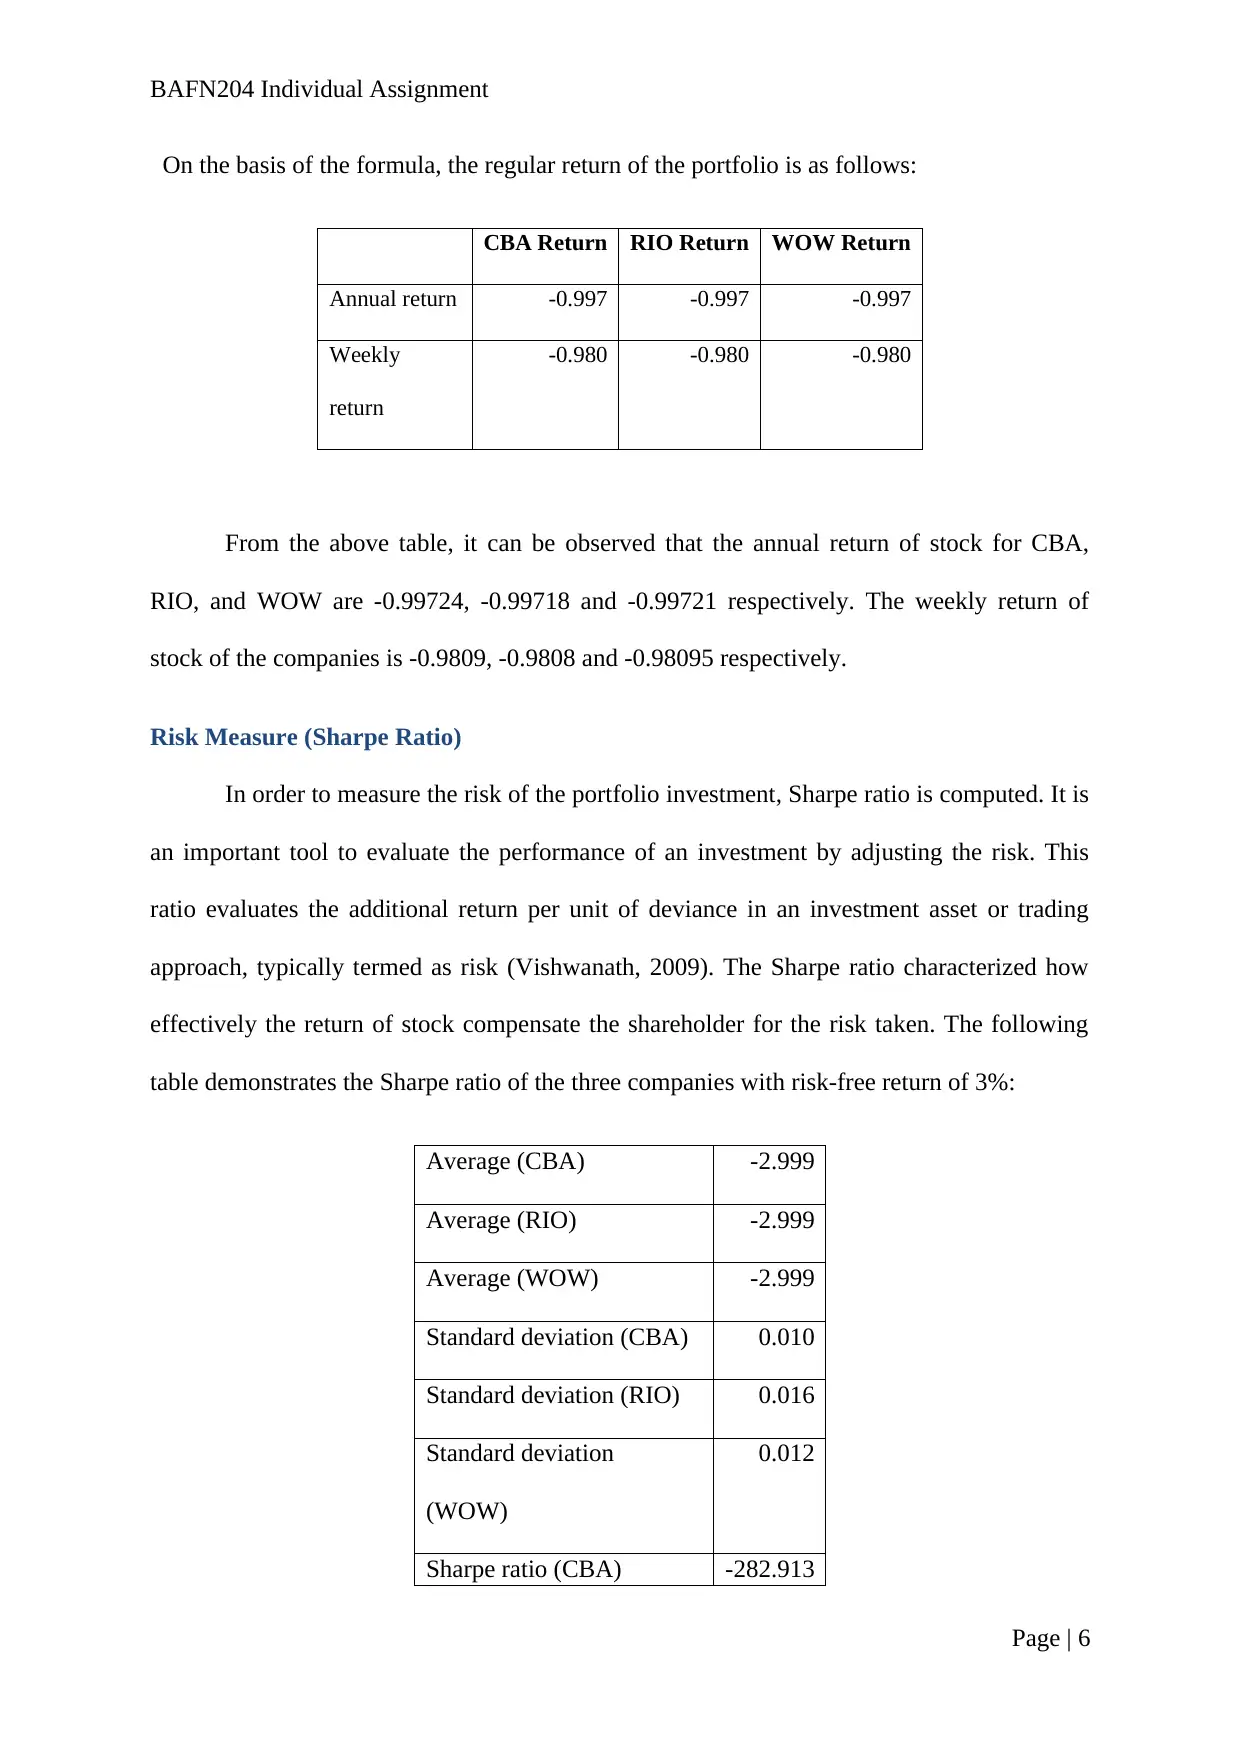
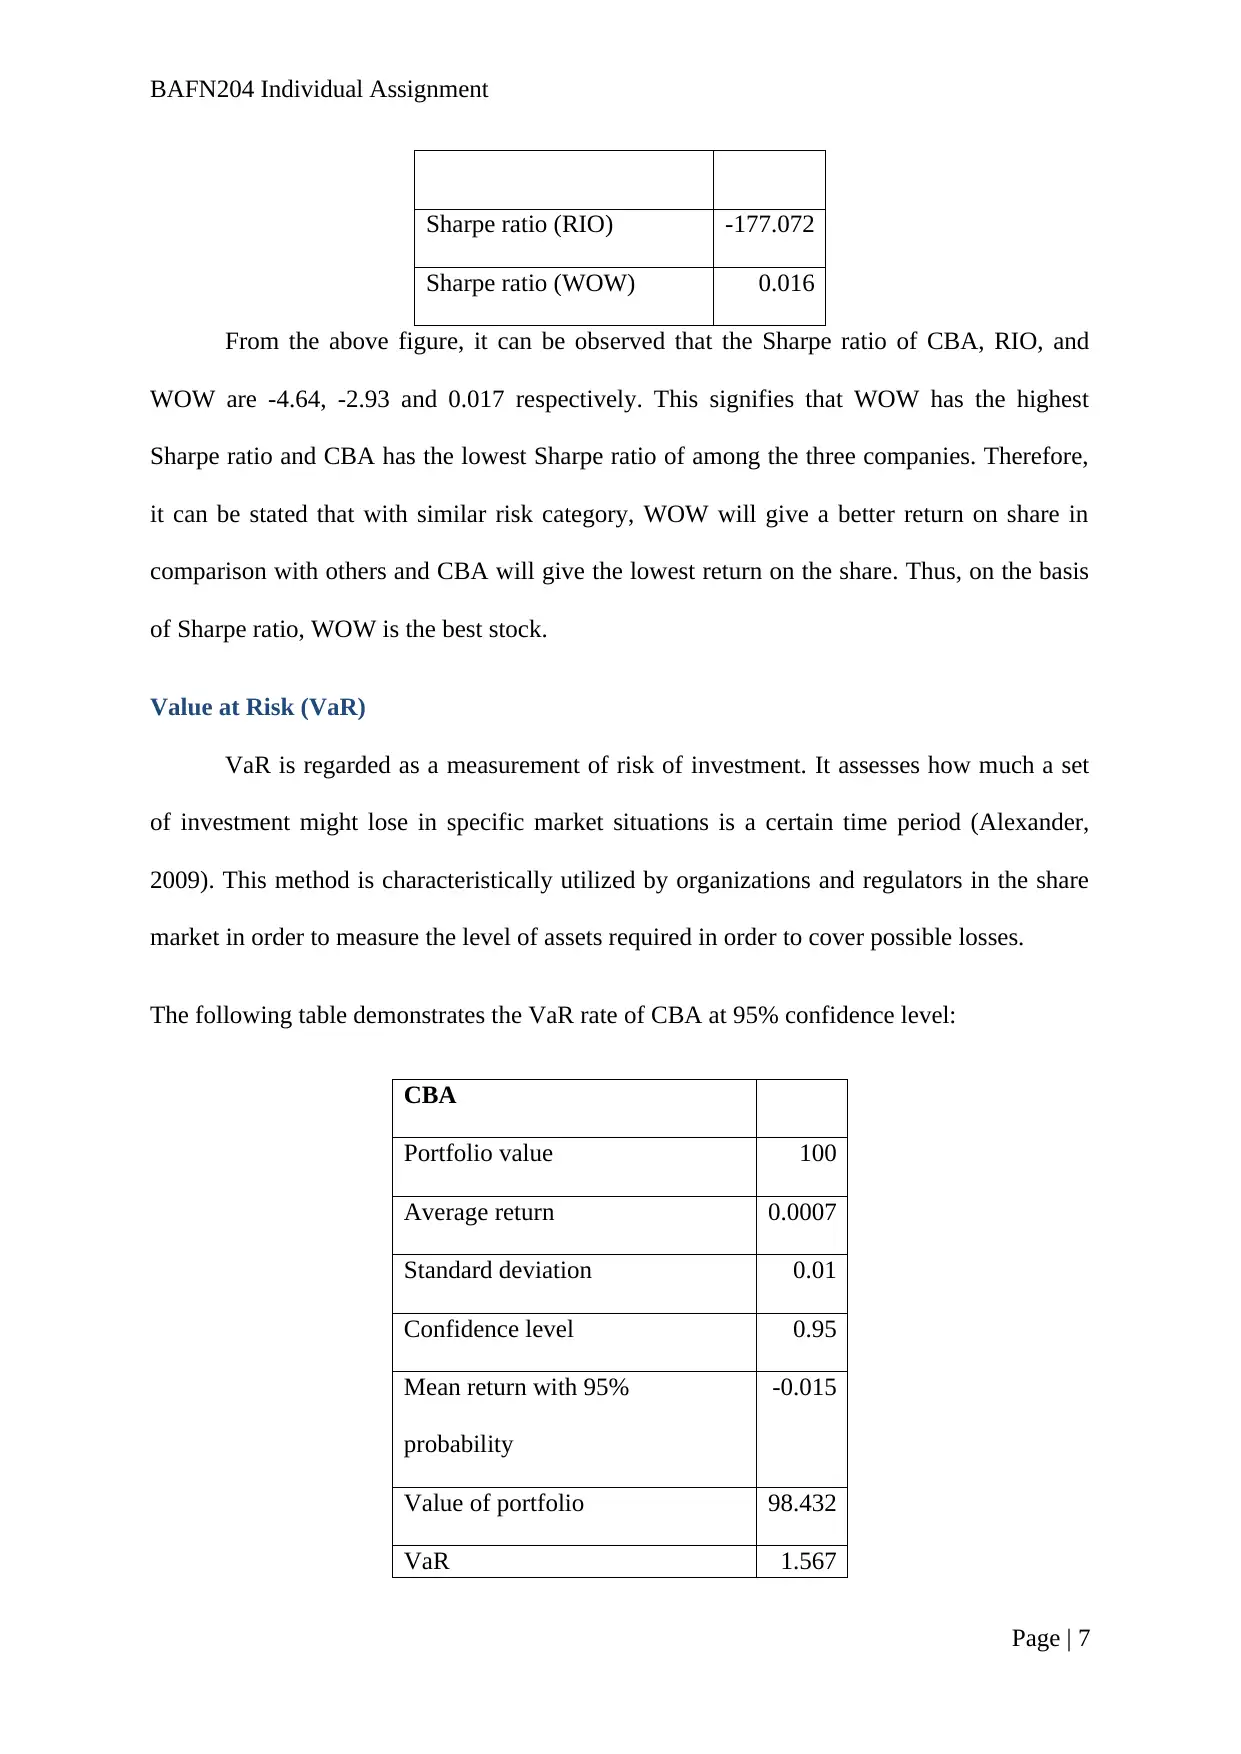
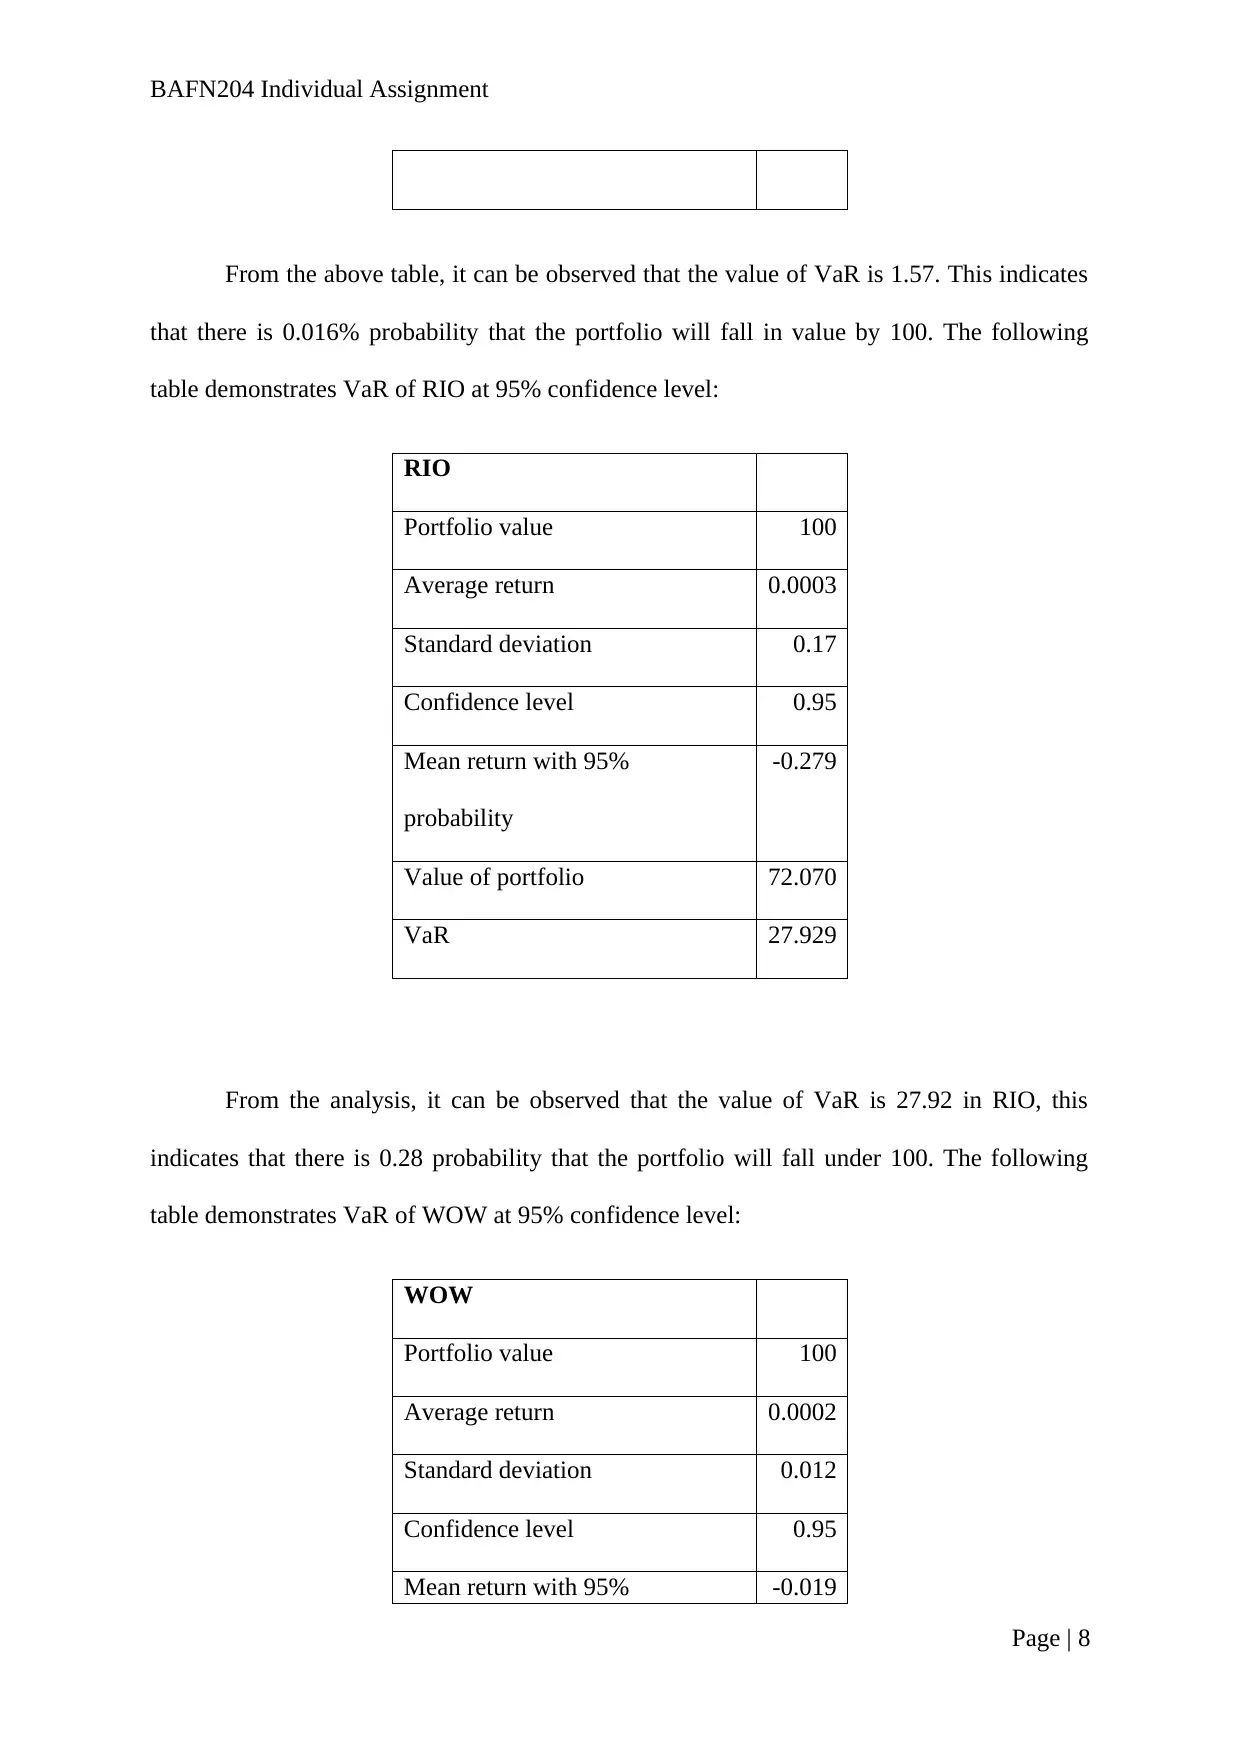
This assignment examines the concept of Value at Risk (VaR) and its application in assessing market risk. It focuses on calculating VaR for three Australian companies: Commonwealth Bank of Australia (CBA), Rio Tinto Limited (RIO), and Wesfarmers Limited (WOW). The analysis utilizes historical stock data to determine the potential loss in portfolio value over a given confidence level (95%). The results highlight the variability in VaR across different stocks, reflecting their unique risk profiles.
Contribute Materials
Your contribution can guide someone’s learning journey. Share your
documents today.
Running Head: BAFN204 INDIVIDUAL ASSIGNMENT
Student Name:
Course Name and Number:
Professor Name:
Institution:
Paper Due Date:
BAFN204 Portfolio Management: Investing Wisely
Individual Assignment
Page | 1
Student Name:
Course Name and Number:
Professor Name:
Institution:
Paper Due Date:
BAFN204 Portfolio Management: Investing Wisely
Individual Assignment
Page | 1
Secure Best Marks with AI Grader
Need help grading? Try our AI Grader for instant feedback on your assignments.
BAFN204 Individual Assignment
Analysis of Asset Return
Average Return and Maximum & Minimum Return
The following table demonstrates the average, maximum, and minimum returns of the three
companies of Australia:
Average return and maximum & minimum
CBA Return RIO Return WOW Return
Mean .0007 .0003 .0002
Median .001 .000 .000
Mode .000 .000 .000
Std. Deviation .010 .016 .012
Minimum -.058 -.075 -.097
Maximum .037 .089 .082
From the above analysis, it can be observed that the average return of CBA, RIO, and
WOW are 0.0008, 0.0003 and 0.00028 respectively, signifying that CBA has the highest
return and WOE has the lowest return among the three companies. The mid value of the
return of the three companies is 0.001, 0.00 and 0.00 respectively. However, a mode value of
return of all the three companies is observed as 0.00, i.e. most often no return has been
obtained from the stock of the three companies.
The maximum value of stock return in CBA, RIO, and WOW is observed as 0.037,
0.089 and 0.0824 respectively, which signify that RIO has the highest maximum return and
CBA has the lowest maximum return among the three companies. The minimum value of
return in the companies are -0.58, -0.75 and -0.98 respectively. It signifies that RIO has the
lowest and CBA has the highest minimum return among the companies.
The standard deviation of return for CBA, RIO, and WOW are 0.01, 0.16 and 0.12
respectively, it signifies that there is a high level of similarity with respect to the return of
share. There is not much difference with respect to the distribution of return among the three
companies.
Page | 2
BAFN204 Individual Assignment
Distribution of Returns
The following table demonstrates the distribution of return for the three companies
Descriptives
Statistic Std. Error
CBA Return Mean .0007 .0002
95% Confidence Interval for
Mean
Lower Bound .0001
Upper Bound .001
5% Trimmed Mean .0008
Median .001
Variance .000
Std. Deviation .010
Minimum -.058
Maximum .037
Range .095
Interquartile Range .012
Skewness -.258 .069
Kurtosis 1.915 .137
RIO Return Mean .0003 .0004
95% Confidence Interval for
Mean
Lower Bound -.0006
Upper Bound .001
5% Trimmed Mean .000
Median .000
Variance .000
Std. Deviation .016
Minimum -.075
Maximum .089
Range .164
Interquartile Range .020
Skewness .151 .069
Kurtosis 1.522 .137
WOW Return Mean .0002 .0003
95% Confidence Interval for
Mean
Lower Bound -.0004
Upper Bound .0009
5% Trimmed Mean .0002
Median .000
Variance .000
Std. Deviation .012
Minimum -.097
Maximum .082
Range .179
Page | 3
BAFN204 Individual Assignment
Interquartile Range .012
Skewness -.483 .069
Kurtosis 8.757 .137
From the above analysis, it can be observed that the value of Skewness for CBA, RIO,
and WOW are -0.258, 0.151 and -0.483 respectively. Since the value of Skewness is near
zero, it can be stated that the data of share return is symmetric (Medhi, 2002). Besides, it can
also be stated that the share data of CBA and WOW is skewed left and share return data of
RIO is skewed right.
Distribution
Kolmogorov Smirnov Shapiro Wilk
Statistic df Sig. Statistic df Sig.
CBA Return .044 1266 .000 .981 1266 .000
RIO Return .028 1266 .018 .989 1266 .000
WOW Return .063 1266 .000 .926 1266 .000
The above analysis represents outcome of two evaluation of distribution which is
Kolmogorov Smirnov test and Shapiro Wilk test. Since the sample size is more than 50, the
Kolmogorov Smirnov test will be appropriate (Ruppert, 2014). From the above table, it can
be observed that for CBA, RIO, and WOW, the P values are 0.00, 0.018 and 0.00
respectively which is less than the significance level of 0.05. Therefore, it can be stated that
for these three companies the stock market return is normally distributed.
Portfolio Return and Risk
In order to understand the risk of the portfolio, covariance analysis is undertaken for the stock
return of the three companies:
Descriptive Statistics
N Range Variance
CBA_Return 1266 .095 .000
RIO_Return 1266 .164 .000
WOW_Retrun 1266 .179 .000
Valid N (listwise) 1266
Page | 4
Secure Best Marks with AI Grader
Need help grading? Try our AI Grader for instant feedback on your assignments.
BAFN204 Individual Assignment
From the above analysis, it can be observed that variance is 0.00 for the three
companies studied. Low level of variance signifies that there is a low level of volatility in the
stock return of the three companies (Vliet, 2017). Therefore, there is low risk in investing in
the stock of the three companies.
In order to analyze the portfolio return bivariate correlation analysis is undertaken, as
described in the following table):
Correlations
CBA_Return RIO_Return WOW_Retrun
CBA_Return Pearson Correlation 1 .415 .451
Sig. (2-tailed) .000 .000
RIO_Return Pearson Correlation .415 1 .295
Sig. (2-tailed) .000 .000
WOW_Retrun Pearson Correlation .451 .295 1
Sig. (2-tailed) .000 .000
From the correlation analysis, it can be observed that the value of correlation
coefficient between CBA and RIO is 0.415, which signify that positive relationship exists
between the variables, i.e. increase in CBA share return is related with an increase in RIO
share return. The value of correlation coefficient between CBA and WOW is observed as
0.451 which also signify positive. Thus, it can be stated that positive relationship exists
between the variables and that increase in the return of CBA share is associated with an
increase in the return of Wow share price (Marty, 2014). However, the value of correlation
coefficient between RIO and Wow is observed as 0.295 which is much lesser than 1.
Therefore, it can be stated that positive but very weak relationship exists between the
variables.
The regular return of the portfolio can be measured as the following formula
Page | 5
rannual = ( 1+r period ) c −1
c : number of periods in a year
BAFN204 Individual Assignment
On the basis of the formula, the regular return of the portfolio is as follows:
CBA Return RIO Return WOW Return
Annual return -0.997 -0.997 -0.997
Weekly
return
-0.980 -0.980 -0.980
From the above table, it can be observed that the annual return of stock for CBA,
RIO, and WOW are -0.99724, -0.99718 and -0.99721 respectively. The weekly return of
stock of the companies is -0.9809, -0.9808 and -0.98095 respectively.
Risk Measure (Sharpe Ratio)
In order to measure the risk of the portfolio investment, Sharpe ratio is computed. It is
an important tool to evaluate the performance of an investment by adjusting the risk. This
ratio evaluates the additional return per unit of deviance in an investment asset or trading
approach, typically termed as risk (Vishwanath, 2009). The Sharpe ratio characterized how
effectively the return of stock compensate the shareholder for the risk taken. The following
table demonstrates the Sharpe ratio of the three companies with risk-free return of 3%:
Average (CBA) -2.999
Average (RIO) -2.999
Average (WOW) -2.999
Standard deviation (CBA) 0.010
Standard deviation (RIO) 0.016
Standard deviation
(WOW)
0.012
Sharpe ratio (CBA) -282.913
Page | 6
BAFN204 Individual Assignment
Sharpe ratio (RIO) -177.072
Sharpe ratio (WOW) 0.016
From the above figure, it can be observed that the Sharpe ratio of CBA, RIO, and
WOW are -4.64, -2.93 and 0.017 respectively. This signifies that WOW has the highest
Sharpe ratio and CBA has the lowest Sharpe ratio of among the three companies. Therefore,
it can be stated that with similar risk category, WOW will give a better return on share in
comparison with others and CBA will give the lowest return on the share. Thus, on the basis
of Sharpe ratio, WOW is the best stock.
Value at Risk (VaR)
VaR is regarded as a measurement of risk of investment. It assesses how much a set
of investment might lose in specific market situations is a certain time period (Alexander,
2009). This method is characteristically utilized by organizations and regulators in the share
market in order to measure the level of assets required in order to cover possible losses.
The following table demonstrates the VaR rate of CBA at 95% confidence level:
CBA
Portfolio value 100
Average return 0.0007
Standard deviation 0.01
Confidence level 0.95
Mean return with 95%
probability
-0.015
Value of portfolio 98.432
VaR 1.567
Page | 7
Paraphrase This Document
Need a fresh take? Get an instant paraphrase of this document with our AI Paraphraser
BAFN204 Individual Assignment
From the above table, it can be observed that the value of VaR is 1.57. This indicates
that there is 0.016% probability that the portfolio will fall in value by 100. The following
table demonstrates VaR of RIO at 95% confidence level:
From the analysis, it can be observed that the value of VaR is 27.92 in RIO, this
indicates that there is 0.28 probability that the portfolio will fall under 100. The following
table demonstrates VaR of WOW at 95% confidence level:
WOW
Portfolio value 100
Average return 0.0002
Standard deviation 0.012
Confidence level 0.95
Mean return with 95% -0.019
Page | 8
RIO
Portfolio value 100
Average return 0.0003
Standard deviation 0.17
Confidence level 0.95
Mean return with 95%
probability
-0.279
Value of portfolio 72.070
VaR 27.929
1 out of 8
Related Documents
Your All-in-One AI-Powered Toolkit for Academic Success.
+13062052269
info@desklib.com
Available 24*7 on WhatsApp / Email
Unlock your academic potential
© 2024 | Zucol Services PVT LTD | All rights reserved.