Statistics Homework: Exploring Relationships Between BMI and Activity
VerifiedAdded on 2023/06/03
|16
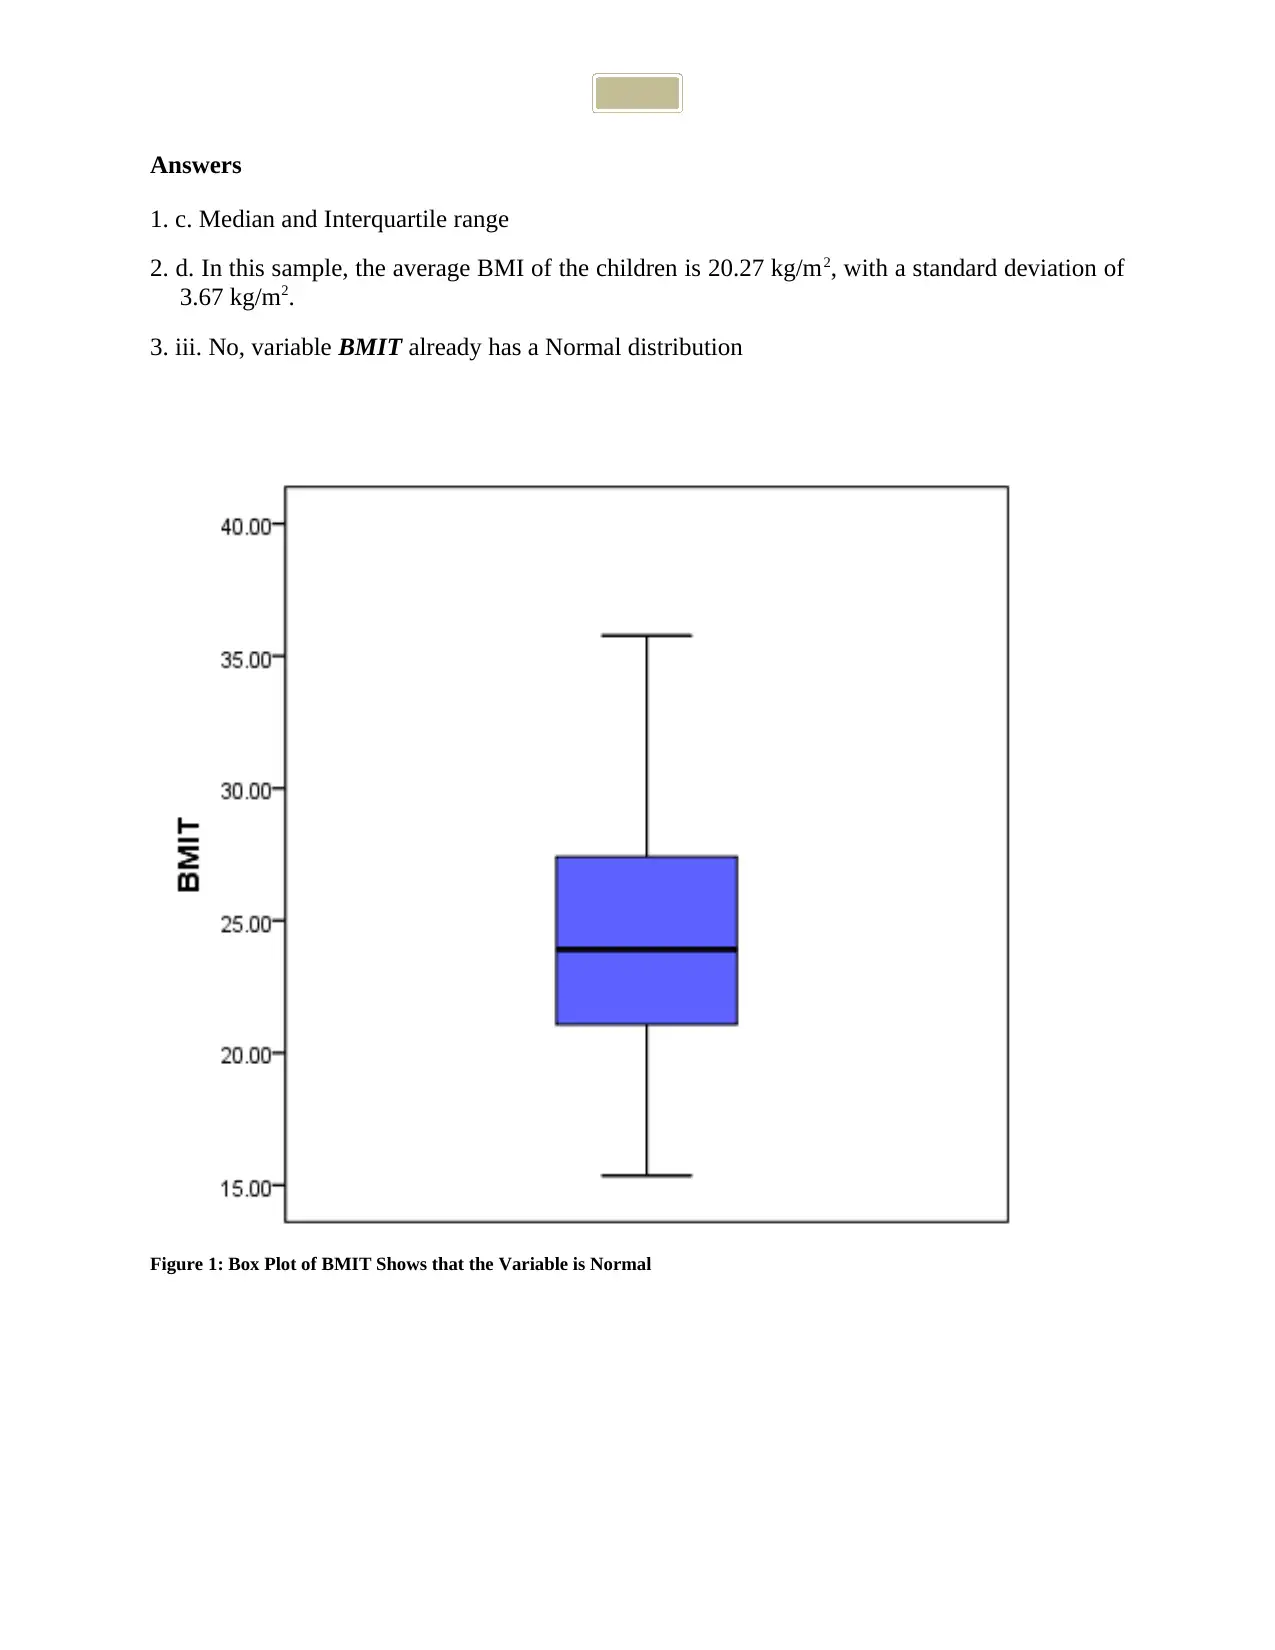
|2344
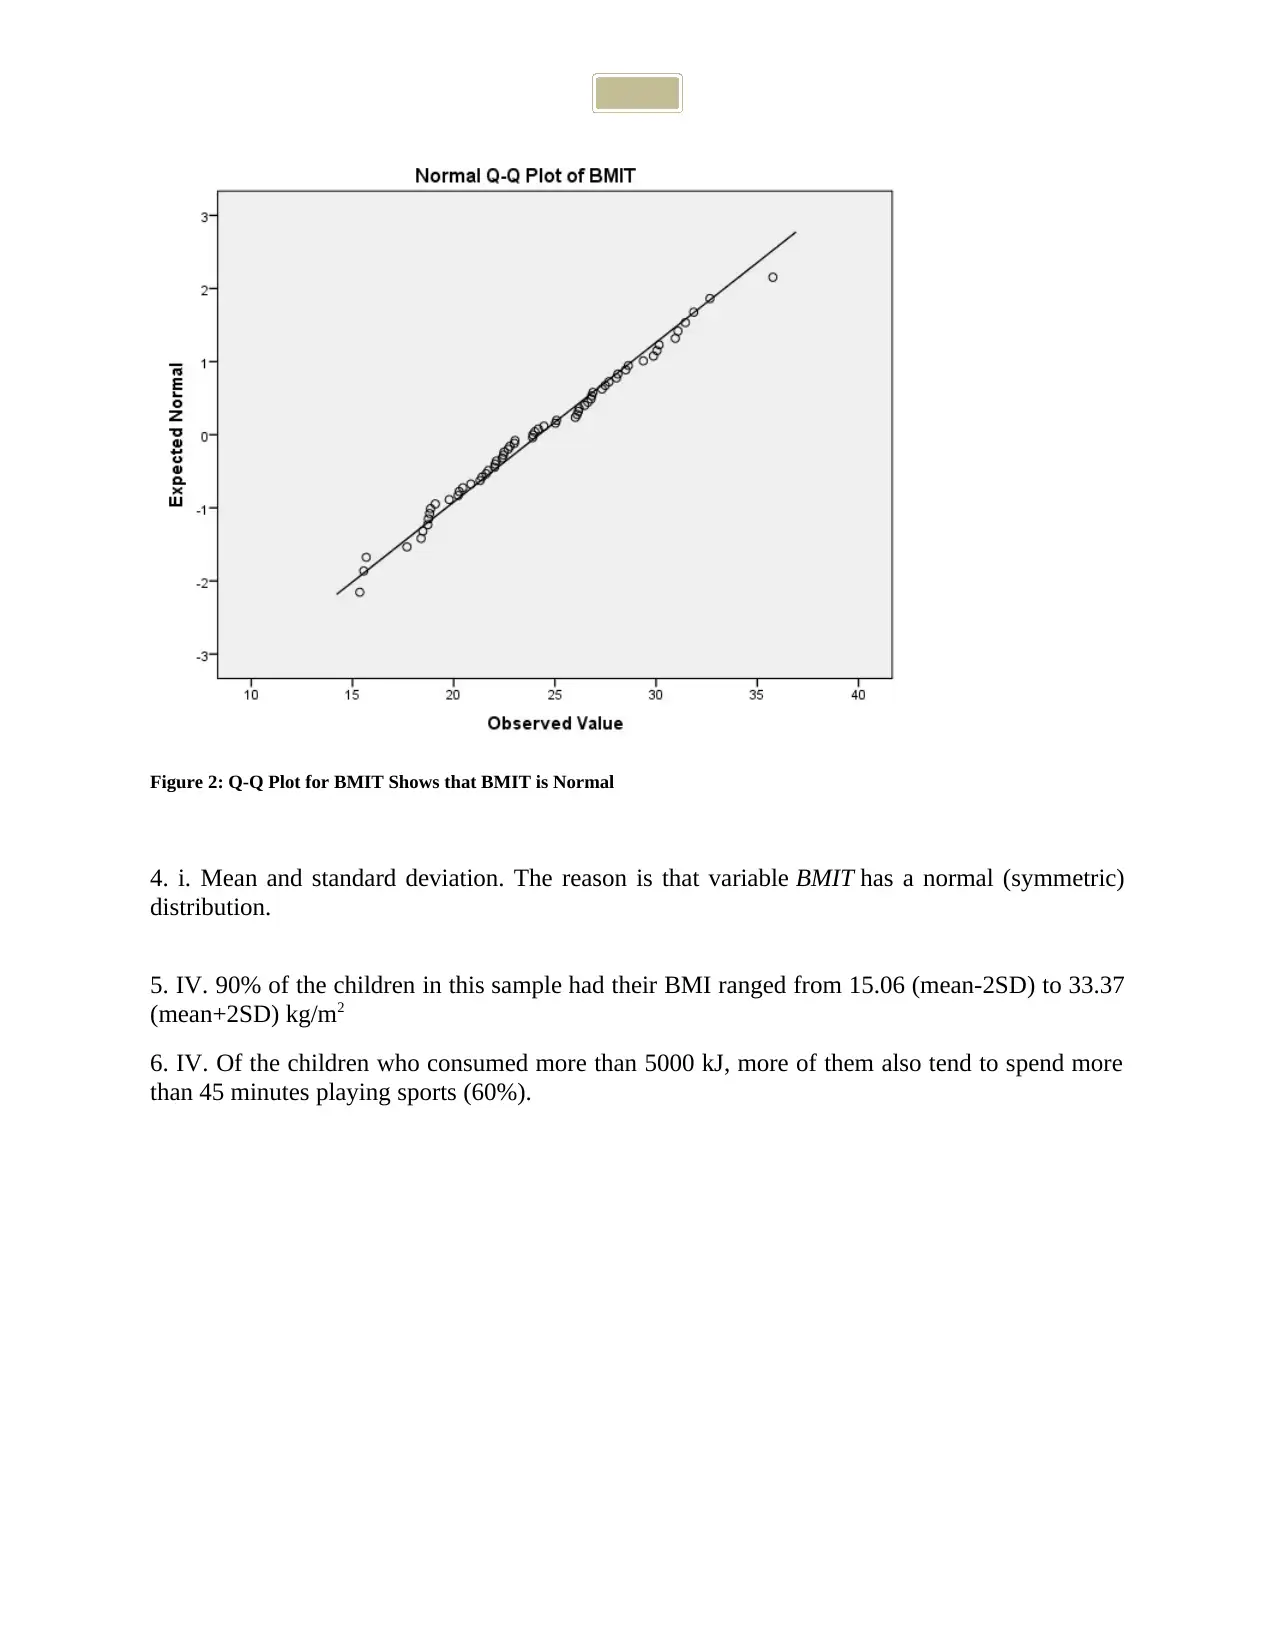
|388
Homework Assignment
AI Summary
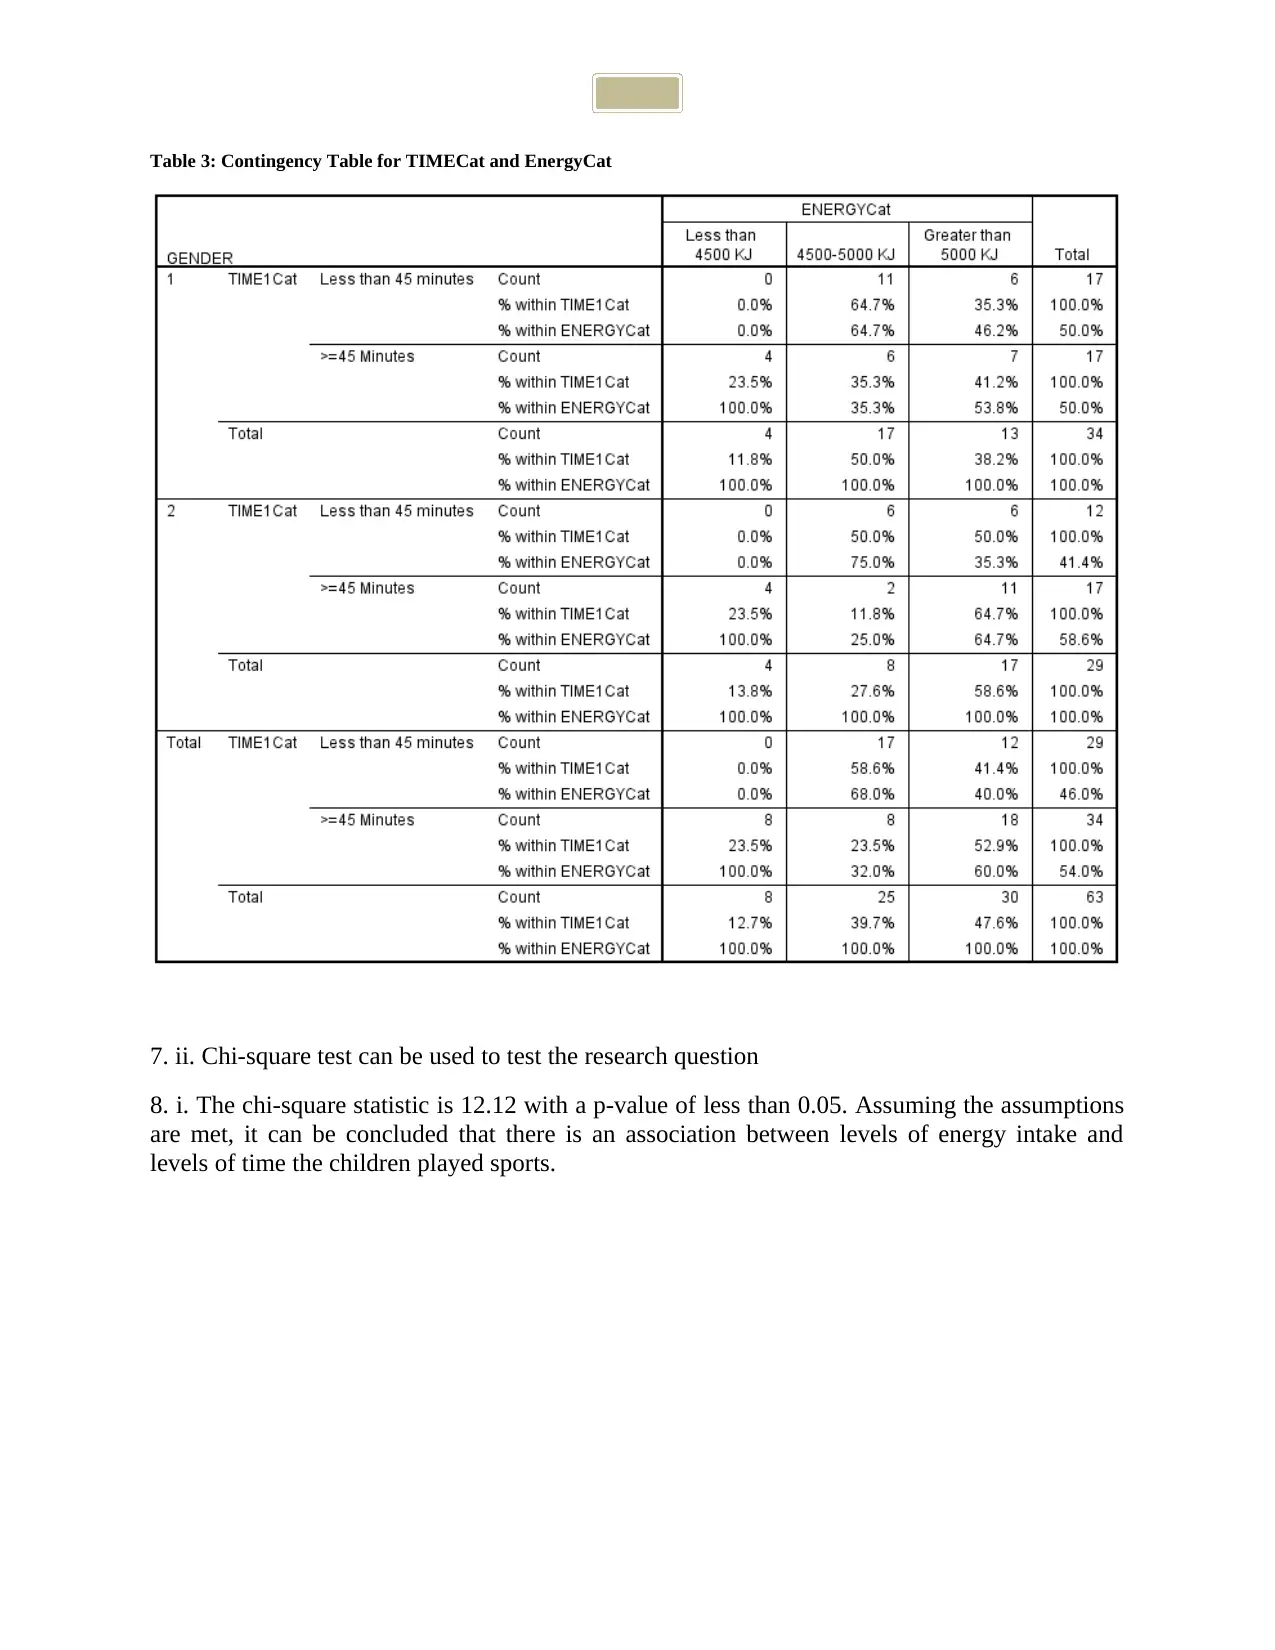
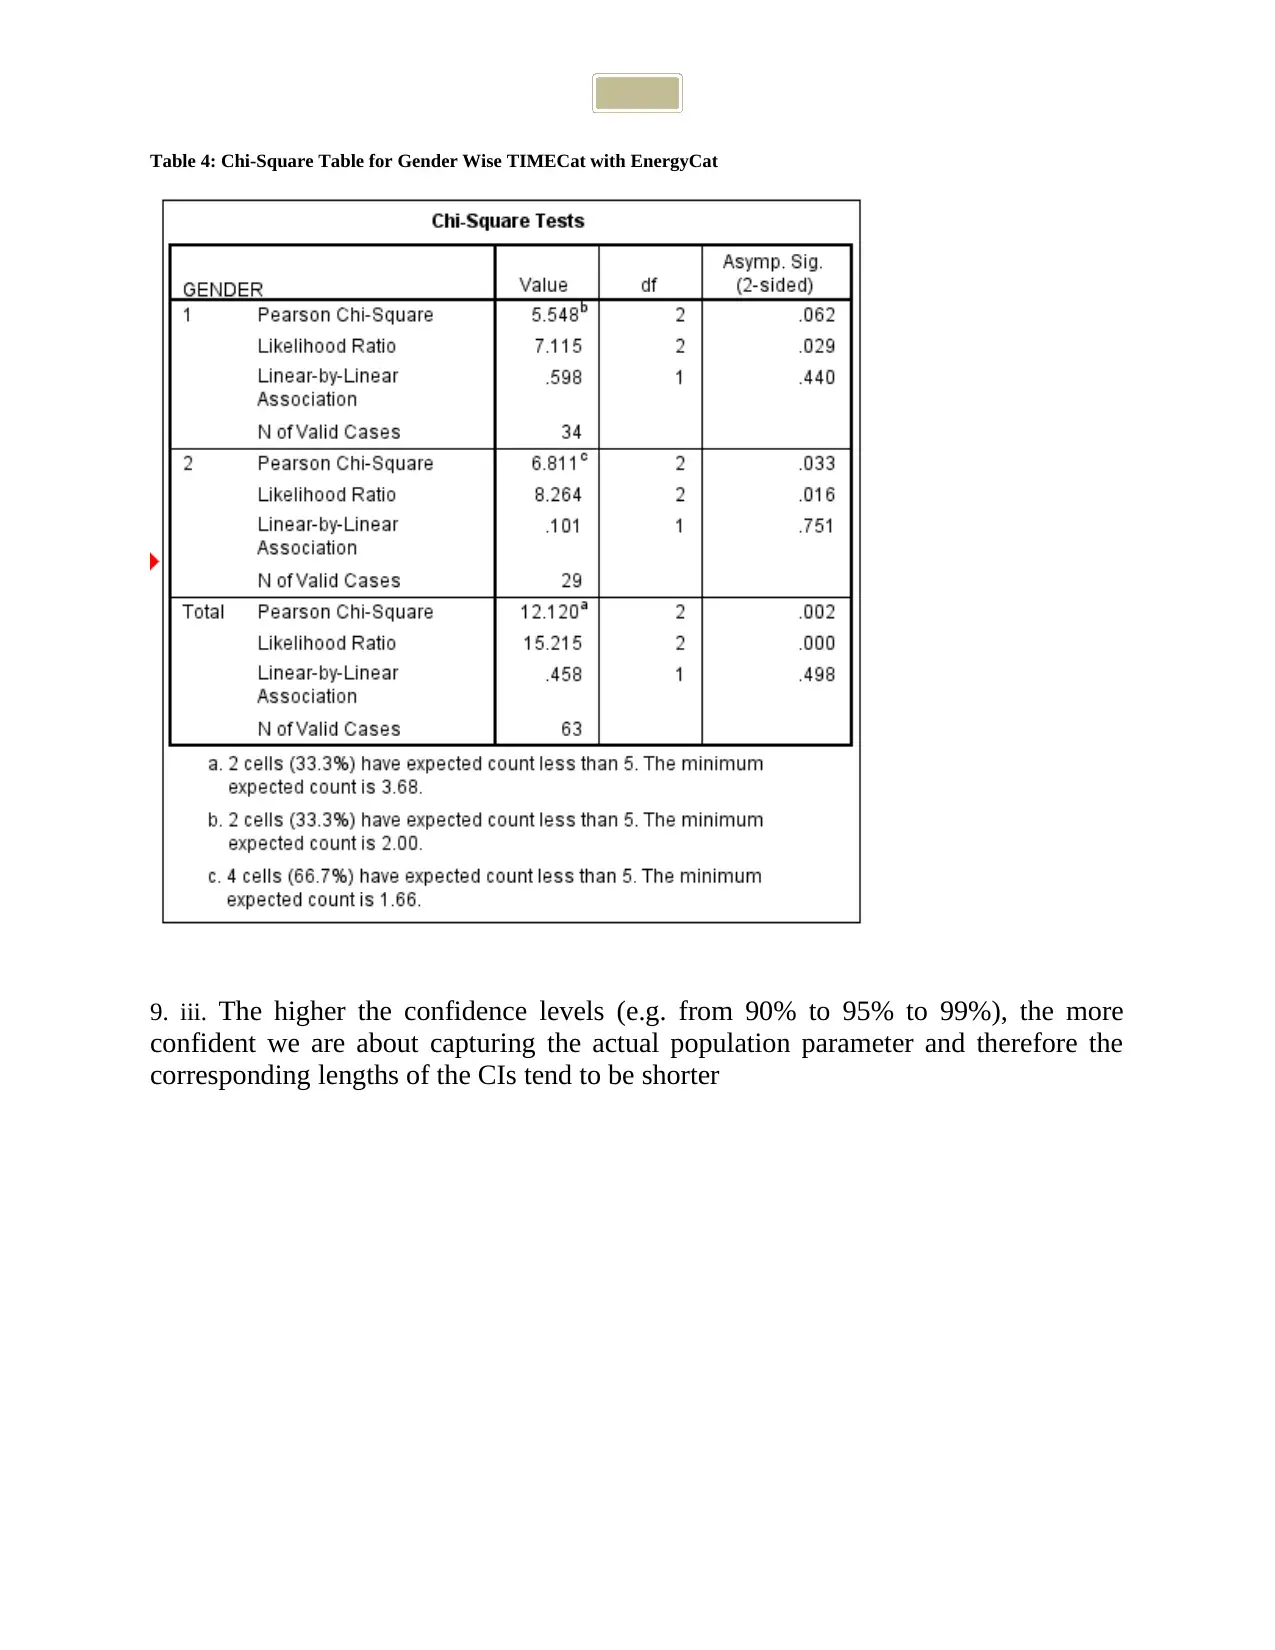
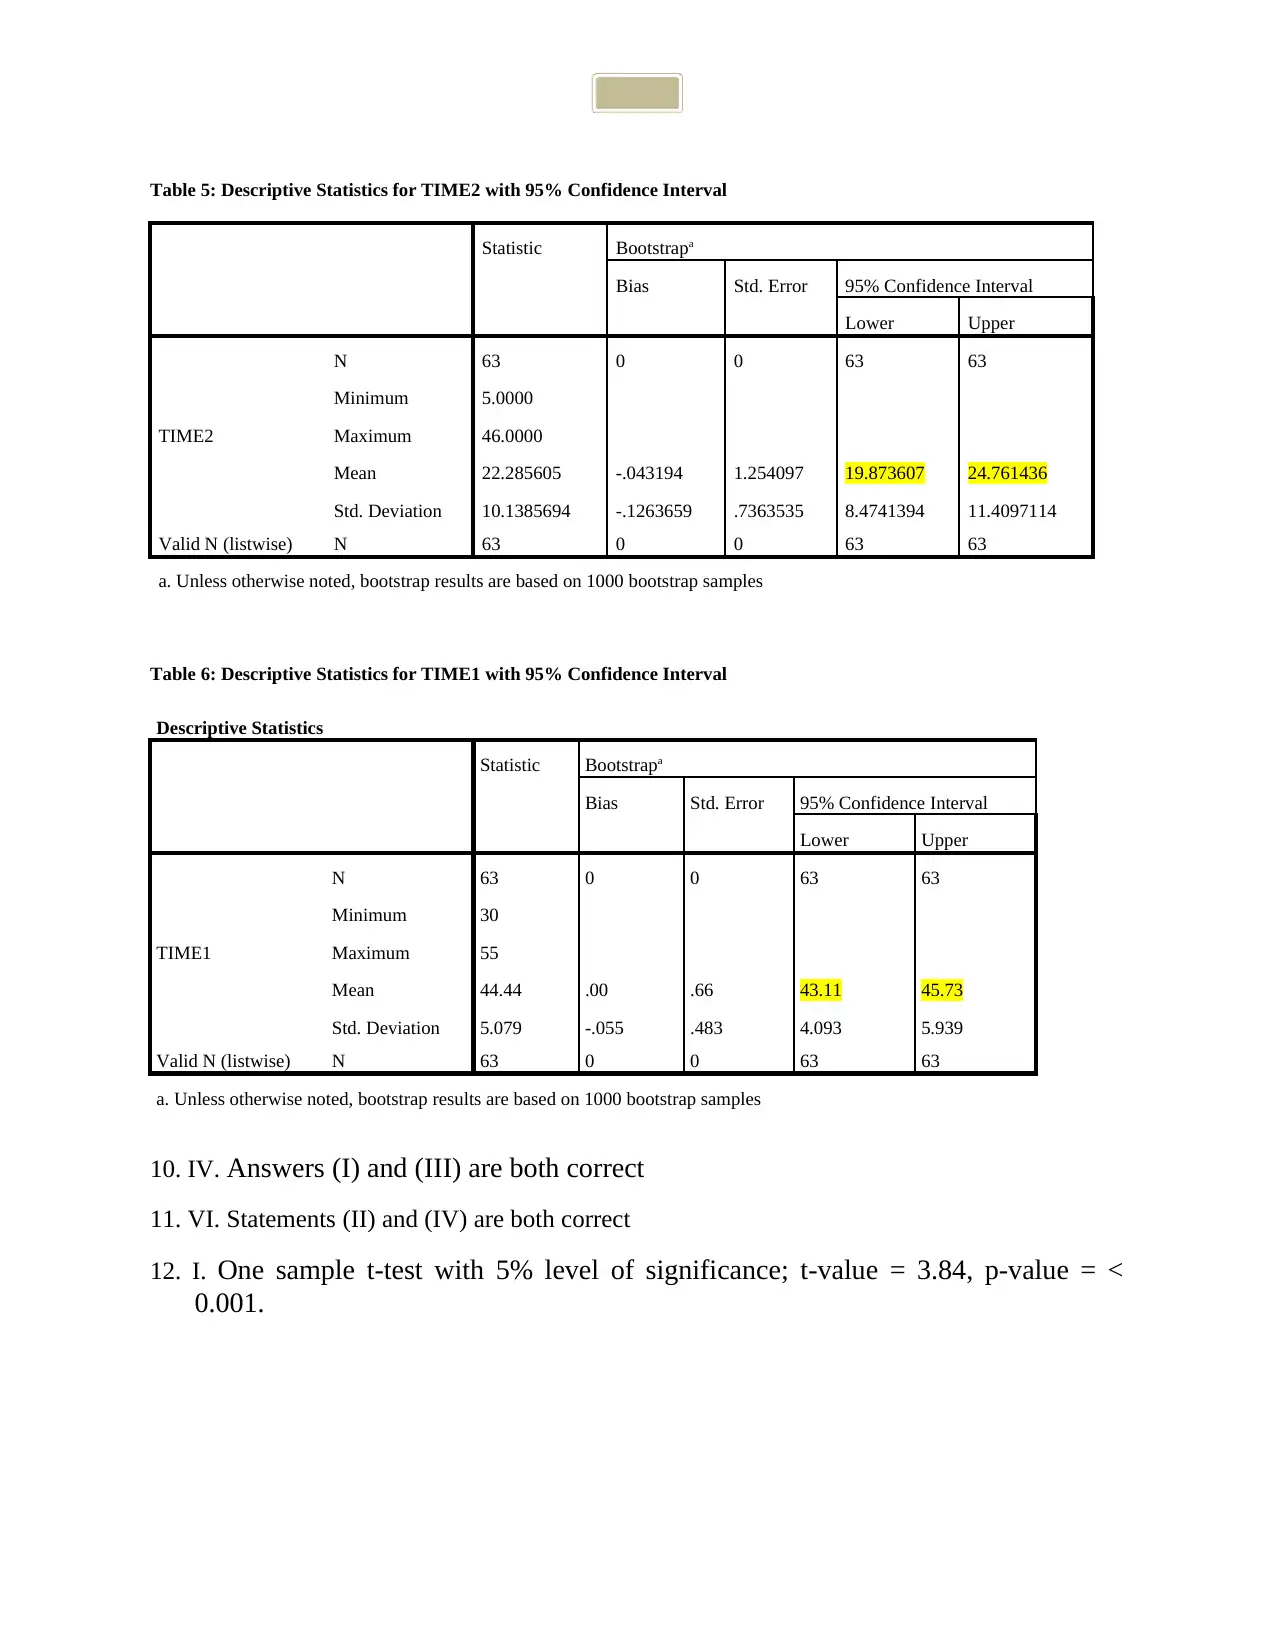
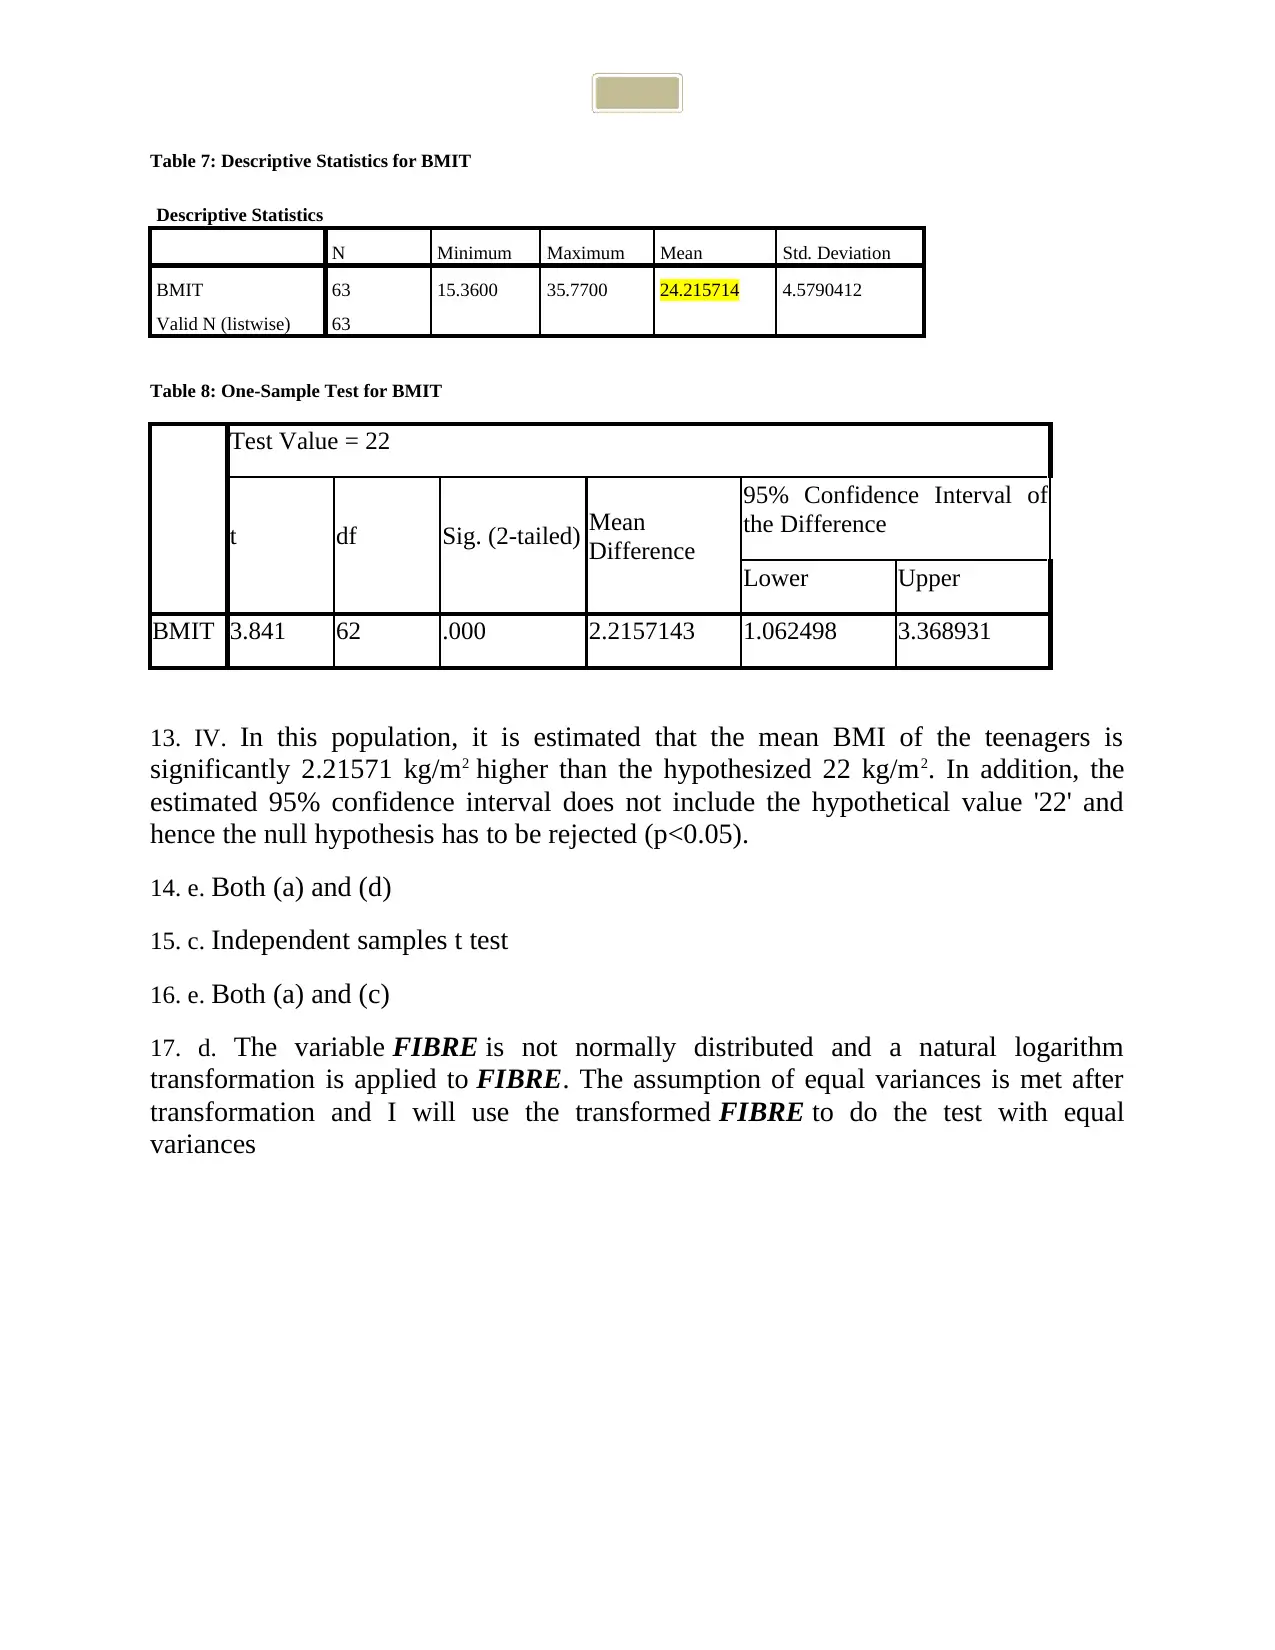
This assignment solution covers a range of statistical analyses related to Body Mass Index (BMI) and sports activity among children and teenagers. It includes descriptive statistics, normality tests, chi-square tests for association, t-tests for comparing means, ANOVA for group comparisons, and regression analysis to predict BMI based on activity levels. The solution provides answers to multiple-choice questions with justifications based on SPSS outputs, addressing topics such as appropriate statistical measures, hypothesis testing, confidence intervals, and the interpretation of statistical results. Outputs generated from SPSS as evidence to support the answers for questions have been provided. The analysis explores relationships between energy intake, time spent playing sports, gender, and BMI, offering a comprehensive overview of statistical methods applied to health-related data. The document is a student contribution available on Desklib, a platform offering AI-based study tools and a wide array of solved assignments and past papers.
1 out of 16
Related Documents


Your All-in-One AI-Powered Toolkit for Academic Success.
+13062052269
info@desklib.com
Available 24*7 on WhatsApp / Email
![[object Object]](/_next/static/media/star-bottom.7253800d.svg)
Copyright © 2020–2026 A2Z Services. All Rights Reserved. Developed and managed by ZUCOL.