logo

BSB123 Data Analysis Research Report

Investigating the causes of high student attrition rates in the Science Department of a university in Queensland by analyzing the academic performance and other variables of first-year science students.

7 Pages1649 Words219 Views
   

Added on  2023-06-03

About This Document

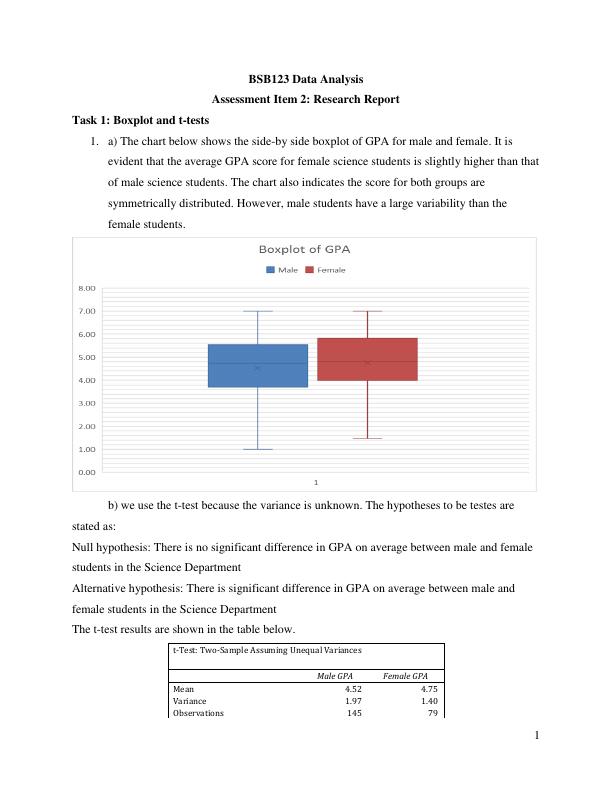
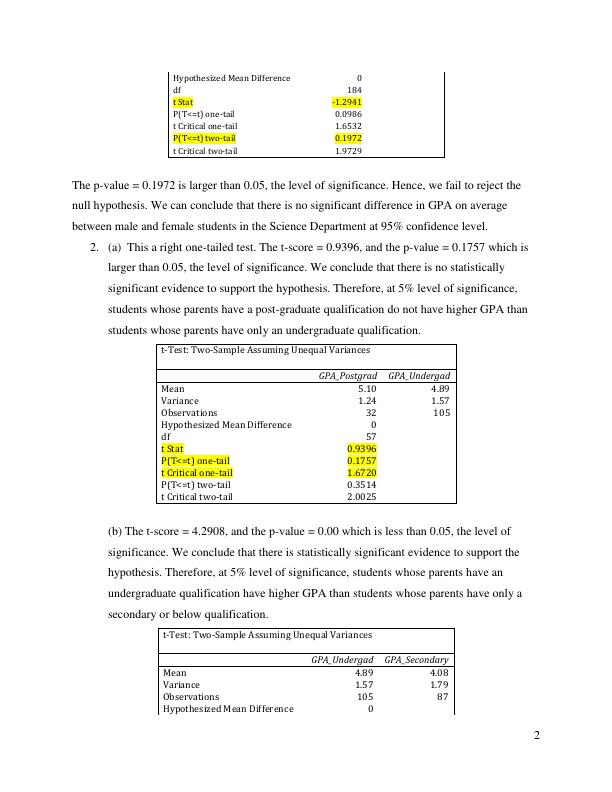
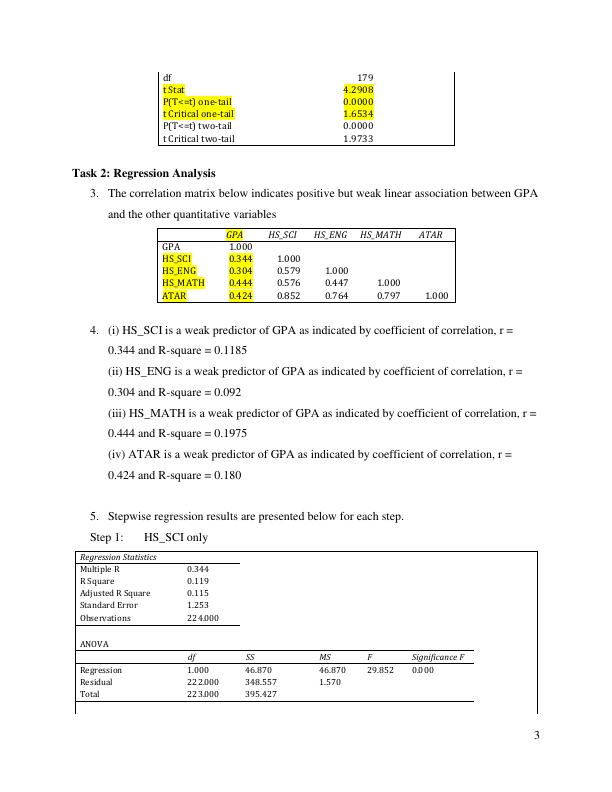
This report presents the results of boxplot, t-tests, and regression analysis in BSB123 Data Analysis. The report includes the hypotheses, t-test results, correlation matrix, and stepwise regression results. The report also discusses the predictors of GPA and the inclusion of ATAR in the model.

BSB123 Data Analysis Research Report

Investigating the causes of high student attrition rates in the Science Department of a university in Queensland by analyzing the academic performance and other variables of first-year science students.

   Added on 2023-06-03

ShareRelated Documents
1
BSB123 Data Analysis

Assessment Item 2: Research Report

Task 1: Boxplot and t-tests

1. a) The chart below shows the side-by side boxplot of GPA for male and female. It is
evident that the average GPA score for female science students is slightly higher than that
of male science students. The chart also indicates the score for both groups are
symmetrically distributed. However, male students have a large variability than the
female students.

b) we use the t-test because the variance is unknown. The hypotheses to be testes are
stated as:

Null hypothesis: There is no significant difference in GPA on average between male and female
students in the Science Department

Alternative hypothesis: There is significant difference in GPA on average between male and
female students in the Science Department

The t-test results are shown in the table below.

t-Test: Two-Sample Assuming Unequal Variances

Male GPA
Female GPA
Mean
4.52 4.75
Variance
1.97 1.40
Observations
145 79
BSB123 Data Analysis Research Report_1
2
Hypothesized Mean Difference
0
df
184
t Stat
-1.2941
P(T<=t) one-tail
0.0986
t Critical one-tail
1.6532
P(T<=t) two-tail
0.1972
t Critical two-tail
1.9729
The p-value = 0.1972 is larger than 0.05, the level of significance. Hence, we fail to reject the
null hypothesis. We can conclude that there is no significant difference in GPA on average
between male and female students in the Science Department at 95% confidence level.

2.
(a) This a right one-tailed test. The t-score = 0.9396, and the p-value = 0.1757 which is
larger than 0.05, the level of significance. We conclude that there is no statistically
significant evidence to support the hypothesis. Therefore, at 5% level of significance,

students whose parents have a post-graduate qualification do not have higher GPA than
students whose parents have only an undergraduate qualification.

t-Test: Two-Sample Assuming Unequal Variances

GPA_Postgrad
GPA_Undergad
Mean
5.10 4.89
Variance
1.24 1.57
Observations
32 105
Hypothesized Mean Difference
0
df
57
t Stat
0.9396
P(T<=t) one-tail
0.1757
t Critical one-tail
1.6720
P(T<=t) two-tail
0.3514
t Critical two-tail
2.0025
(b)
The t-score = 4.2908, and the p-value = 0.00 which is less than 0.05, the level of
significance. We conclude that there is statistically significant evidence to support the
hypothesis. Therefore, at 5% level of significance,
students whose parents have an
undergraduate qualification have higher GPA than students whose parents have only a
secondary or below qualification.

t-Test: Two-Sample Assuming Unequal Variances

GPA_Undergad
GPA_Secondary
Mean
4.89 4.08
Variance
1.57 1.79
Observations
105 87
Hypothesized Mean Difference
0
BSB123 Data Analysis Research Report_2
3
df
179
t Stat
4.2908
P(T<=t) one-tail
0.0000
t Critical one-tail
1.6534
P(T<=t) two-tail
0.0000
t Critical two-tail
1.9733
Task 2: Regression Analysis

3. The correlation matrix below indicates positive but weak linear association between GPA
and the other quantitative variables

GPA
HS_SCI HS_ENG HS_MATH ATAR
GPA
1.000
HS_SCI
0.344 1.000
HS_ENG
0.304 0.579 1.000
HS_MATH
0.444 0.576 0.447 1.000
ATAR
0.424 0.852 0.764 0.797 1.000
4. (i) HS_SCI is a weak predictor of GPA as indicated by coefficient of correlation, r =
0.344 and R-square = 0.1185

(ii) HS_ENG is a weak predictor of GPA as indicated by coefficient of correlation, r =
0.304 and R-square = 0.092

(iii) HS_MATH is a weak predictor of GPA as indicated by coefficient of correlation, r =
0.444 and R-square = 0.1975

(iv) ATAR is a weak predictor of GPA as indicated by coefficient of correlation, r =
0.424 and R-square = 0.180

5. Stepwise regression results are presented below for each step.

Step 1: HS_SCI only

Regression Statistics

Multiple R
0.344
R Square
0.119
Adjusted R Square
0.115
Standard Error
1.253
Observations
224.000
ANOVA

df
SS MS F Significance F
Regression
1.000 46.870 46.870 29.852 0.000
Residual
222.000 348.557 1.570
Total
223.000 395.427
BSB123 Data Analysis Research Report_3

End of preview

Want to access all the pages? Upload your documents or become a member.

Related Documents
Data Analysis: Correlation, Regression and Hypothesis Testing
|9
|2835
|336

Data Analysis Report for Student GPA
|14
|1450
|447

Statistics: Analysis and Results
|6
|725
|66

Statistical Analysis of Sex Differences and Obesity Levels
|4
|916
|177

Data Analysis Report
|10
|1529
|56

Data Analysis: Box plot, t-tests, and Regression Analysis
|14
|1588
|320