Statistics: Analysis and Results
In this assignment, students are required to come up with research questions, collect numerical data from two different populations or treatments, and analyze the data to make comparisons between the means and proportions of the two groups.
6 Pages725 Words66 Views
Added on 2023-01-13
About This Document
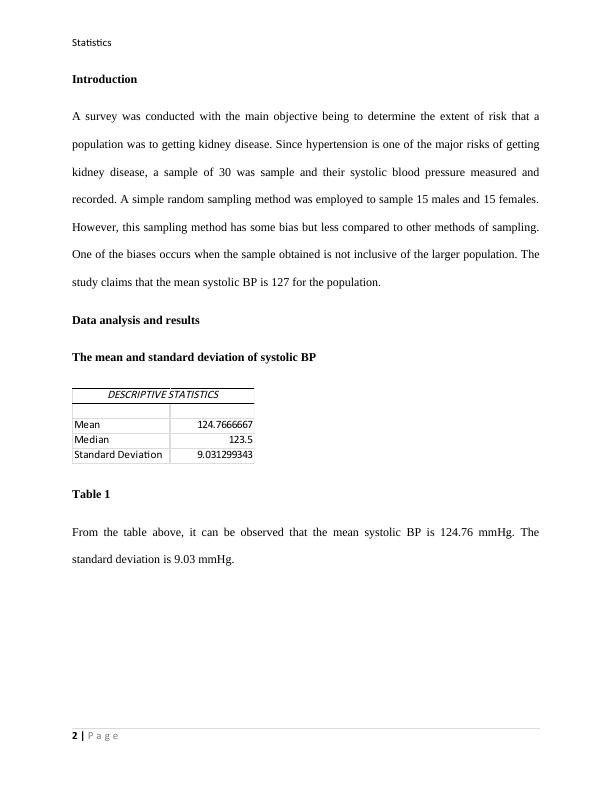
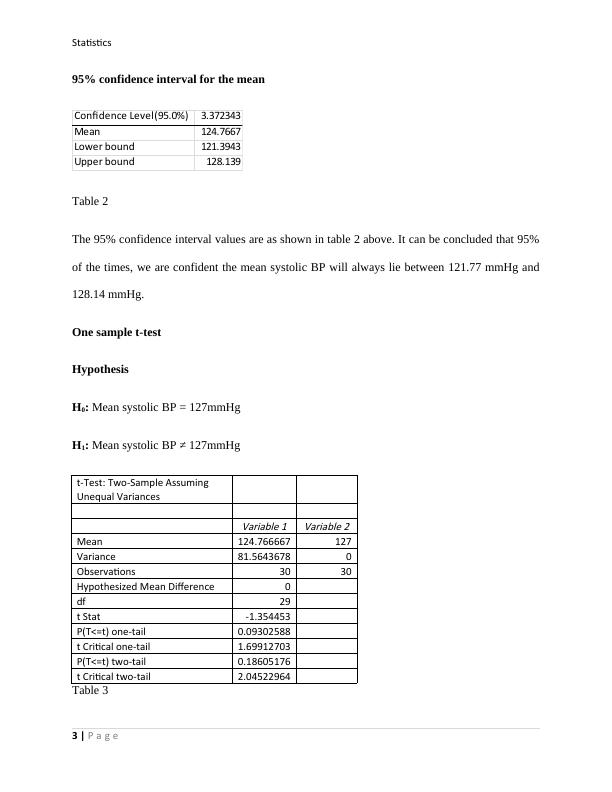
This document provides an analysis and results of a survey conducted to determine the risk of kidney disease based on systolic blood pressure. It includes descriptive statistics, confidence interval, one sample t-test, and comparison of mean and standard deviation for males and females.
Statistics: Analysis and Results
In this assignment, students are required to come up with research questions, collect numerical data from two different populations or treatments, and analyze the data to make comparisons between the means and proportions of the two groups.
Added on 2023-01-13
ShareRelated Documents
End of preview
Want to access all the pages? Upload your documents or become a member.
Statistical Analysis of Sex Differences and Obesity Levels
|4
|916
|177
Statistical Problems: One Sample t-test, Two Sample t-test, Two Sample Proportion z-test, One-way ANOVA
|8
|1638
|262
Statistics - Two Sample t-test with Known and Unequal Variances
|6
|687
|236
Statistics Assignment - Substantive Significance
|8
|740
|68
BSB123 Data Analysis Research Report
|7
|1649
|219
Study Material for Assessment
|12
|1561
|77