BUS105 Computing Assignment: Data Analysis and Financial Concepts
VerifiedAdded on 2020/03/23
|19
|1427
|56
Homework Assignment
AI Summary
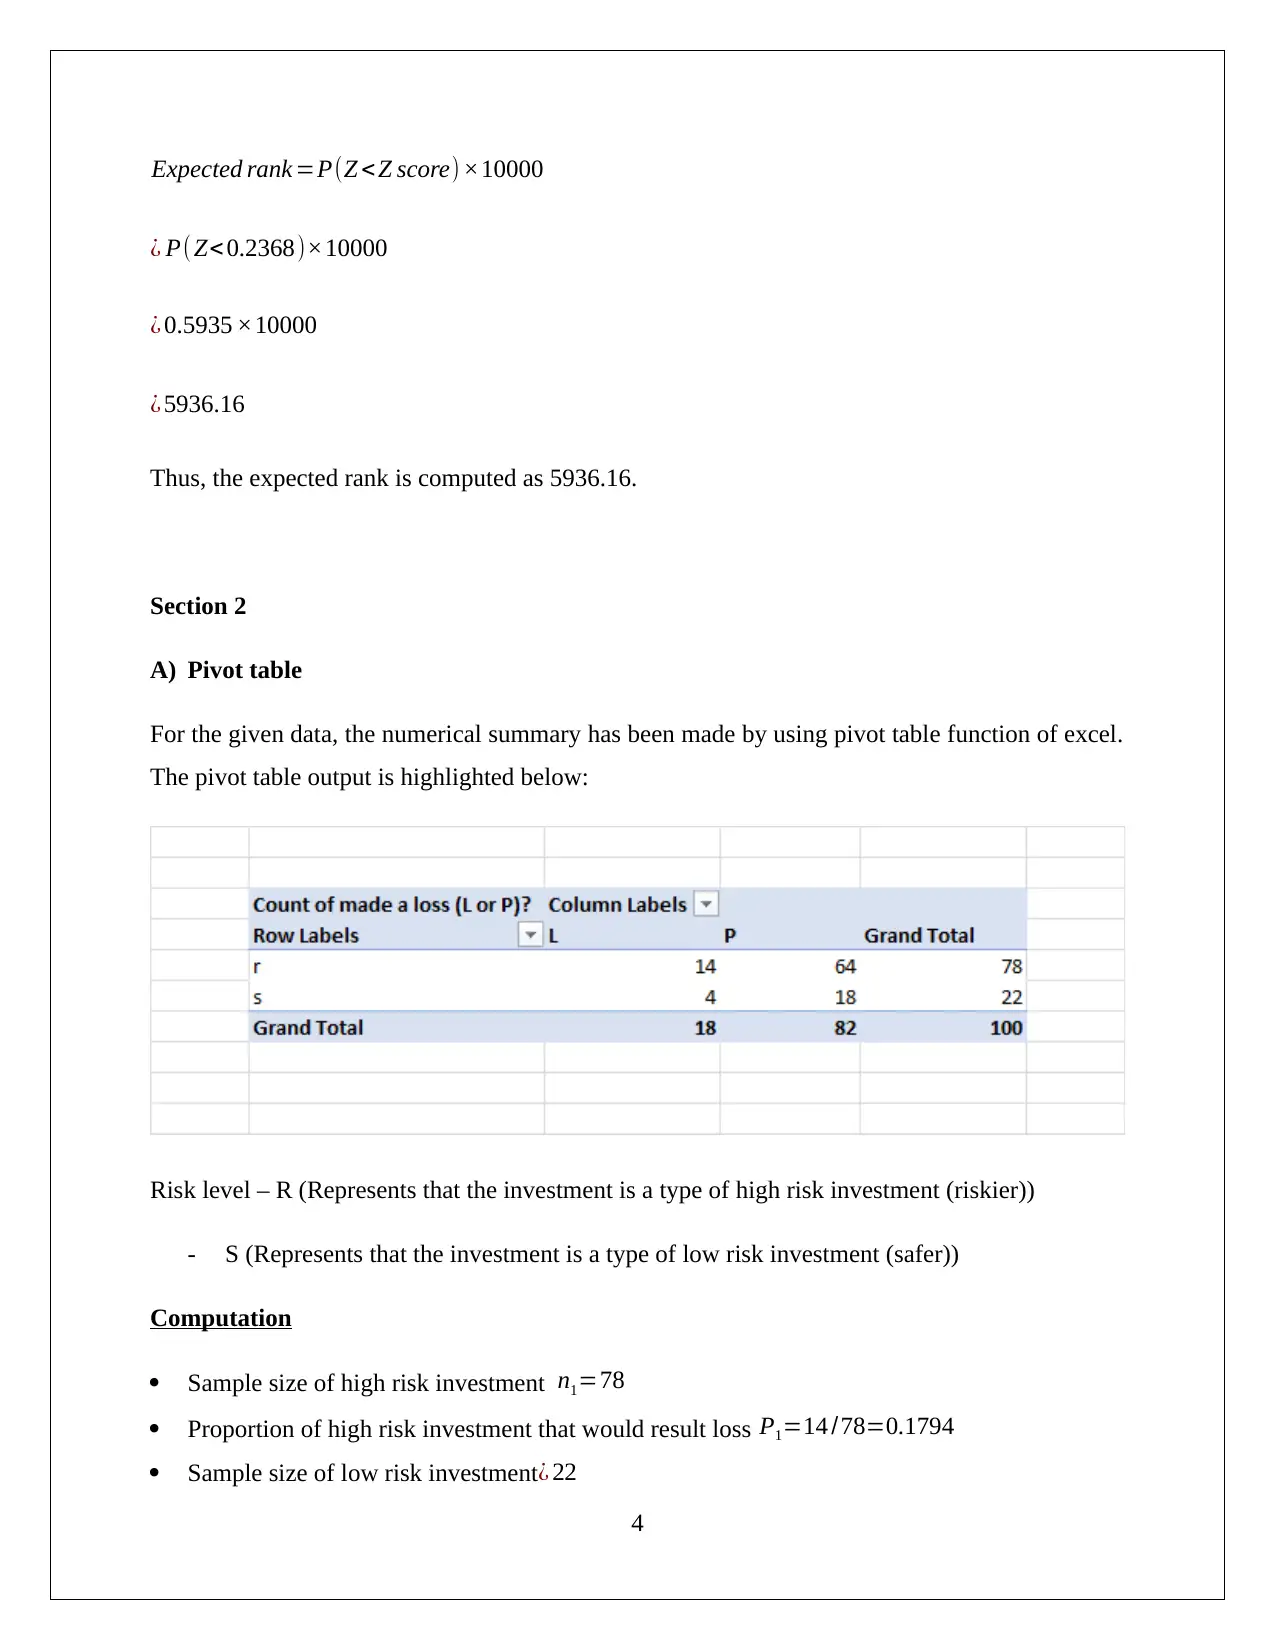
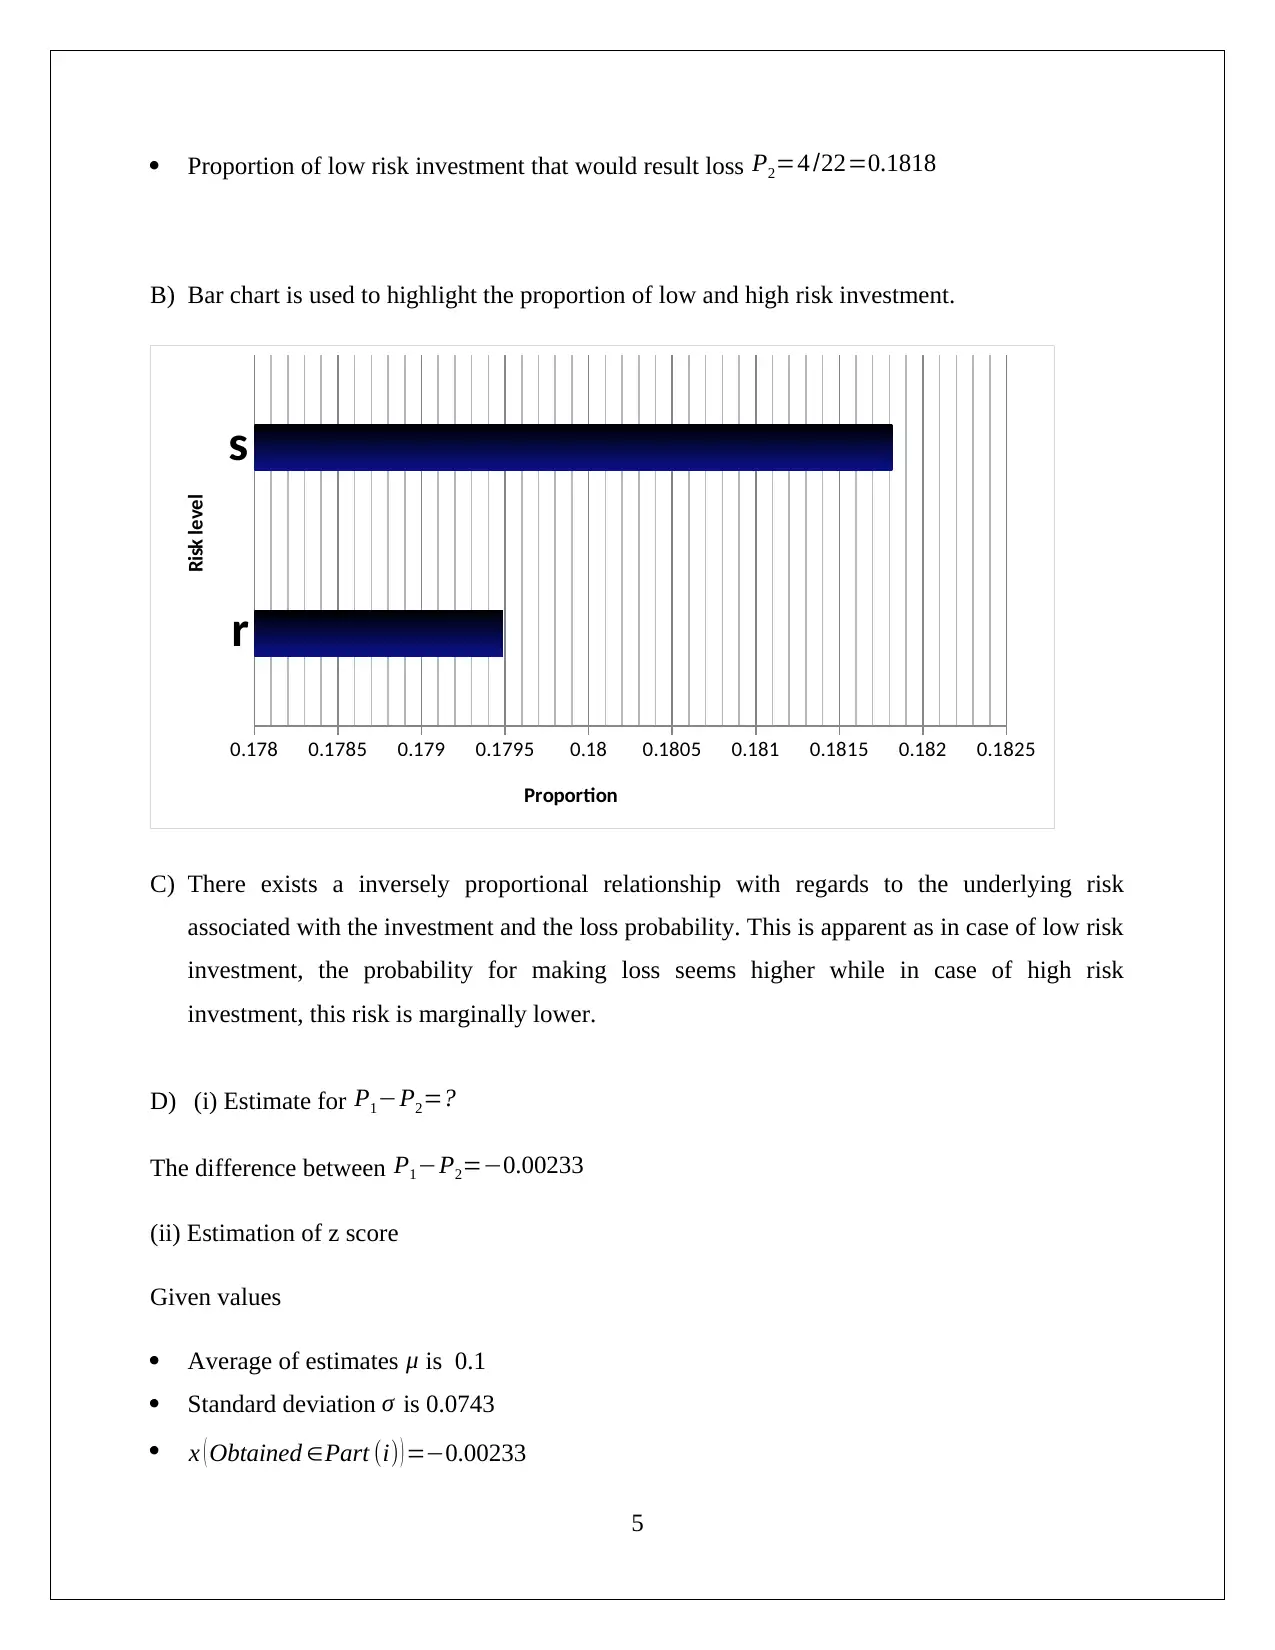
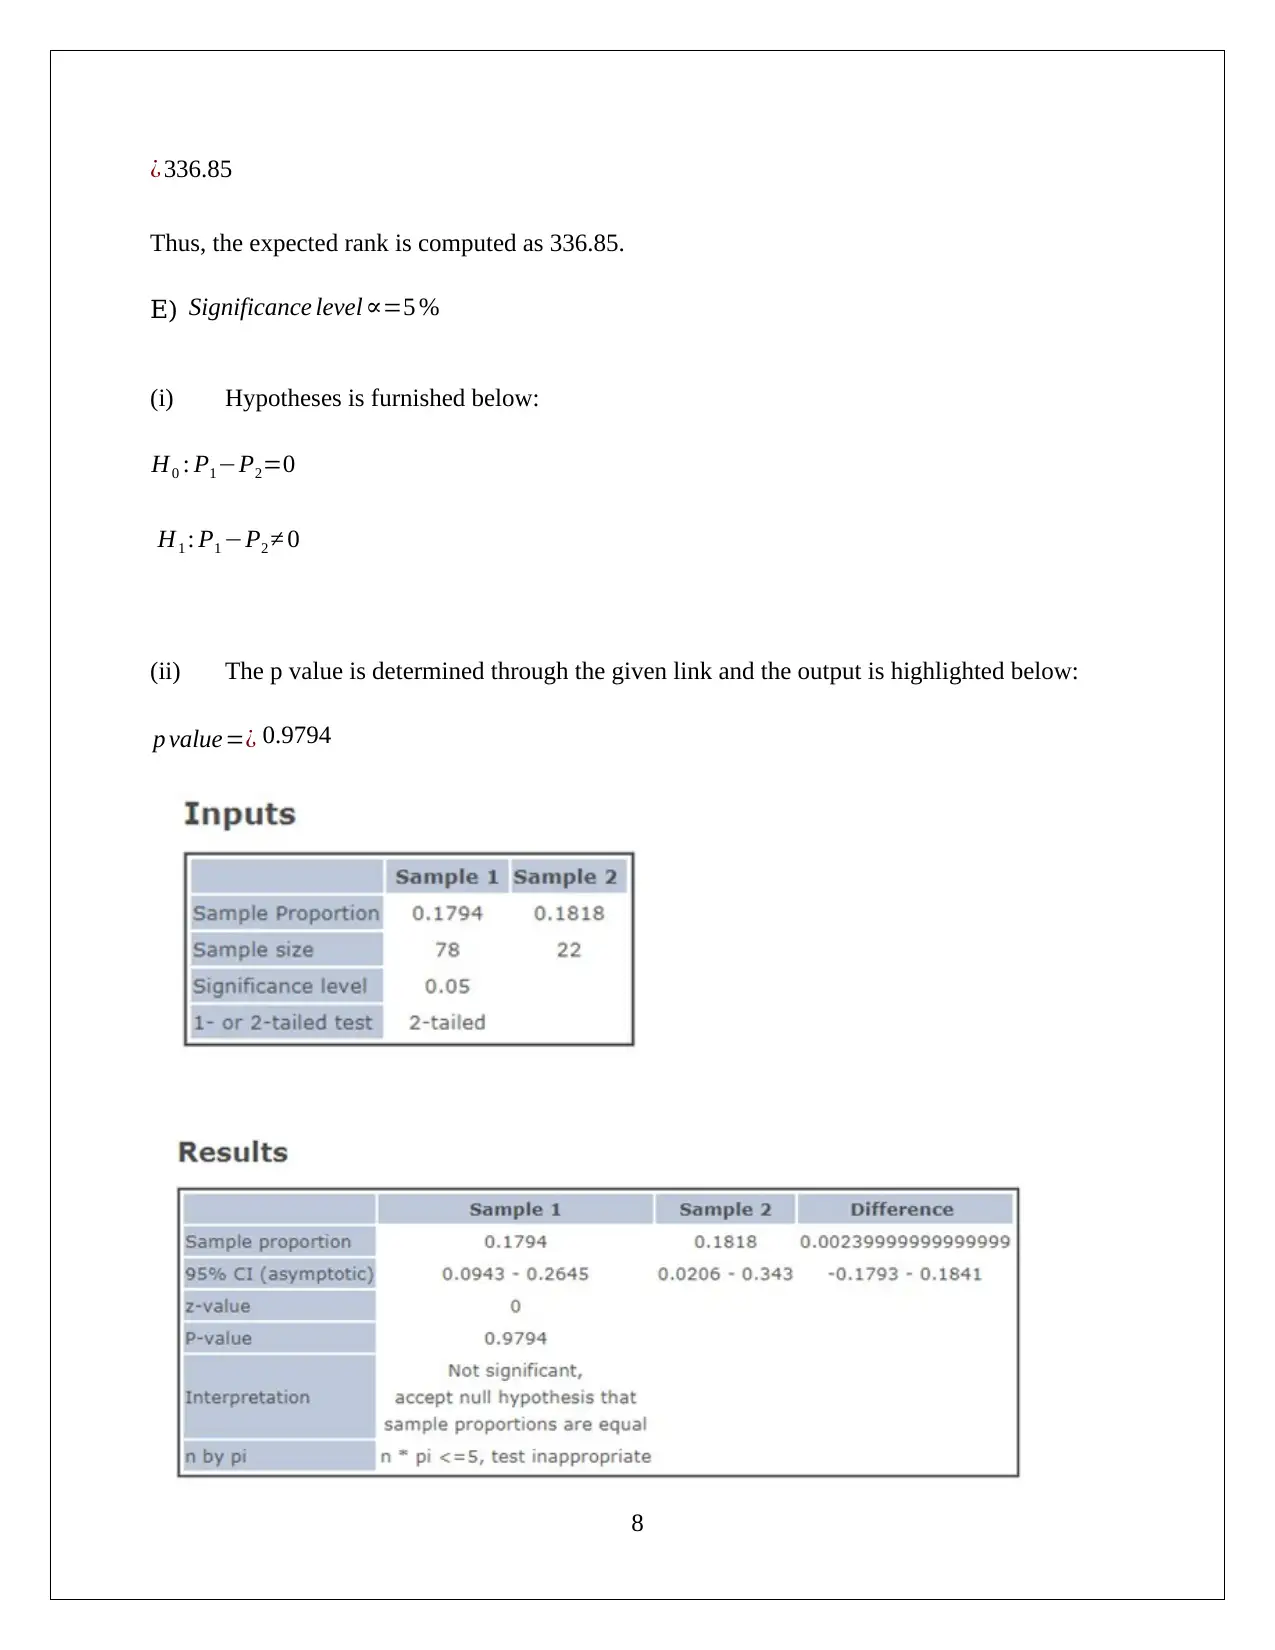
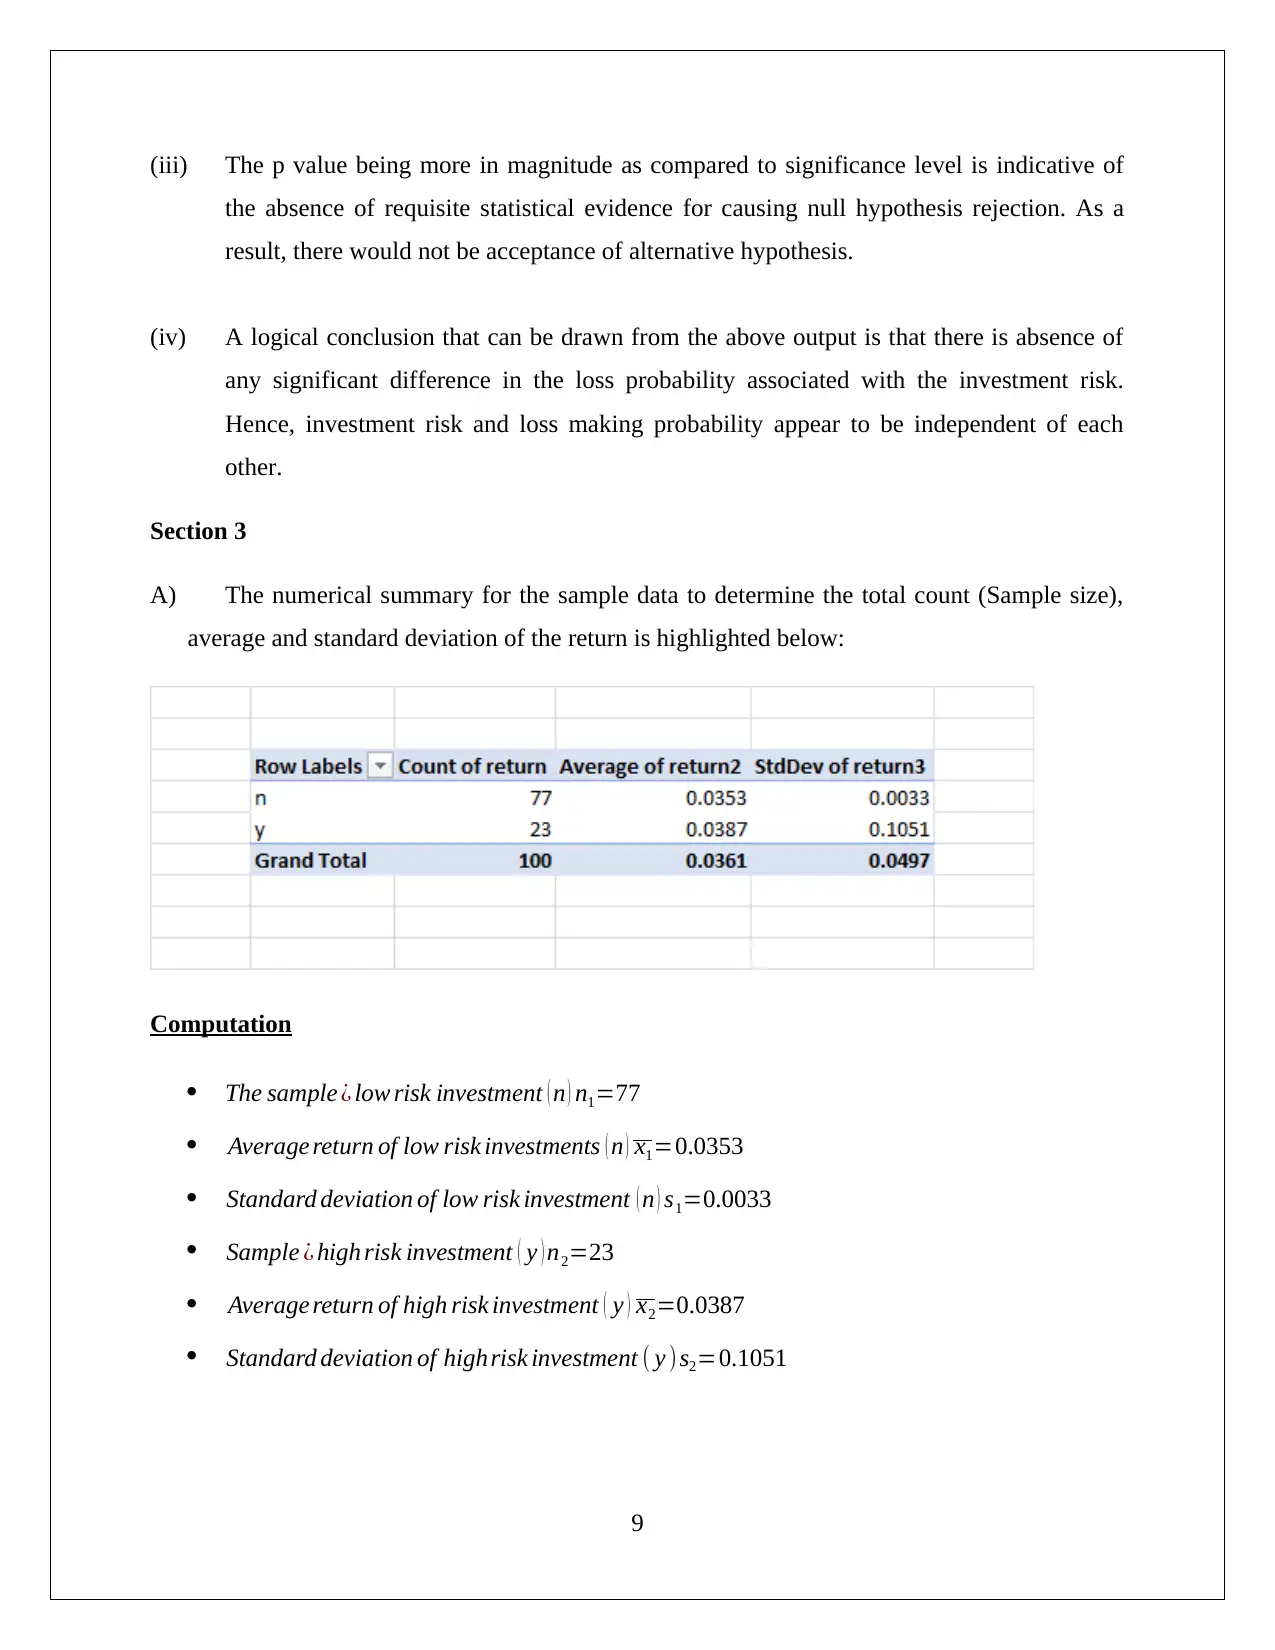
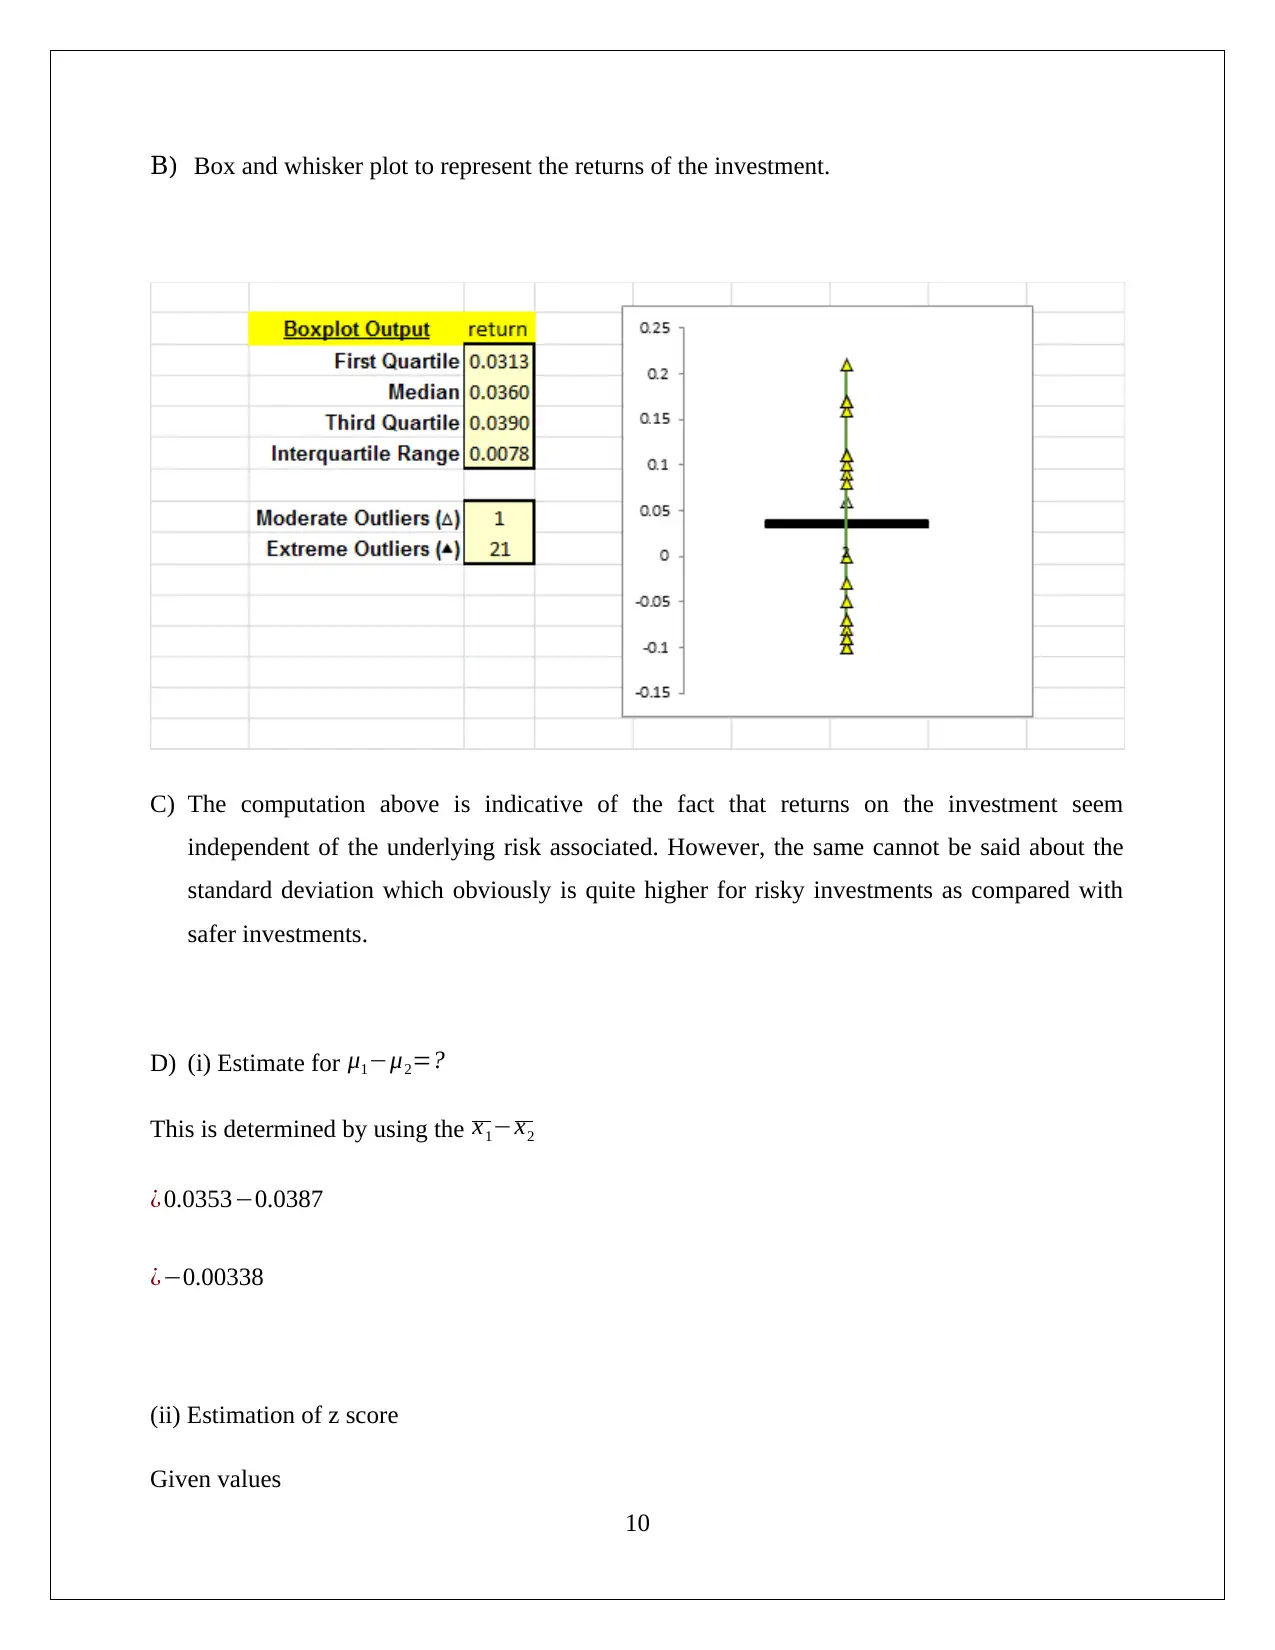
This computing assignment, submitted by Azaz Mahmood for BUS105, demonstrates data analysis and statistical techniques across several sections. Section 1 focuses on scatter plots and regression analysis, exploring the relationship between income and annual contribution. Section 2 uses pivot tables to summarize data on investment risk and loss probability, calculating z-scores and p-values to test hypotheses. Section 3 extends this analysis to investment returns. Section 4 investigates confidence intervals for proportions related to changes. Section 5 uses pivot tables to summarize the relationship between gender and average monthly spending. Finally, Section 6 discusses the application of mean and standard deviation in financial contexts, particularly in portfolio formation, emphasizing the importance of risk and return analysis for investment decisions. The assignment utilizes various statistical tools and concepts to analyze different datasets and draw meaningful conclusions.
1 out of 19
Related Documents


Your All-in-One AI-Powered Toolkit for Academic Success.
+13062052269
info@desklib.com
Available 24*7 on WhatsApp / Email
![[object Object]](/_next/static/media/star-bottom.7253800d.svg)
Copyright © 2020–2026 A2Z Services. All Rights Reserved. Developed and managed by ZUCOL.