logo

Statistics for Business and Finance - Analysing Household Data

11 Pages1105 Words101 Views
   

La Trobe University


Statistics for Business and Finance (BUS5SBF)


Added on  2020-03-01

About This Document

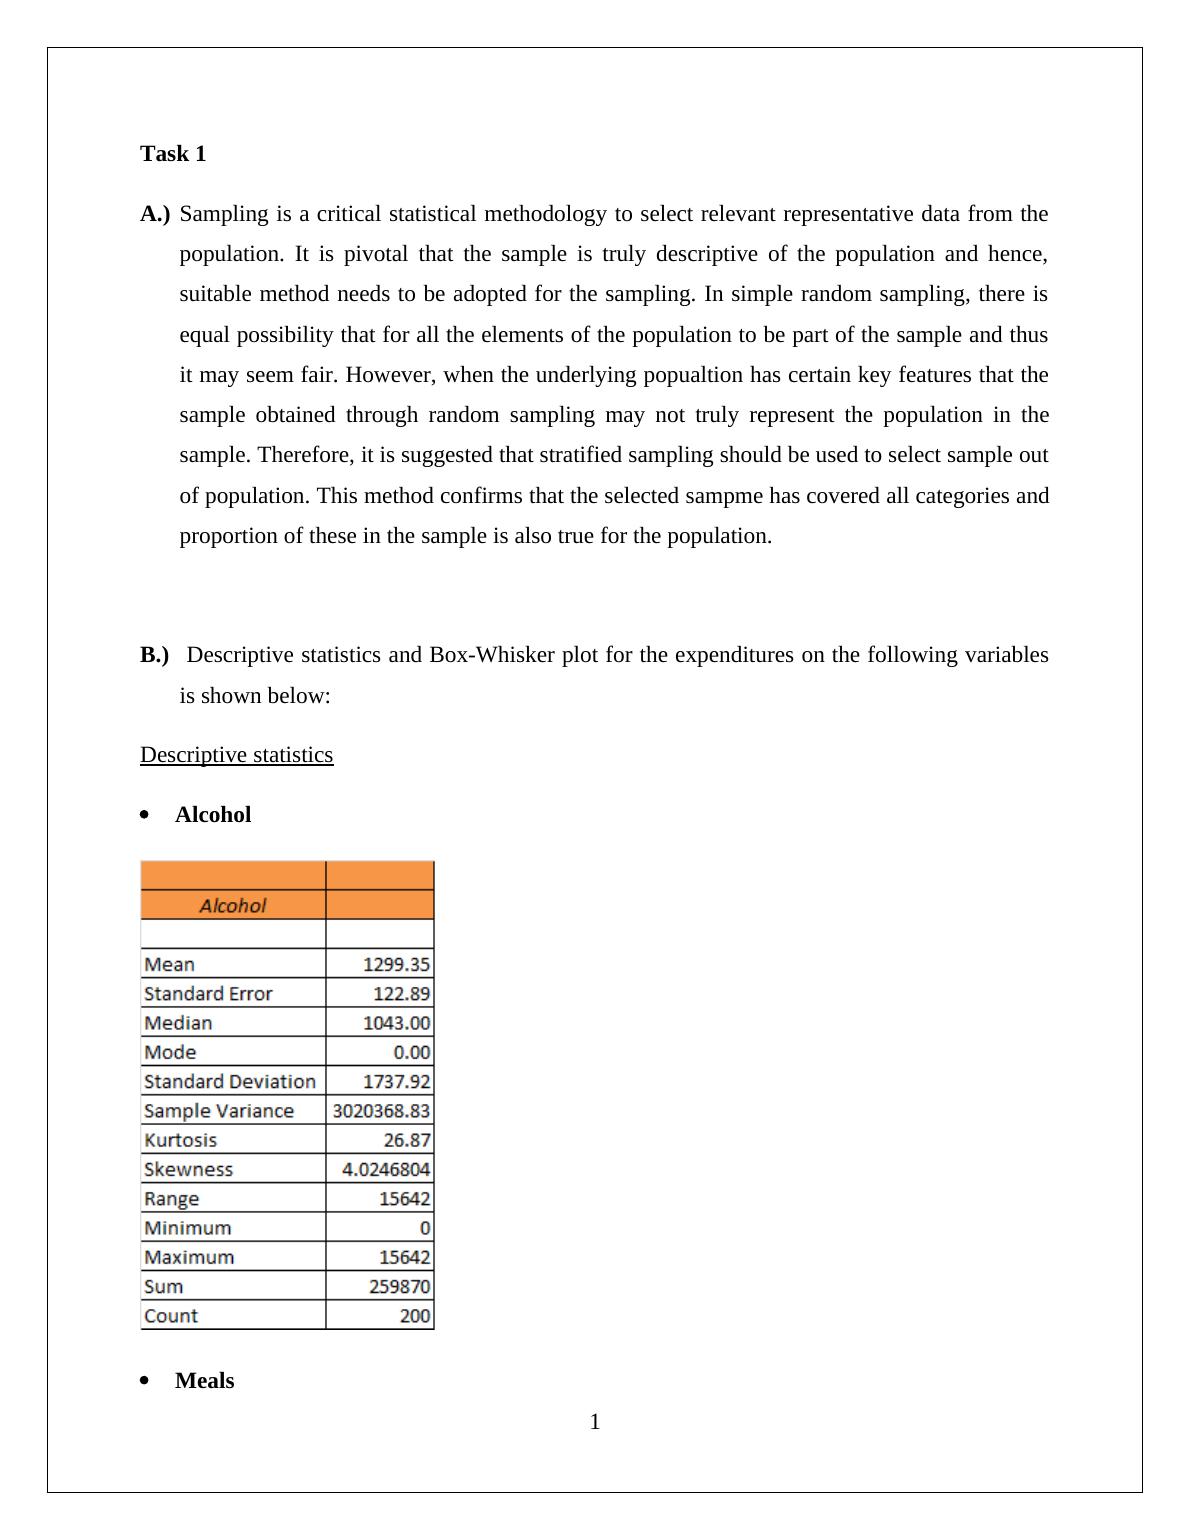
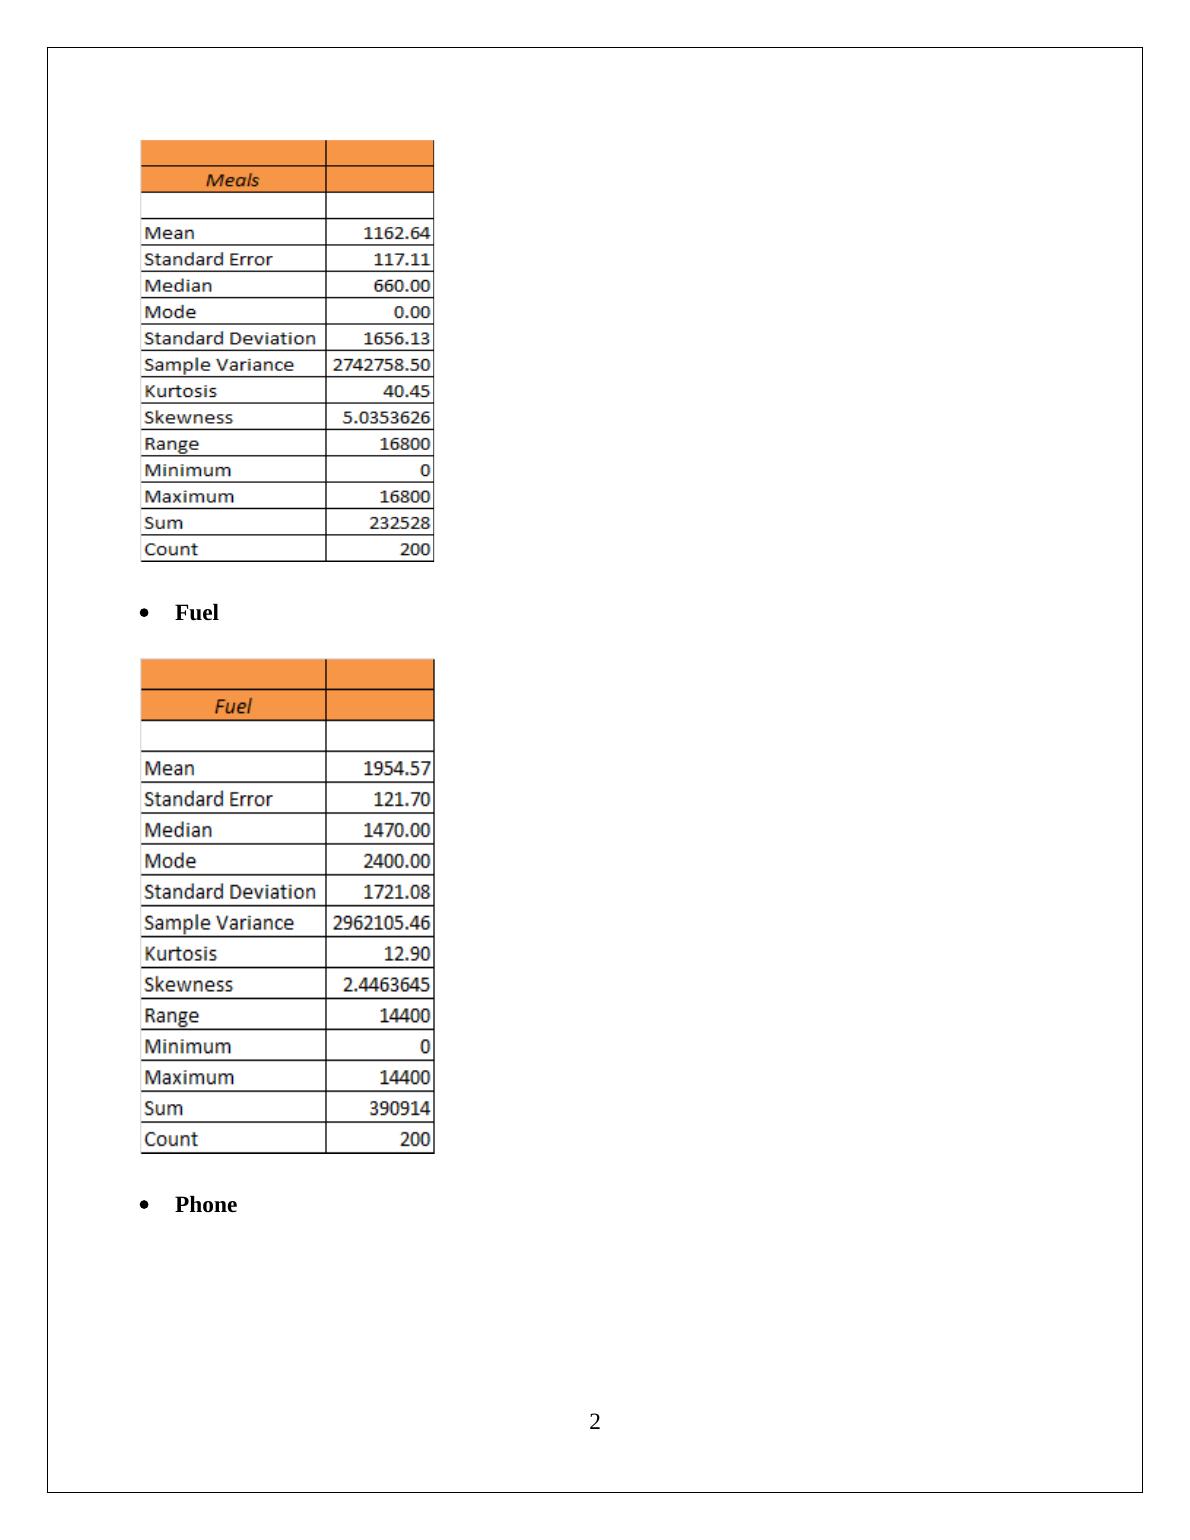
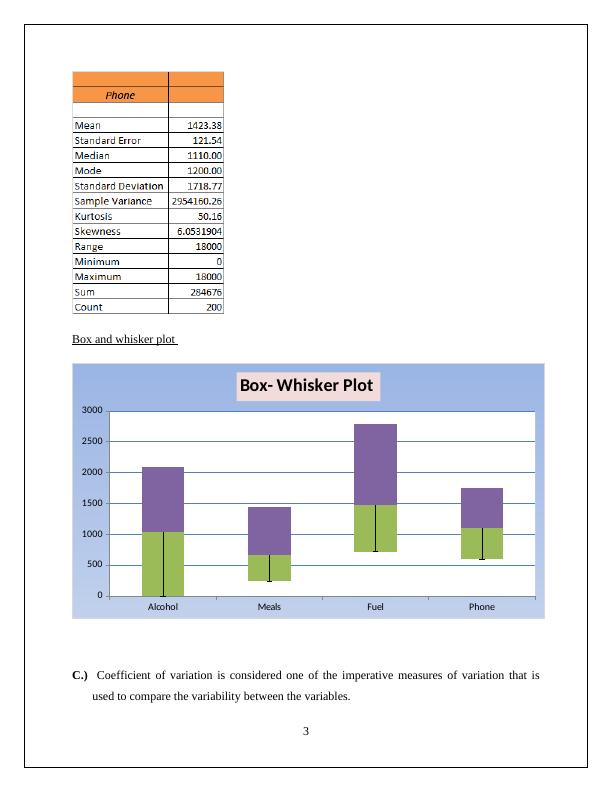
This assignment is based on Statistics for Business and Finance. We will analyse data and critical statistical methodology to select relevant representative data from the population. This assignment will discuss descriptive statistics and the Box-Whisker plot for the expenditures on the following variables such as alcohol, meals, fuel and phone. Will be discussed in this paper, what are the top 10% value and the bottom 10% value of household annual after-tax income?

Statistics for Business and Finance - Analysing Household Data


La Trobe University


Statistics for Business and Finance (BUS5SBF)

   Added on 2020-03-01

ShareRelated Documents
Statistics for Businessand FinanceAssignment 1: Analysing Household DataStudent id[Pick the date]
Statistics for Business and Finance - Analysing Household Data_1
Task 1 A.)Sampling is a critical statistical methodology to select relevant representative data from thepopulation. It is pivotal that the sample is truly descriptive of the population and hence,suitable method needs to be adopted for the sampling. In simple random sampling, there isequal possibility that for all the elements of the population to be part of the sample and thusit may seem fair. However, when the underlying popualtion has certain key features that thesample obtained through random sampling may not truly represent the population in thesample. Therefore, it is suggested that stratified sampling should be used to select sample outof population. This method confirms that the selected sampme has covered all categories andproportion of these in the sample is also true for the population. B.) Descriptive statistics and Box-Whisker plot for the expenditures on the following variablesis shown below:Descriptive statisticsAlcohol Meals 1
Statistics for Business and Finance - Analysing Household Data_2
FuelPhone 2
Statistics for Business and Finance - Analysing Household Data_3
Box and whisker plot AlcoholMealsFuelPhone050010001500200025003000Box- Whisker Plot C.) Coefficient of variation is considered one of the imperative measures of variation that isused to compare the variability between the variables.3
Statistics for Business and Finance - Analysing Household Data_4

End of preview

Want to access all the pages? Upload your documents or become a member.

Related Documents
BUS5SBF - Statistics for Business and Finance (Doc)
|9
|1028
|149

BUS5SBF - Statistics For Business and Finance, Question/Answer
|6
|1044
|204

Statistics for Business - Descriptive Statistics, Frequency Distribution, Probability Distribution, Contingency Table and Scatter Plot
|9
|1339
|404

Microsoft Excel Data Analysis
|7
|1051
|16

Analyzing Household Data for Statistics in Business and Finance
|11
|1451
|171

Analyzing Household Data for Statistics in Business and Finance
|12
|1615
|87