logo

BUS5SBF - Statistics For Business and Finance, Question/Answer

6 Pages1044 Words204 Views
   

La Trobe University


Statistics for Business and Finance (BUS5SBF)


Added on  2020-03-04

About This Document

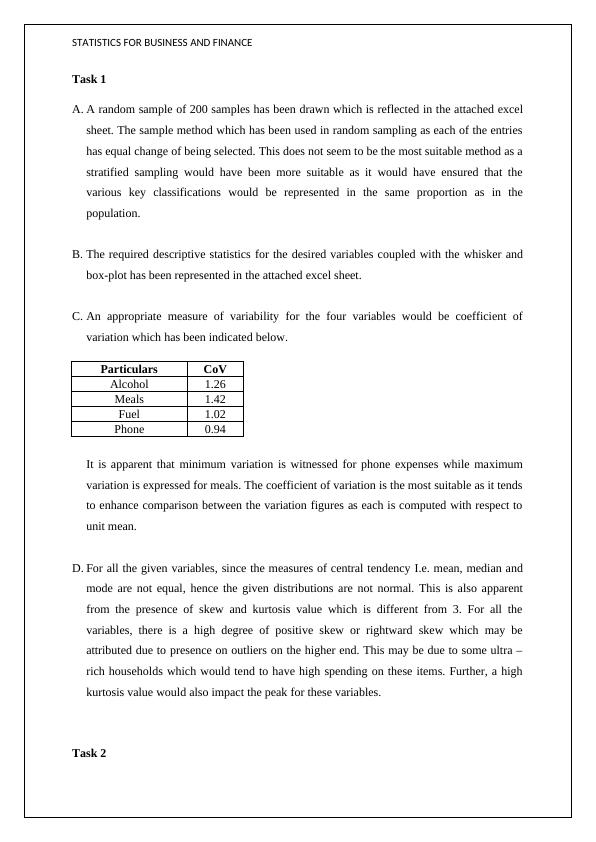
In the BUS5SBF Question/Answer, we will discuss Statistics For Business and Finance, we also cover Household Survey. The sample method which has been used in random sampling as each of the entries has equal change of being selected. This does not seem to be the most suitable method as a stratified sampling would have been more suitable as it would have ensured that the various key classifications would be represented in the same proportion as in the population.

BUS5SBF - Statistics For Business and Finance, Question/Answer


La Trobe University


Statistics for Business and Finance (BUS5SBF)

   Added on 2020-03-04

ShareRelated Documents
STATISTICS FORBUSINESS AND FINANCEHOUSEHOLD SURVEYSTUDENT ID:[Pick the date]
BUS5SBF - Statistics For Business and Finance, Question/Answer_1
STATISTICS FOR BUSINESS AND FINANCETask 1A.A random sample of 200 samples has been drawn which is reflected in the attached excelsheet. The sample method which has been used in random sampling as each of the entrieshas equal change of being selected. This does not seem to be the most suitable method as astratified sampling would have been more suitable as it would have ensured that thevarious key classifications would be represented in the same proportion as in thepopulation.B.The required descriptive statistics for the desired variables coupled with the whisker andbox-plot has been represented in the attached excel sheet.C.An appropriate measure of variability for the four variables would be coefficient ofvariation which has been indicated below.ParticularsCoVAlcohol1.26Meals1.42Fuel1.02Phone0.94It is apparent that minimum variation is witnessed for phone expenses while maximumvariation is expressed for meals. The coefficient of variation is the most suitable as it tendsto enhance comparison between the variation figures as each is computed with respect tounit mean.D.For all the given variables, since the measures of central tendency I.e. mean, median andmode are not equal, hence the given distributions are not normal. This is also apparentfrom the presence of skew and kurtosis value which is different from 3. For all thevariables, there is a high degree of positive skew or rightward skew which may beattributed due to presence on outliers on the higher end. This may be due to some ultra –rich households which would tend to have high spending on these items. Further, a highkurtosis value would also impact the peak for these variables.Task 2
BUS5SBF - Statistics For Business and Finance, Question/Answer_2
STATISTICS FOR BUSINESS AND FINANCEA.The requisite frequency distribution with regards to utilities expenditure has been drawnusing Excel and the result is as indicated below.Frequency Distribution Class Frequency 0 - 40019400 - 80045800 -1200591200 -1600331600 -2000222000 -240062400-280072800-32003More than 32006Total200B.Based on the above frequency distribution table, the requisite percentage of householdscan be computed.1)Favourable cases = 19+45+59 = 134Requisite probability = 123/200 = 0.615 or 61.5% of the households2)Favourable cases = 33+22+6= 61Requisite probability = 61/200 = 0.305 or 30.5% of the households3)Favourable cases = 7+3+6= 16Requisite probability = 16/200 = 0.08 or 8% of the householdsC.The requisite histogram with regards to utilities expenditure has been drawn using Exceland is as indicated below.
BUS5SBF - Statistics For Business and Finance, Question/Answer_3

End of preview

Want to access all the pages? Upload your documents or become a member.

Related Documents
BUS5SBF - Statistics for Business and Finance (Doc)
|9
|1028
|149

StAT2000-Quantitative Analysis of a sample of 400 US students working in US
|9
|1546
|219

Statistics for Business and Finance - Analysing Household Data
|11
|1105
|101

Financial Statistics
|10
|1354
|65

Simple Random Sampling Method - Statistics Assignment
|13
|1682
|124

Sampling Technique and Data Analysis
|9
|1346
|69