Business Decision Making in Amistar
22 Pages3922 Words27 Views
Added on 2020-02-03
Business Decision Making in Amistar
Added on 2020-02-03
ShareRelated Documents
BUSINESS DECISION MAKING

TABLE OF CONTENTS
INTRODUCTION......................................................................................................... 3
TASK 1...................................................................................................................... 3
1.1 Collection of primary and secondary data.....................................................................3
1.2 Sampling methods and survey methodology.................................................................4
1.3 Questionnaire for study........................................................................................... 5
TASK 2...................................................................................................................... 6
2.1 Computation of mean median and mode......................................................................6
2.2 Analysis of results................................................................................................. 7
2.3 Measures of dispersion........................................................................................... 8
2.4 Quartile, percentile and correlation coefficient..............................................................8
TASK 3.................................................................................................................... 10
3.1 Produce graphs and draw conclusions.......................................................................10
3.2 Trend analysis chart............................................................................................. 12
3.3 Covered in PPT................................................................................................... 13
3.4 Formal business report.......................................................................................... 13
TASK 4.................................................................................................................... 14
4.1 Information processing tools................................................................................... 14
4.2 Network diagram................................................................................................. 15
4.3 Project evaluation................................................................................................ 16
CONCLUSION.......................................................................................................... 17
REFERENCES........................................................................................................... 19
Figure 1 Calculation of mean............................................................................................ 7
Figure 2 Calculation of median......................................................................................... 7
Figure 3 Calculation of mode........................................................................................... 8
Figure 4 Formula of Skewness.......................................................................................... 9
Figure 5Calculation of standard deviation..........................................................................10
Figure 6 Charting on firm sales....................................................................................... 12
Figure 7 Charting on cost.............................................................................................. 12
Figure 8 Charting on profit............................................................................................ 13
Figure 9 Sales trend analysis chart................................................................................... 14
Figure 10 Trend analysis chart of profit.............................................................................14
Figure 11 GANTT chart................................................................................................ 17
Figure 12Network diagram............................................................................................ 17
Figure 13 Payback period method.................................................................................... 18
Figure 14 Average rate of return...................................................................................... 18
Figure 15 Net present value............................................................................................ 19
Figure 16 Internal rate of return....................................................................................... 19
Table 5 Calculation of quartile and percentile.....................................................................10

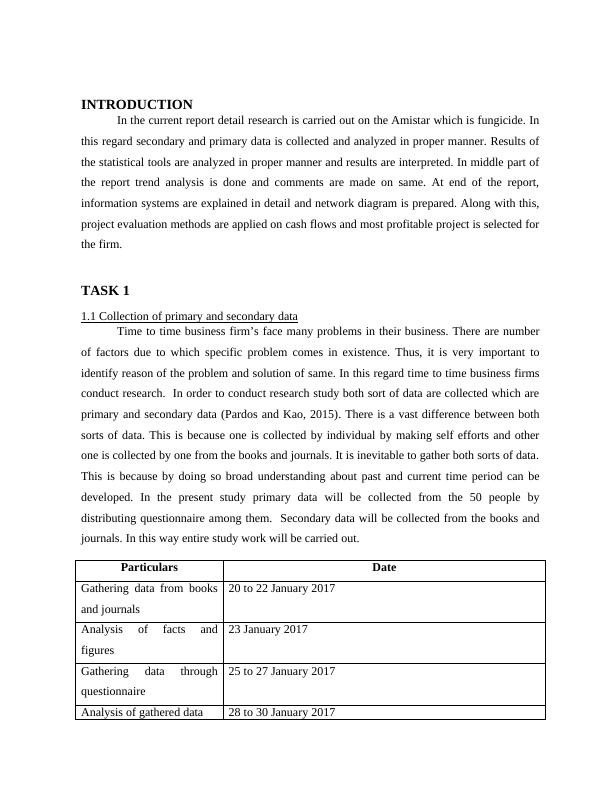
INTRODUCTION
In the current report detail research is carried out on the Amistar which is fungicide. In
this regard secondary and primary data is collected and analyzed in proper manner. Results of
the statistical tools are analyzed in proper manner and results are interpreted. In middle part of
the report trend analysis is done and comments are made on same. At end of the report,
information systems are explained in detail and network diagram is prepared. Along with this,
project evaluation methods are applied on cash flows and most profitable project is selected for
the firm.
TASK 1
1.1 Collection of primary and secondary data
Time to time business firm’s face many problems in their business. There are number
of factors due to which specific problem comes in existence. Thus, it is very important to
identify reason of the problem and solution of same. In this regard time to time business firms
conduct research. In order to conduct research study both sort of data are collected which are
primary and secondary data (Pardos and Kao, 2015). There is a vast difference between both
sorts of data. This is because one is collected by individual by making self efforts and other
one is collected by one from the books and journals. It is inevitable to gather both sorts of data.
This is because by doing so broad understanding about past and current time period can be
developed. In the present study primary data will be collected from the 50 people by
distributing questionnaire among them. Secondary data will be collected from the books and
journals. In this way entire study work will be carried out.
Particulars Date
Gathering data from books
and journals
20 to 22 January 2017
Analysis of facts and
figures
23 January 2017
Gathering data through
questionnaire
25 to 27 January 2017
Analysis of gathered data 28 to 30 January 2017
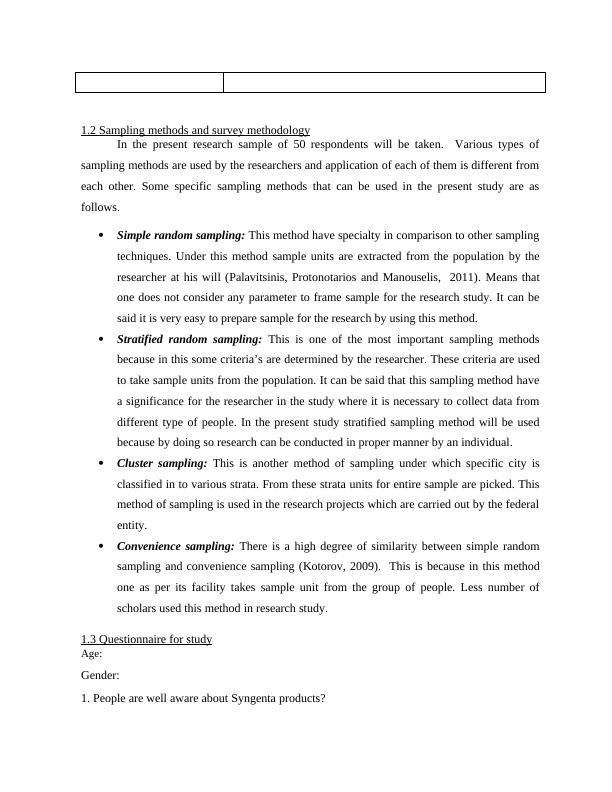
1.2 Sampling methods and survey methodology
In the present research sample of 50 respondents will be taken. Various types of
sampling methods are used by the researchers and application of each of them is different from
each other. Some specific sampling methods that can be used in the present study are as
follows.
Simple random sampling: This method have specialty in comparison to other sampling
techniques. Under this method sample units are extracted from the population by the
researcher at his will (Palavitsinis, Protonotarios and Manouselis, 2011). Means that
one does not consider any parameter to frame sample for the research study. It can be
said it is very easy to prepare sample for the research by using this method.
Stratified random sampling: This is one of the most important sampling methods
because in this some criteria’s are determined by the researcher. These criteria are used
to take sample units from the population. It can be said that this sampling method have
a significance for the researcher in the study where it is necessary to collect data from
different type of people. In the present study stratified sampling method will be used
because by doing so research can be conducted in proper manner by an individual.
Cluster sampling: This is another method of sampling under which specific city is
classified in to various strata. From these strata units for entire sample are picked. This
method of sampling is used in the research projects which are carried out by the federal
entity.
Convenience sampling: There is a high degree of similarity between simple random
sampling and convenience sampling (Kotorov, 2009). This is because in this method
one as per its facility takes sample unit from the group of people. Less number of
scholars used this method in research study.
1.3 Questionnaire for study
Age:
Gender:
1. People are well aware about Syngenta products?
In the present research sample of 50 respondents will be taken. Various types of
sampling methods are used by the researchers and application of each of them is different from
each other. Some specific sampling methods that can be used in the present study are as
follows.
Simple random sampling: This method have specialty in comparison to other sampling
techniques. Under this method sample units are extracted from the population by the
researcher at his will (Palavitsinis, Protonotarios and Manouselis, 2011). Means that
one does not consider any parameter to frame sample for the research study. It can be
said it is very easy to prepare sample for the research by using this method.
Stratified random sampling: This is one of the most important sampling methods
because in this some criteria’s are determined by the researcher. These criteria are used
to take sample units from the population. It can be said that this sampling method have
a significance for the researcher in the study where it is necessary to collect data from
different type of people. In the present study stratified sampling method will be used
because by doing so research can be conducted in proper manner by an individual.
Cluster sampling: This is another method of sampling under which specific city is
classified in to various strata. From these strata units for entire sample are picked. This
method of sampling is used in the research projects which are carried out by the federal
entity.
Convenience sampling: There is a high degree of similarity between simple random
sampling and convenience sampling (Kotorov, 2009). This is because in this method
one as per its facility takes sample unit from the group of people. Less number of
scholars used this method in research study.
1.3 Questionnaire for study
Age:
Gender:
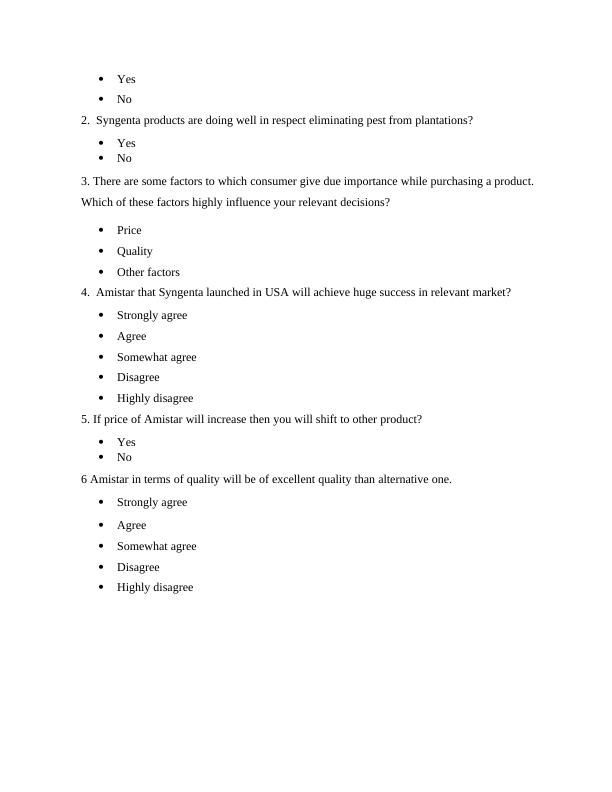
1. People are well aware about Syngenta products?
Yes
No
2. Syngenta products are doing well in respect eliminating pest from plantations?
Yes
No
3. There are some factors to which consumer give due importance while purchasing a product.
Which of these factors highly influence your relevant decisions?
Price
Quality
Other factors
4. Amistar that Syngenta launched in USA will achieve huge success in relevant market?
Strongly agree
Agree
Somewhat agree
Disagree
Highly disagree
5. If price of Amistar will increase then you will shift to other product?
Yes
No
6 Amistar in terms of quality will be of excellent quality than alternative one.
Strongly agree
Agree
Somewhat agree
Disagree
Highly disagree
No
2. Syngenta products are doing well in respect eliminating pest from plantations?
Yes
No
3. There are some factors to which consumer give due importance while purchasing a product.
Which of these factors highly influence your relevant decisions?
Price
Quality
Other factors
4. Amistar that Syngenta launched in USA will achieve huge success in relevant market?
Strongly agree
Agree
Somewhat agree
Disagree
Highly disagree
5. If price of Amistar will increase then you will shift to other product?
Yes
No
6 Amistar in terms of quality will be of excellent quality than alternative one.
Strongly agree
Agree
Somewhat agree
Disagree
Highly disagree
End of preview
Want to access all the pages? Upload your documents or become a member.
Related Documents
Business decision making table of contents introduction 3 TASK 13lg...
|22
|4215
|491
Statistical Tools Report - Morrisonlg...
|24
|4790
|51
Business decision making table of contents introduction 4 TASK 14lg...
|19
|3736
|361
Unit 6 Business Decision Making Tools : Assignmentlg...
|20
|4335
|88
Business Decision Making Techniques : PDFlg...
|22
|4620
|28
Research Report on Analyzing Datalg...
|29
|4077
|41