Business Organization Analysis
VerifiedAdded on 2023/04/06
|83
|13746
|326
AI Summary
This document provides a detailed analysis of the balance sheet, P&L account, cash flow, and ratio analysis of Sony Corporation. It includes information on the company's history, subsidiaries, board of directors, auditors, and registered office address. The document also highlights the company's strengths, weaknesses, and strategic alliances.
Contribute Materials
Your contribution can guide someone’s learning journey. Share your
documents today.
Running head: BUSINESS ORGANIZATION ANALYSIS
Business organization analysis
Name of the Student
Name of the University
Author Note
Business organization analysis
Name of the Student
Name of the University
Author Note
Secure Best Marks with AI Grader
Need help grading? Try our AI Grader for instant feedback on your assignments.
1
BUSINESS ORGANIZATION ANALYSIS
Table of Contents
1. INTRODUCTION..................................................................................................................6
1.1 Introduction of Company.................................................................................................6
1.2 Group Companies.............................................................................................................7
1.3 History..............................................................................................................................7
1.4 Company Profile..............................................................................................................8
1.5 Registered Office Address...............................................................................................9
1.6 Board of Directors of the Company.................................................................................9
1.7 Auditors of the Company...............................................................................................11
2. Analysis of balance sheet.....................................................................................................12
2.1 Trend analysis of balance sheet:........................................................................................12
2.1.1 Trend analysis of fixed assets.....................................................................................14
2.1.2 Trend analysis of current assets..................................................................................15
2.1.3 Trend analysis of total liabilities.................................................................................16
2.1.4 Trend analysis of shareholders’ equity.......................................................................17
2.1.5 Trend analysis of total loan fund.................................................................................18
2.1.6 Trend analysis of shareholder fund.............................................................................19
2.1.7 Trend analysis of sources of fund...............................................................................20
2.1.8 Trend analysis of investment......................................................................................22
2.1.9 Trend analysis of funds application............................................................................23
2.2 Horizontal analysis of balance sheet:.................................................................................25
2.2.1 Fund’s sources 2018....................................................................................................26
2
BUSINESS ORGANIZATION ANALYSIS
2.2.3 Fund’s sources for five years......................................................................................28
2.2.4 Fund’s application for five years.................................................................................29
3. Analyzing the P& L account................................................................................................30
3.1 Trend analysis of P & L.....................................................................................................30
3.1.1 Trend analysis of total income with expenditure:.......................................................31
3.1.2 Profit after tax.............................................................................................................32
3.1.3 Transfer to reserve:.....................................................................................................33
3.1.4 Trend analysis of sales................................................................................................34
3.2 Horizontal analysis of P & L..............................................................................................36
3.2.1 Comparison of income with expenditure with profit before tax.................................36
4. Cash flow analysis................................................................................................................37
4.1 Introduction........................................................................................................................37
4.2 Analyzing the cash flow statement....................................................................................38
4.3 Interpretation of cash flow statement.................................................................................39
5. Ratio analysis.......................................................................................................................40
5.2 Liquidity ratio.....................................................................................................................40
5.2.1 Current ratio....................................................................................................................40
5.2.2 Quick ratio...................................................................................................................41
5.2.3 Net working capital.........................................................................................................43
5.3 Profitability ratio................................................................................................................44
5.3.1 Gross profit..................................................................................................................44
3
BUSINESS ORGANIZATION ANALYSIS
5.3.2 Operating ratio............................................................................................................45
5.3.4 Net profit ratio.............................................................................................................47
5.3.5 Return on investment..................................................................................................48
5.3.5 Return on equity..........................................................................................................49
5.4 Efficiency ratio...................................................................................................................51
5.4.1 Total asset turnover ratio.............................................................................................51
5.4.2 Net fixed asset turnover ratio......................................................................................52
5.4.3 Inventories turnover ratio............................................................................................54
5.4.4 Average age of inventories..........................................................................................55
5.4.5 Debtor turnover ratio...................................................................................................57
5.5 Finance structure ratio........................................................................................................58
5.5.1 Debt ratio.....................................................................................................................58
5.5.2 Debt equity ratio..........................................................................................................60
5.5.3 Interest coverage ratio.................................................................................................62
5.6 Valuation ratio....................................................................................................................63
5.6.1 Earning per share.........................................................................................................63
5.6.2 Dividend payout ratio..................................................................................................65
5.6.3 P/E ratio.......................................................................................................................66
5.6.4 Profit margin ratio.......................................................................................................67
5.7 Duo Point analysis:............................................................................................................69
6. Scenario analysis..................................................................................................................71
Secure Best Marks with AI Grader
Need help grading? Try our AI Grader for instant feedback on your assignments.
4
BUSINESS ORGANIZATION ANALYSIS
6.1 Company analysis..............................................................................................................71
6.2 Shareholding pattern..........................................................................................................72
Findings and Conclusion:.........................................................................................................73
Reference and Bibliography:....................................................................................................75
5
BUSINESS ORGANIZATION ANALYSIS
1. INTRODUCTION
1.1 Introduction of Company
Sony Corporation is a well-known Japanese multinational company, which was
initiated in the May 1946 in Japan. The company is headquartered in Sony City, Minato, and
Tokyo (Motoyama, 2016). The company predominantly focuses on the manufacturing,
production, development of design, sale and offer of different types of electronic instruments,
equipment and devices for potential customers. The company also provides services to the
international markets, industrial markets as well as to the professionals working on software,
game hardware, network services, cameras, semiconductors and mobile phones. The
company is also engaged in the manufacture, distribution and production of recorded music
the licensing and the management of the music and words of the songs. The company deals
with the distribution and production of animation titles which game applications, motion
pictures and deals with television and digital network operations. With all these innovation
and entertainment factors, Sony is considered to be as the most inclusive global entertainment
company. The company delivers high-level business value to the potential customers through
a deliberate mixture of quality, innovation and service.
6
BUSINESS ORGANIZATION ANALYSIS
1.2 Group Companies
Sony owns a list of renowned companies which includes Aniplex Inc. as the first
Sony subsidiaries which is a music and anime producing company. Aniplex is well-known
for its planning, distribution and production of many anime series. The other subsidiaries of
Sony are:
Sony Interactive Entertainment Inc.
Sony Global Solution Inc.
Sony Bank Inc.
Sony Energy Devices Corporation
Sony Global Manufacturing and Operation Corporation
Sony LSI Design Inc.
Sony Life Insurance Co., Ltd
Apart from these companies, there are other companies which deals with the IT
and gaming companies. The major holdings and affiliations of Sony are located
worldwide that is predominantly in Japan, Canada, United States, Latin America,
Europe, Hong-Kong and China, South Korea, India, Oceania and Southeast Asia and
Middle East.
1.3 History
The company Sony was established in the year 1946 in May in Japan which was
named as “Tokyo Tsushin Kogyo Kabushiki Kaisha” which was a joint stock exchange
company. It was in 1958 when the name was changed to “Sony Kabushiki Kaisha” in
English it is “Sony Corporation”. In 1988 January, the joint stock exchange company
transformed into wholly-owned branch of Sony Corporation and the name was changed in
1991 April to Sony Music Entertainment (Hong, 2018). The company was ranked on the
Paraphrase This Document
Need a fresh take? Get an instant paraphrase of this document with our AI Paraphraser
7
BUSINESS ORGANIZATION ANALYSIS
“New York Stock Exchange” (Davlin, 2016). In 2017 April the battery business of Sony
was transferred to “Murata Manufacturing Co.” Ltd Group. Over the past years the
company has emerged with many other subsidiaries with increasing productivity (Oki,
2016).
1.4 Company Profile
The Sony Corporation is the leading company for electronic, IT, gaming, video and
communication. It has been working to enlarge its market by restructuring its corporate base
and taking initiatives in product development. The company accounts varieties of other
consumer electronic products, VCRs and TVs. Sony has also incorporated itself with
financial service enterprises such as insurance operations, banking operations, credit and
leasing finance operations. The conjugate operation dealt with these companies includes
advertising agency business, entertainment with location-based business and predominantly
the internet- related business. The key strategy of the company is to focus on CSR
abbreviated as “Corporate Social Responsibility” (Clevenger &MacGregor, 2019). The
company has encouraged itself with many activities which includes “Climate Saver
Programmes”. Sony has achieved many awards for sustainable energy held in Europe by the
European Commission as Sony enrols itself improving the energy efficient products as well
as for being transparent with the consumers about its products (Bartoli et al., 2019).
The key strength of Sony is it holds the rank of largest entertainment company all
over the world-operating world widely with the varieties of products. It is well-known brand,
which holds good customer loyalty and has the advantage of customer retention (Garga et al.,
2019). Considering the weakness of the company, it lacks good quality of mobile phones,
which shows low performance in the market. The major strategic alliances of the company
are Viacom, Monex Beans holdings and Sony financial holdings. The significant mergers
include Toshiba, Sandisk and Kodak.
8
BUSINESS ORGANIZATION ANALYSIS
1.5 Registered Office Address
Company name -Sony Corporation
Founded May 7, 1946
Headquarters 1-7-1 Konan Minato-ku, Tokyo, 108-0075 Japan
TEL 81-3-6748-2111, Access from Konan Exit of Shinanagava Station.
1.6 Board of Directors of the Company
The advisors and Board of members of Sony are:
Kazuo Hirai – Chairman
Kenichiro Yoshida – CEO, President, Representative Corporate Executive officer and
director
9
BUSINESS ORGANIZATION ANALYSIS
Hiroshi Kawano- Representative Director, President of Sony Marketing Inc and Sony
Markleting Japan Inc.
The other board members:
Shuzo Sumi- Vice Chairman
Osamu Nagayama- Member of BOD
Toshiko Oka- Member of BOD
Tim Schaaff – Member of BOD
KunihitoMinakawa- Member of BOD
Koichi Miyata – Member of BOD
Louis Gerstner Jr. - Member of BOD
Eriko Sakurai- Member of BOD
Eikoh Harada- Member of BOD
Peter Liguori- Member of BOD
Kazuo Matsunaga-Member of BOD
John Roos- Member of BOD
Secure Best Marks with AI Grader
Need help grading? Try our AI Grader for instant feedback on your assignments.

10
BUSINESS ORGANIZATION ANALYSIS
1.7 Auditors of the Company
The company’s accounting audit is usually conducted by Prince Water House
Coopers Aarata, which is obliged under an agreement (Gray &Ehoff, 2015). Currently the
accounting auditors for the 2017 fiscal year, with ended 31st March 2018 for the company are
the followings:Hitoshi Kiuchi, TakaaiIno and Masataka Kubota (Rowledge et al., 2017).
11
BUSINESS ORGANIZATION ANALYSIS
2. Analysis of balance sheet
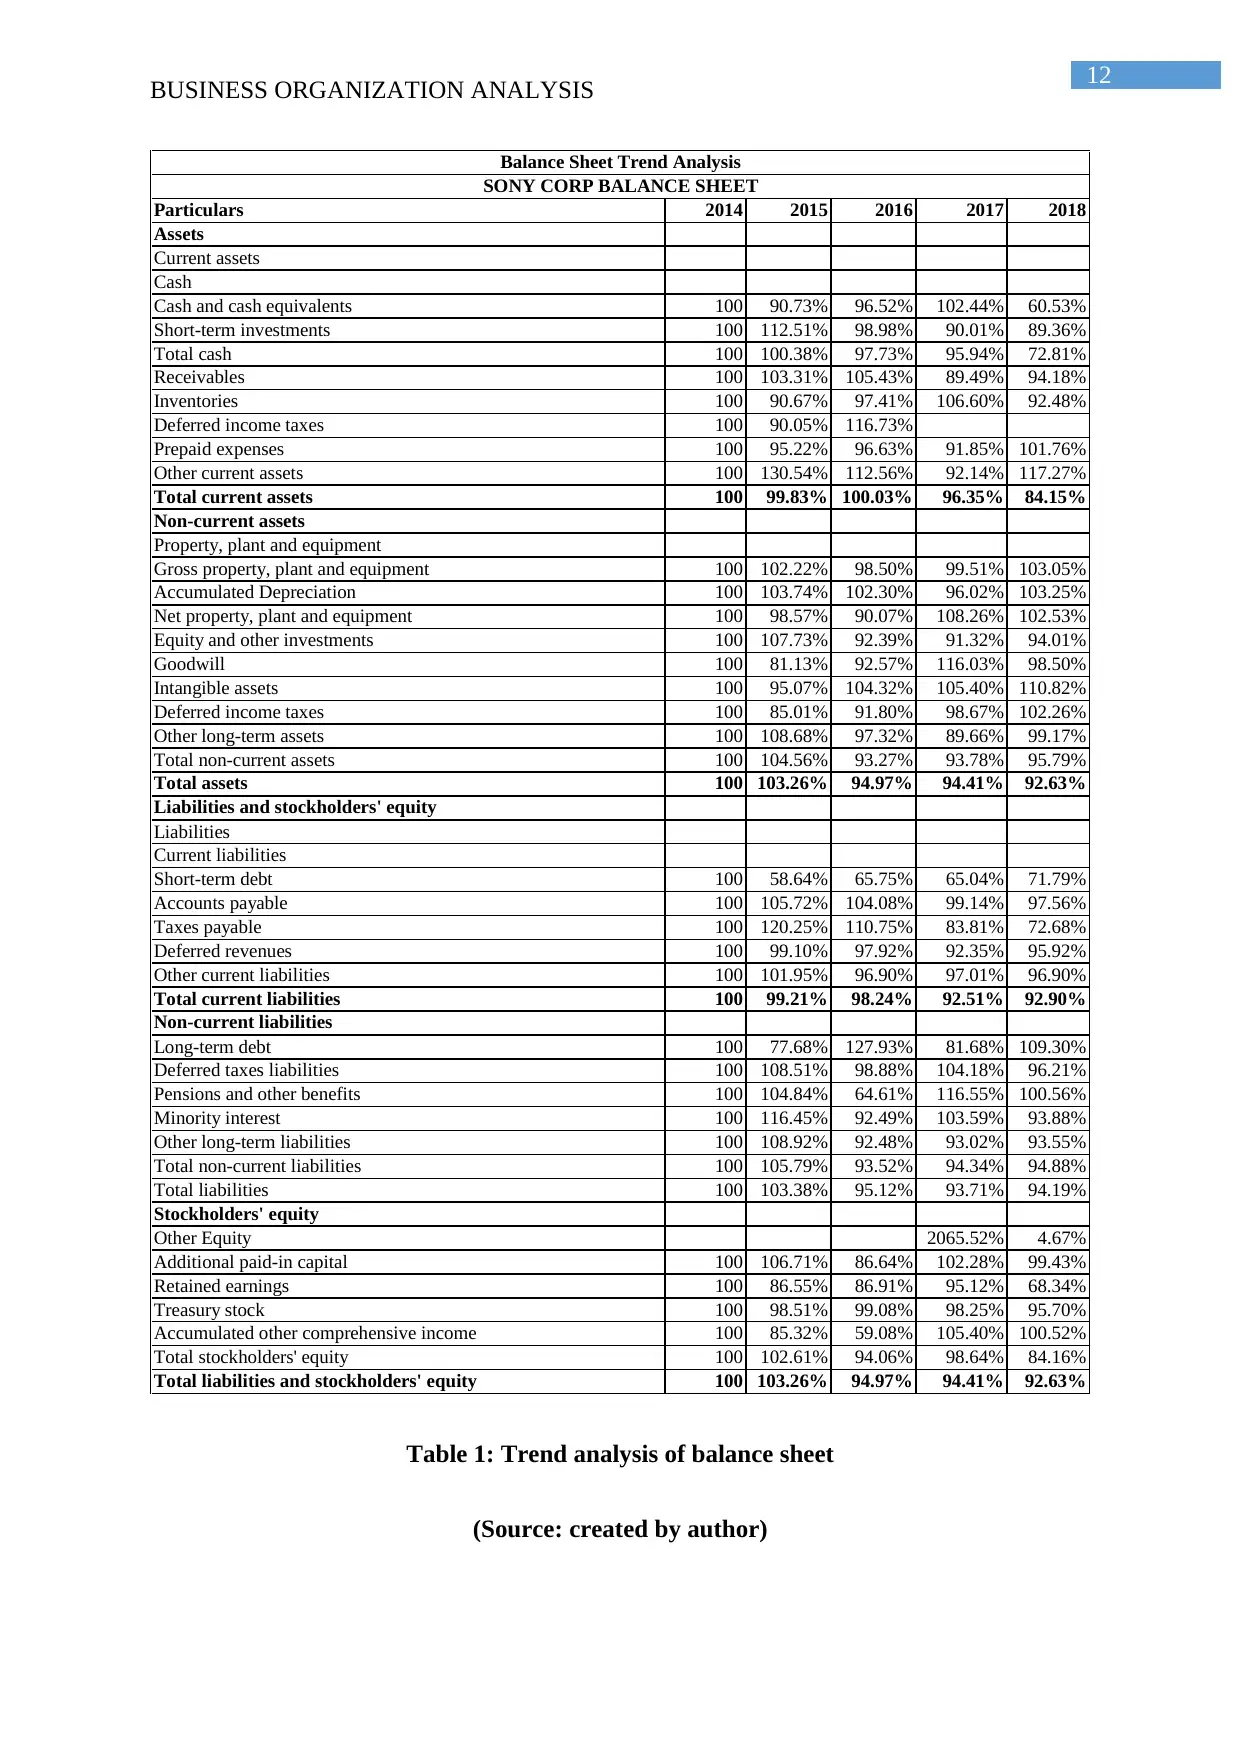
2.1 Trend analysis of balance sheet:
For a number of successive years the trend analysis of balance sheet includes the
calculations of the percentage change of the particulars. This is done by taking the particulars
of previous financial years, which is used as the base year, and the particulars of the other
years expressed as percentage of the base year. For computing the trend analysis, the base
year, which has been taken, is 2014.
BUSINESS ORGANIZATION ANALYSIS
2. Analysis of balance sheet
2.1 Trend analysis of balance sheet:
For a number of successive years the trend analysis of balance sheet includes the
calculations of the percentage change of the particulars. This is done by taking the particulars
of previous financial years, which is used as the base year, and the particulars of the other
years expressed as percentage of the base year. For computing the trend analysis, the base
year, which has been taken, is 2014.
12
BUSINESS ORGANIZATION ANALYSIS
Particulars 2014 2015 2016 2017 2018
Assets
Current assets
Cash
Cash and cash equivalents 100 90.73% 96.52% 102.44% 60.53%
Short-term investments 100 112.51% 98.98% 90.01% 89.36%
Total cash 100 100.38% 97.73% 95.94% 72.81%
Receivables 100 103.31% 105.43% 89.49% 94.18%
Inventories 100 90.67% 97.41% 106.60% 92.48%
Deferred income taxes 100 90.05% 116.73%
Prepaid expenses 100 95.22% 96.63% 91.85% 101.76%
Other current assets 100 130.54% 112.56% 92.14% 117.27%
Total current assets 100 99.83% 100.03% 96.35% 84.15%
Non-current assets
Property, plant and equipment
Gross property, plant and equipment 100 102.22% 98.50% 99.51% 103.05%
Accumulated Depreciation 100 103.74% 102.30% 96.02% 103.25%
Net property, plant and equipment 100 98.57% 90.07% 108.26% 102.53%
Equity and other investments 100 107.73% 92.39% 91.32% 94.01%
Goodwill 100 81.13% 92.57% 116.03% 98.50%
Intangible assets 100 95.07% 104.32% 105.40% 110.82%
Deferred income taxes 100 85.01% 91.80% 98.67% 102.26%
Other long-term assets 100 108.68% 97.32% 89.66% 99.17%
Total non-current assets 100 104.56% 93.27% 93.78% 95.79%
Total assets 100 103.26% 94.97% 94.41% 92.63%
Liabilities and stockholders' equity
Liabilities
Current liabilities
Short-term debt 100 58.64% 65.75% 65.04% 71.79%
Accounts payable 100 105.72% 104.08% 99.14% 97.56%
Taxes payable 100 120.25% 110.75% 83.81% 72.68%
Deferred revenues 100 99.10% 97.92% 92.35% 95.92%
Other current liabilities 100 101.95% 96.90% 97.01% 96.90%
Total current liabilities 100 99.21% 98.24% 92.51% 92.90%
Non-current liabilities
Long-term debt 100 77.68% 127.93% 81.68% 109.30%
Deferred taxes liabilities 100 108.51% 98.88% 104.18% 96.21%
Pensions and other benefits 100 104.84% 64.61% 116.55% 100.56%
Minority interest 100 116.45% 92.49% 103.59% 93.88%
Other long-term liabilities 100 108.92% 92.48% 93.02% 93.55%
Total non-current liabilities 100 105.79% 93.52% 94.34% 94.88%
Total liabilities 100 103.38% 95.12% 93.71% 94.19%
Stockholders' equity
Other Equity 2065.52% 4.67%
Additional paid-in capital 100 106.71% 86.64% 102.28% 99.43%
Retained earnings 100 86.55% 86.91% 95.12% 68.34%
Treasury stock 100 98.51% 99.08% 98.25% 95.70%
Accumulated other comprehensive income 100 85.32% 59.08% 105.40% 100.52%
Total stockholders' equity 100 102.61% 94.06% 98.64% 84.16%
Total liabilities and stockholders' equity 100 103.26% 94.97% 94.41% 92.63%
SONY CORP BALANCE SHEET
Balance Sheet Trend Analysis
Table 1: Trend analysis of balance sheet
(Source: created by author)
Paraphrase This Document
Need a fresh take? Get an instant paraphrase of this document with our AI Paraphraser
13
BUSINESS ORGANIZATION ANALYSIS
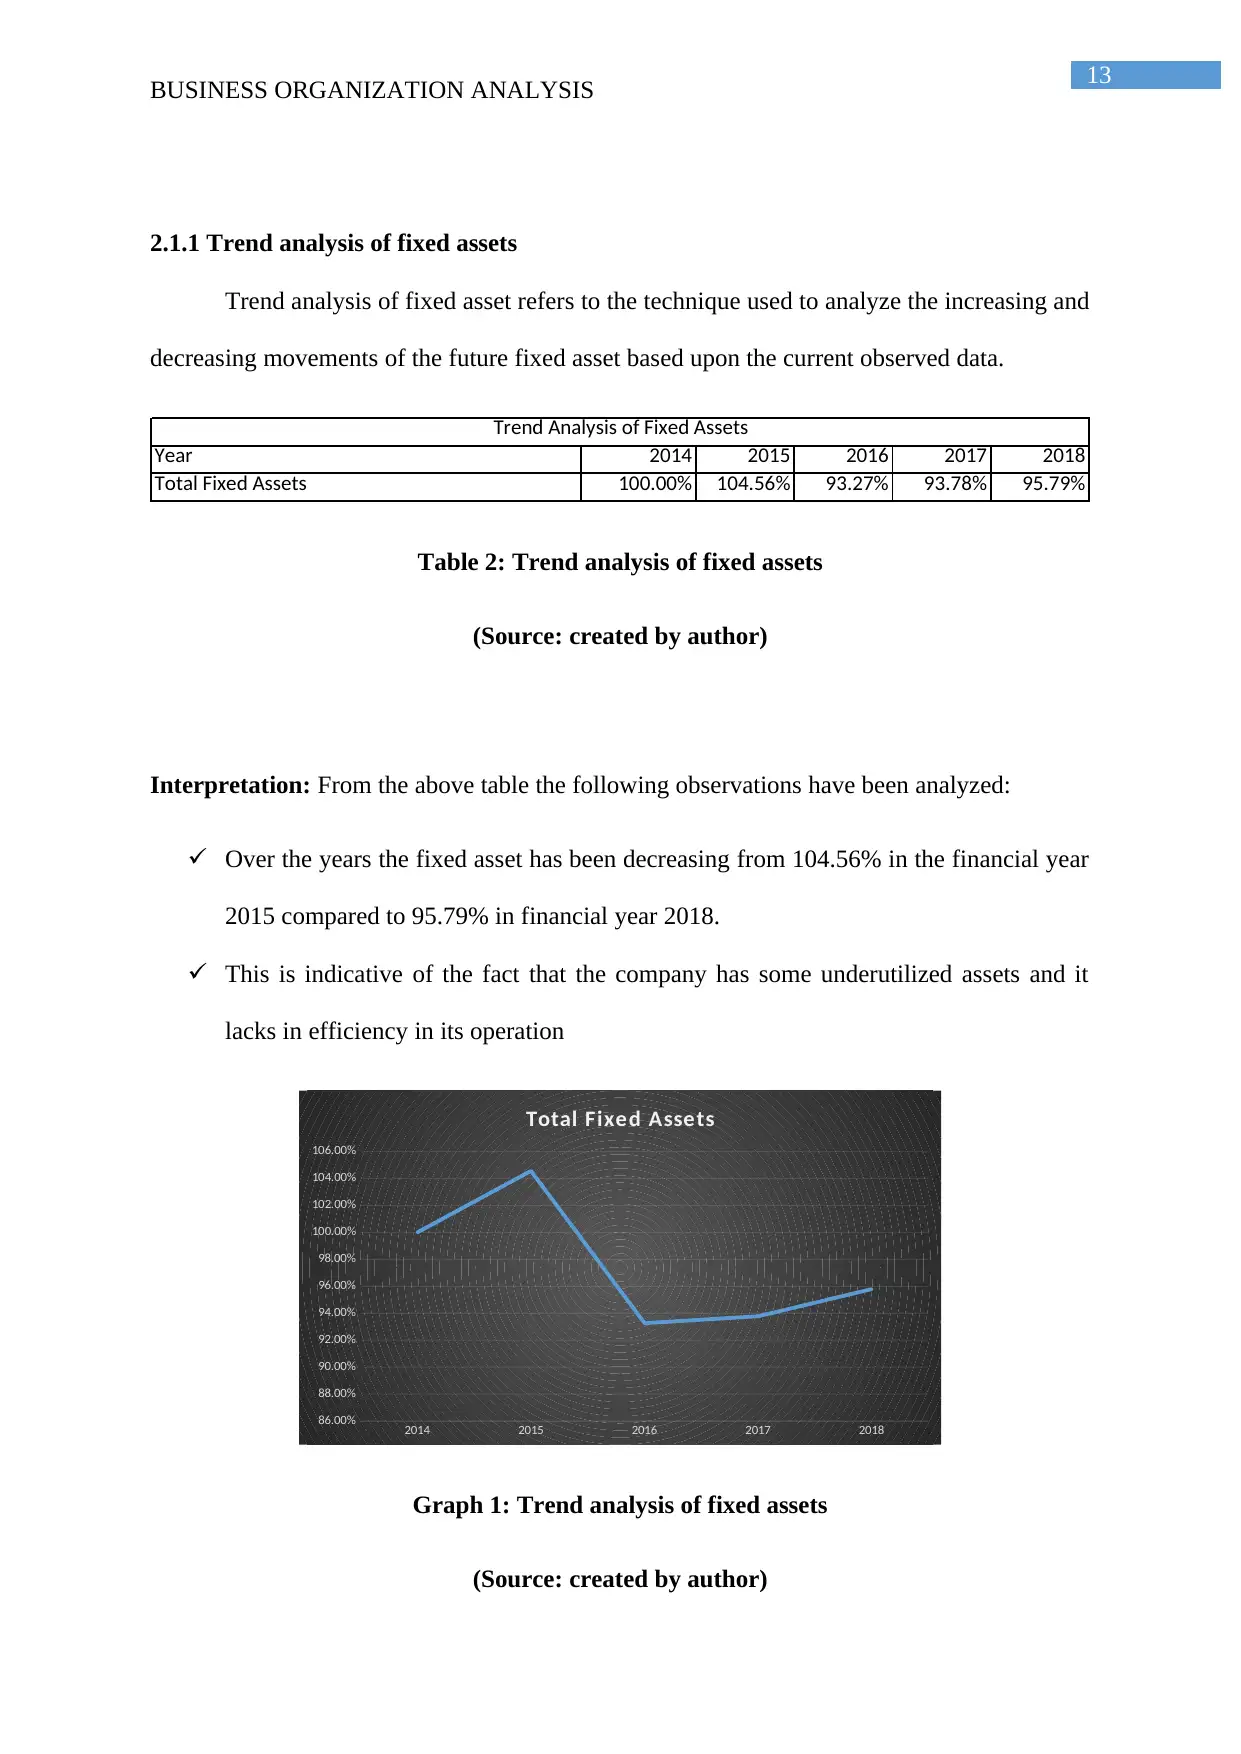
2.1.1 Trend analysis of fixed assets
Trend analysis of fixed asset refers to the technique used to analyze the increasing and
decreasing movements of the future fixed asset based upon the current observed data.
Year 2014 2015 2016 2017 2018
Total Fixed Assets 100.00% 104.56% 93.27% 93.78% 95.79%
Trend Analysis of Fixed Assets
Table 2: Trend analysis of fixed assets
(Source: created by author)
Interpretation: From the above table the following observations have been analyzed:
Over the years the fixed asset has been decreasing from 104.56% in the financial year
2015 compared to 95.79% in financial year 2018.
This is indicative of the fact that the company has some underutilized assets and it
lacks in efficiency in its operation
2014 2015 2016 2017 2018
86.00%
88.00%
90.00%
92.00%
94.00%
96.00%
98.00%
100.00%
102.00%
104.00%
106.00%
Total Fixed Assets
Graph 1: Trend analysis of fixed assets
(Source: created by author)
BUSINESS ORGANIZATION ANALYSIS
2.1.1 Trend analysis of fixed assets
Trend analysis of fixed asset refers to the technique used to analyze the increasing and
decreasing movements of the future fixed asset based upon the current observed data.
Year 2014 2015 2016 2017 2018
Total Fixed Assets 100.00% 104.56% 93.27% 93.78% 95.79%
Trend Analysis of Fixed Assets
Table 2: Trend analysis of fixed assets
(Source: created by author)
Interpretation: From the above table the following observations have been analyzed:
Over the years the fixed asset has been decreasing from 104.56% in the financial year
2015 compared to 95.79% in financial year 2018.
This is indicative of the fact that the company has some underutilized assets and it
lacks in efficiency in its operation
2014 2015 2016 2017 2018
86.00%
88.00%
90.00%
92.00%
94.00%
96.00%
98.00%
100.00%
102.00%
104.00%
106.00%
Total Fixed Assets
Graph 1: Trend analysis of fixed assets
(Source: created by author)
14
BUSINESS ORGANIZATION ANALYSIS
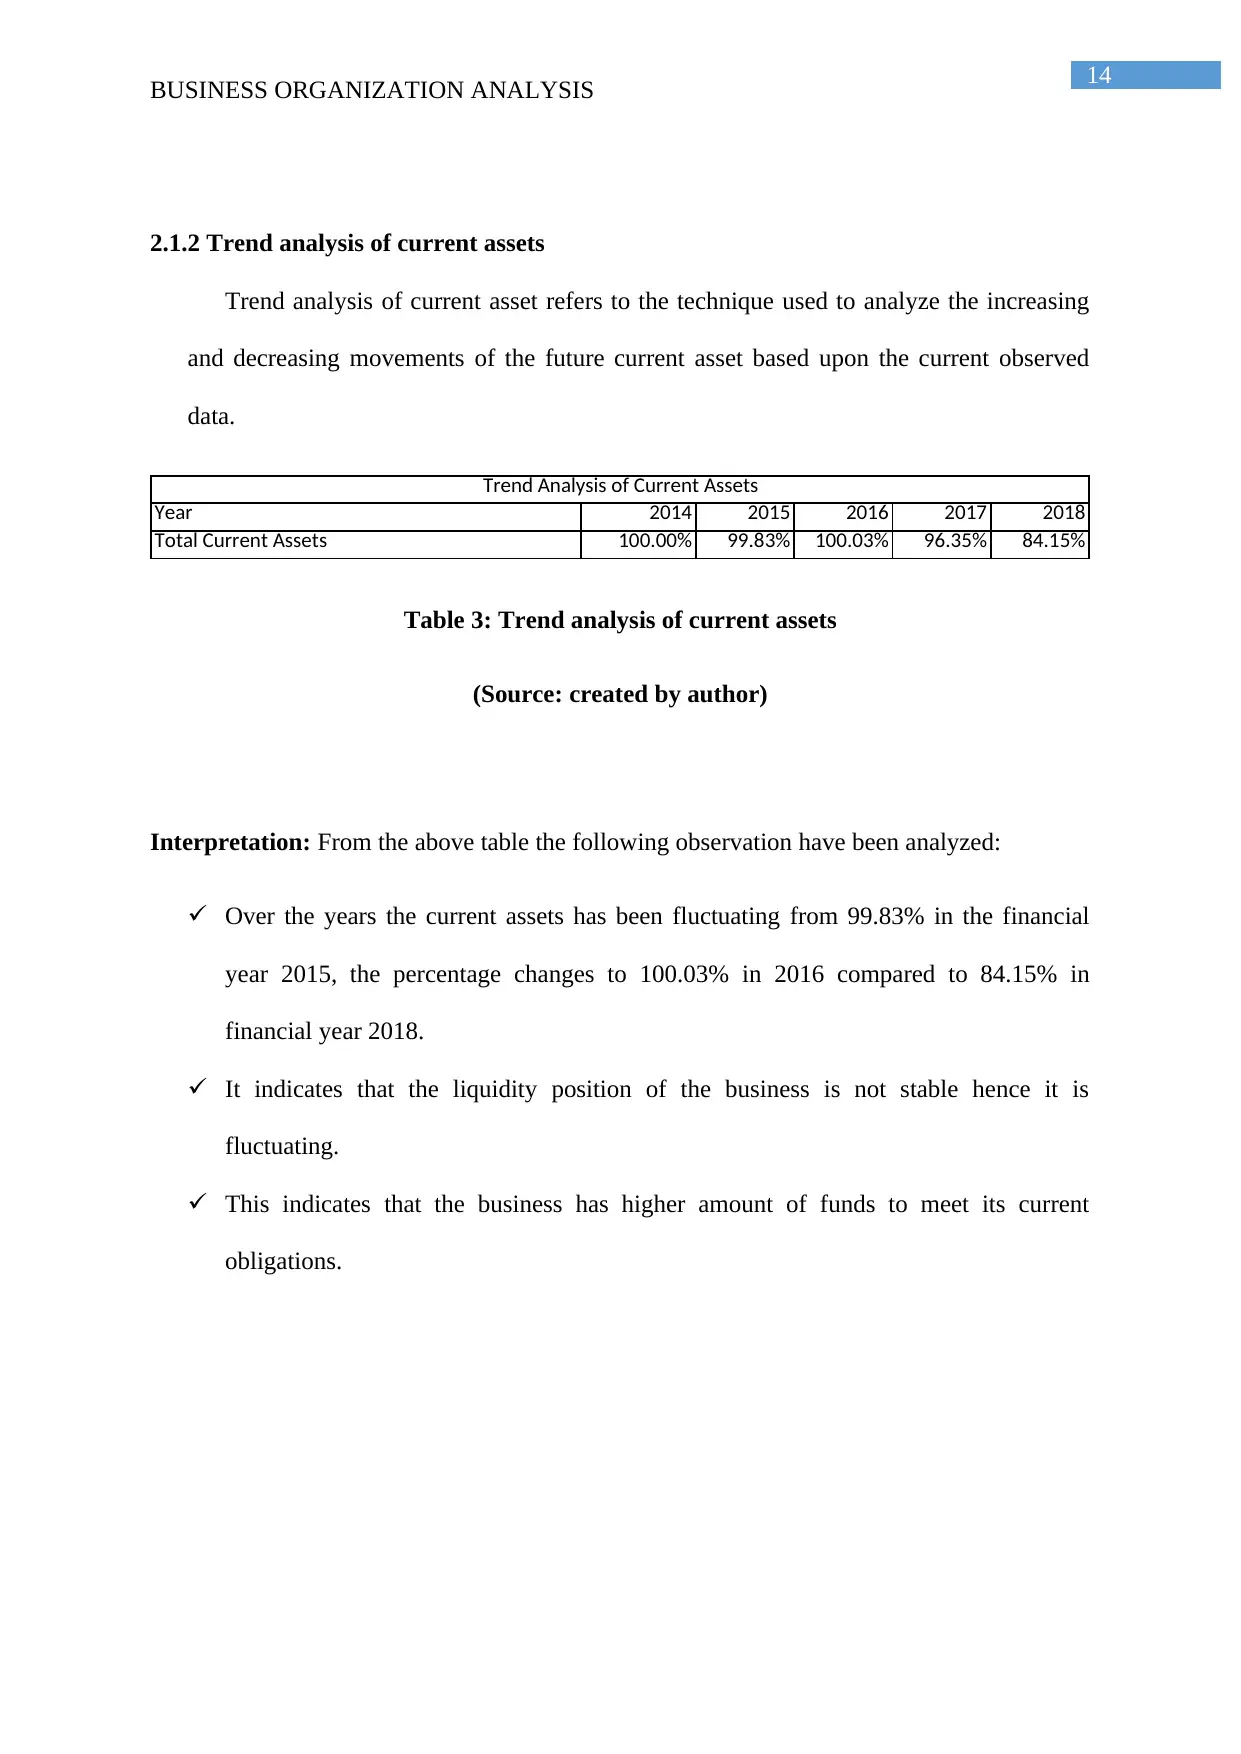
2.1.2 Trend analysis of current assets
Trend analysis of current asset refers to the technique used to analyze the increasing
and decreasing movements of the future current asset based upon the current observed
data.
Year 2014 2015 2016 2017 2018
Total Current Assets 100.00% 99.83% 100.03% 96.35% 84.15%
Trend Analysis of Current Assets
Table 3: Trend analysis of current assets
(Source: created by author)
Interpretation: From the above table the following observation have been analyzed:
Over the years the current assets has been fluctuating from 99.83% in the financial
year 2015, the percentage changes to 100.03% in 2016 compared to 84.15% in
financial year 2018.
It indicates that the liquidity position of the business is not stable hence it is
fluctuating.
This indicates that the business has higher amount of funds to meet its current
obligations.
BUSINESS ORGANIZATION ANALYSIS
2.1.2 Trend analysis of current assets
Trend analysis of current asset refers to the technique used to analyze the increasing
and decreasing movements of the future current asset based upon the current observed
data.
Year 2014 2015 2016 2017 2018
Total Current Assets 100.00% 99.83% 100.03% 96.35% 84.15%
Trend Analysis of Current Assets
Table 3: Trend analysis of current assets
(Source: created by author)
Interpretation: From the above table the following observation have been analyzed:
Over the years the current assets has been fluctuating from 99.83% in the financial
year 2015, the percentage changes to 100.03% in 2016 compared to 84.15% in
financial year 2018.
It indicates that the liquidity position of the business is not stable hence it is
fluctuating.
This indicates that the business has higher amount of funds to meet its current
obligations.
15
BUSINESS ORGANIZATION ANALYSIS
2014 2015 2016 2017 2018
75.00%
80.00%
85.00%
90.00%
95.00%
100.00%
105.00%
Total Current Assets
Graph 2: Trend analysis of current assets
(Source: created by author)
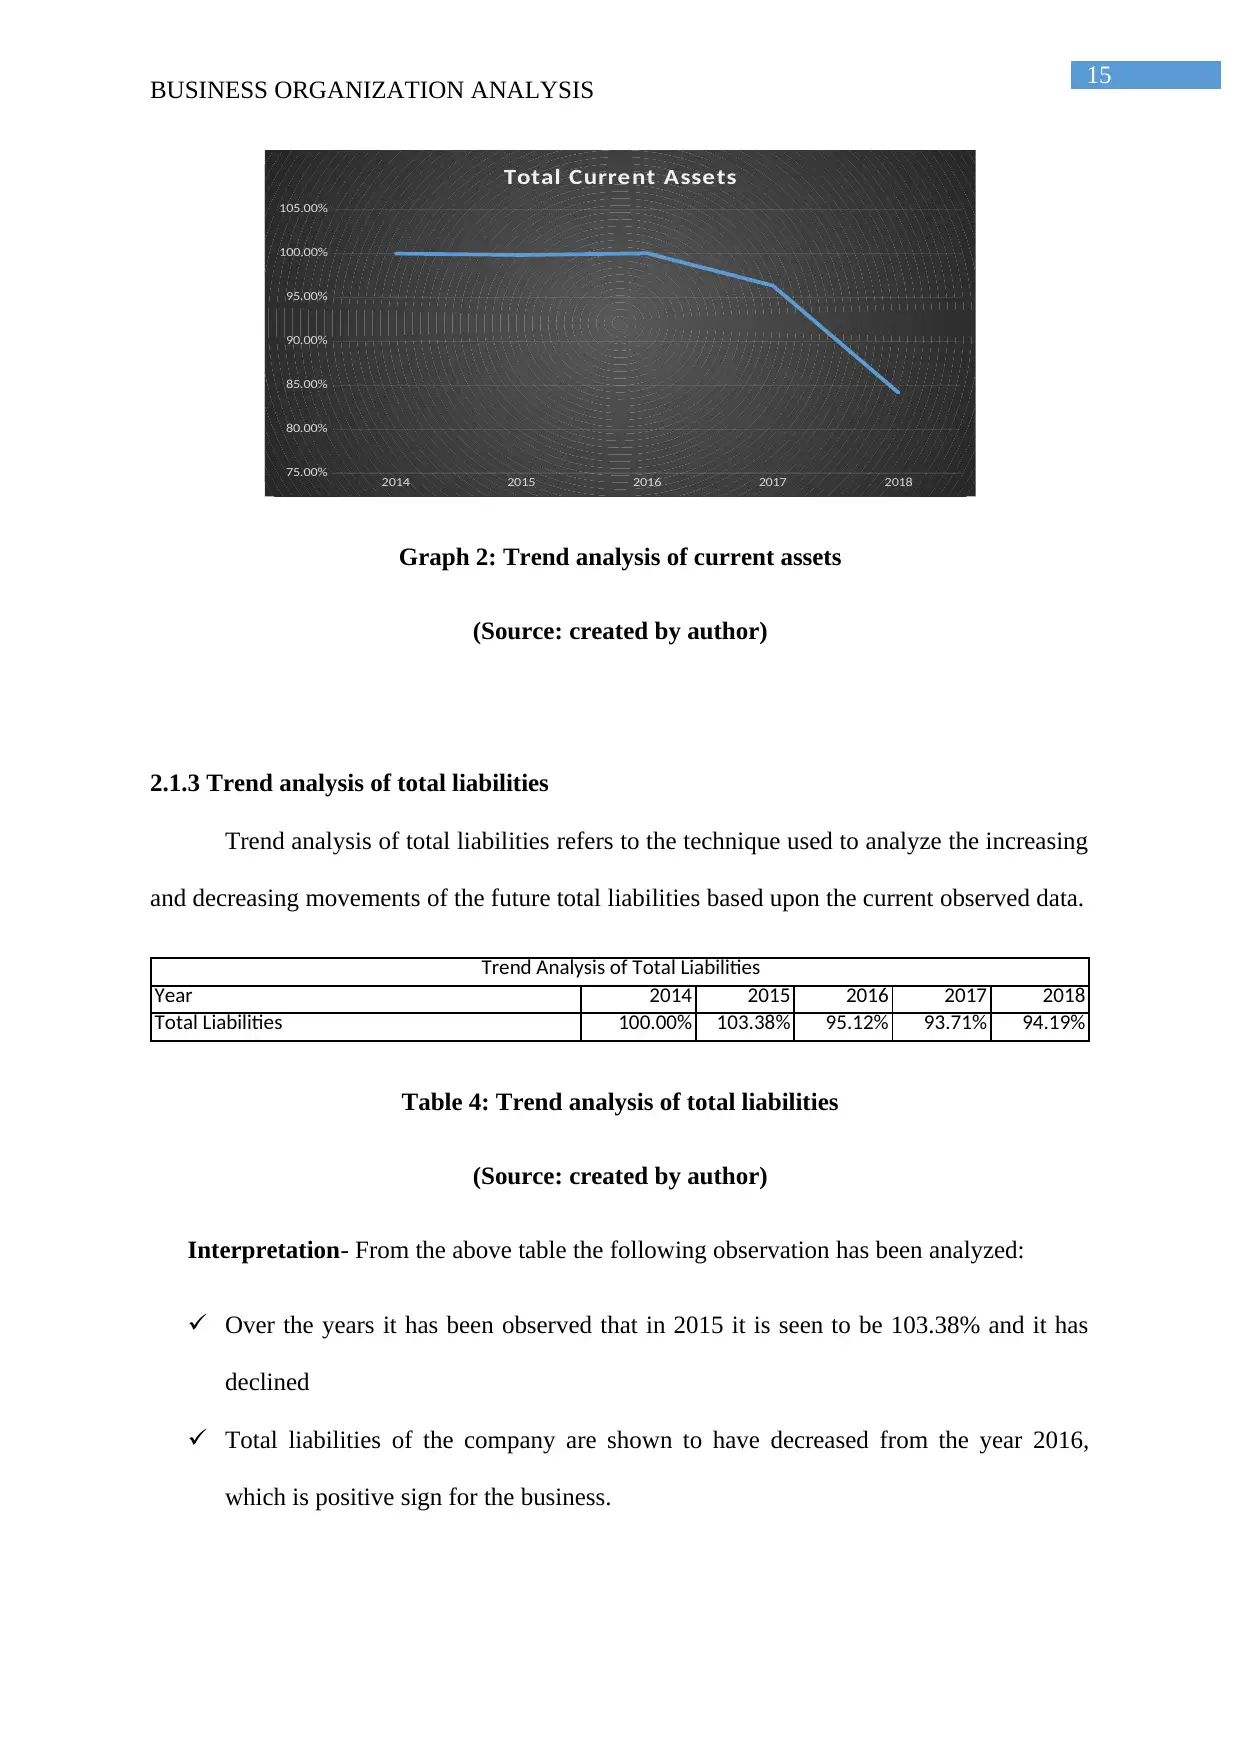
2.1.3 Trend analysis of total liabilities
Trend analysis of total liabilities refers to the technique used to analyze the increasing
and decreasing movements of the future total liabilities based upon the current observed data.
Year 2014 2015 2016 2017 2018
Total Liabilities 100.00% 103.38% 95.12% 93.71% 94.19%
Trend Analysis of Total Liabilities
Table 4: Trend analysis of total liabilities
(Source: created by author)
Interpretation- From the above table the following observation has been analyzed:
Over the years it has been observed that in 2015 it is seen to be 103.38% and it has
declined
Total liabilities of the company are shown to have decreased from the year 2016,
which is positive sign for the business.
BUSINESS ORGANIZATION ANALYSIS
2014 2015 2016 2017 2018
75.00%
80.00%
85.00%
90.00%
95.00%
100.00%
105.00%
Total Current Assets
Graph 2: Trend analysis of current assets
(Source: created by author)
2.1.3 Trend analysis of total liabilities
Trend analysis of total liabilities refers to the technique used to analyze the increasing
and decreasing movements of the future total liabilities based upon the current observed data.
Year 2014 2015 2016 2017 2018
Total Liabilities 100.00% 103.38% 95.12% 93.71% 94.19%
Trend Analysis of Total Liabilities
Table 4: Trend analysis of total liabilities
(Source: created by author)
Interpretation- From the above table the following observation has been analyzed:
Over the years it has been observed that in 2015 it is seen to be 103.38% and it has
declined
Total liabilities of the company are shown to have decreased from the year 2016,
which is positive sign for the business.
Secure Best Marks with AI Grader
Need help grading? Try our AI Grader for instant feedback on your assignments.
16
BUSINESS ORGANIZATION ANALYSIS
The decrease in total liabilities indicates that the financial position of the business is
strong and it is stable as well.
2014 2015 2016 2017 2018
88.00%
90.00%
92.00%
94.00%
96.00%
98.00%
100.00%
102.00%
104.00%
106.00%
Total Liabiliti es
Graph 3: Trend analysis of total liabilities
(Source: created by author)
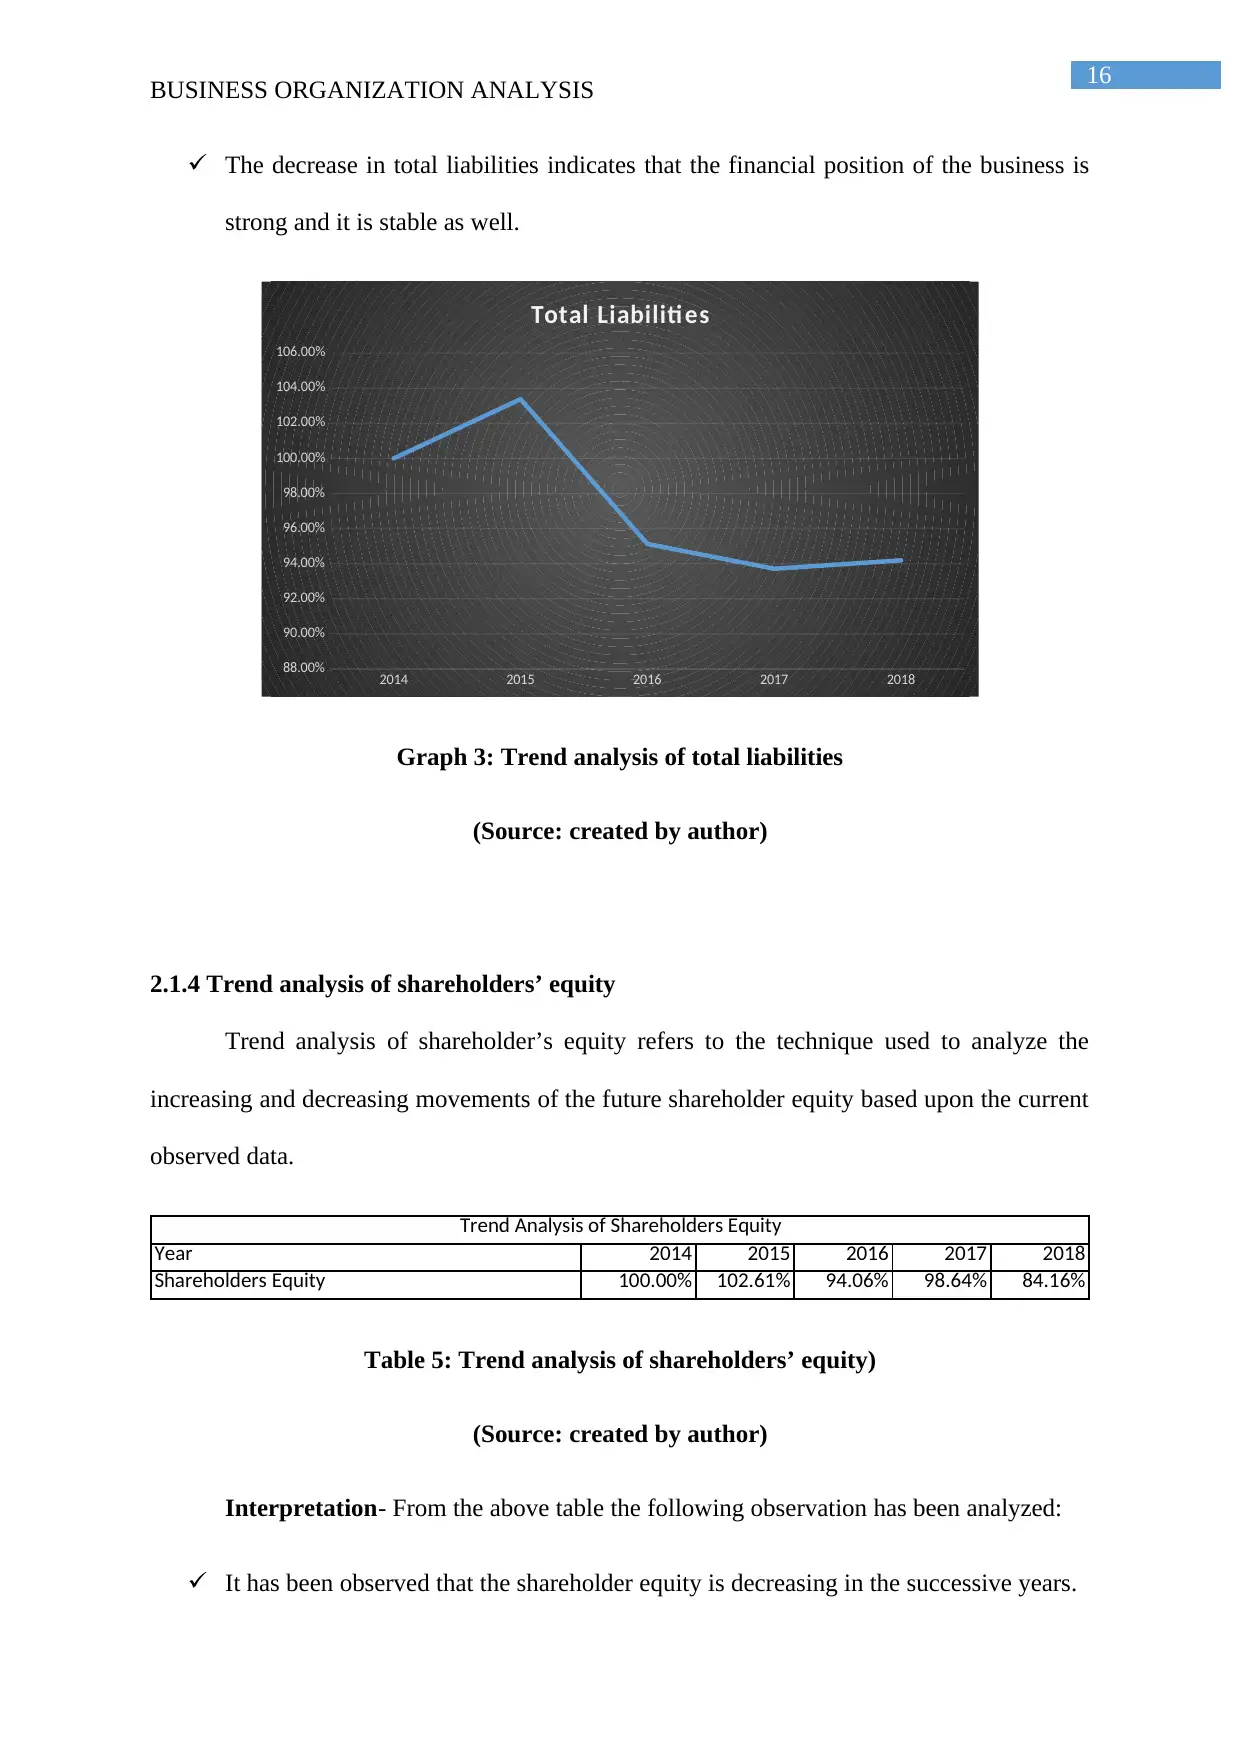
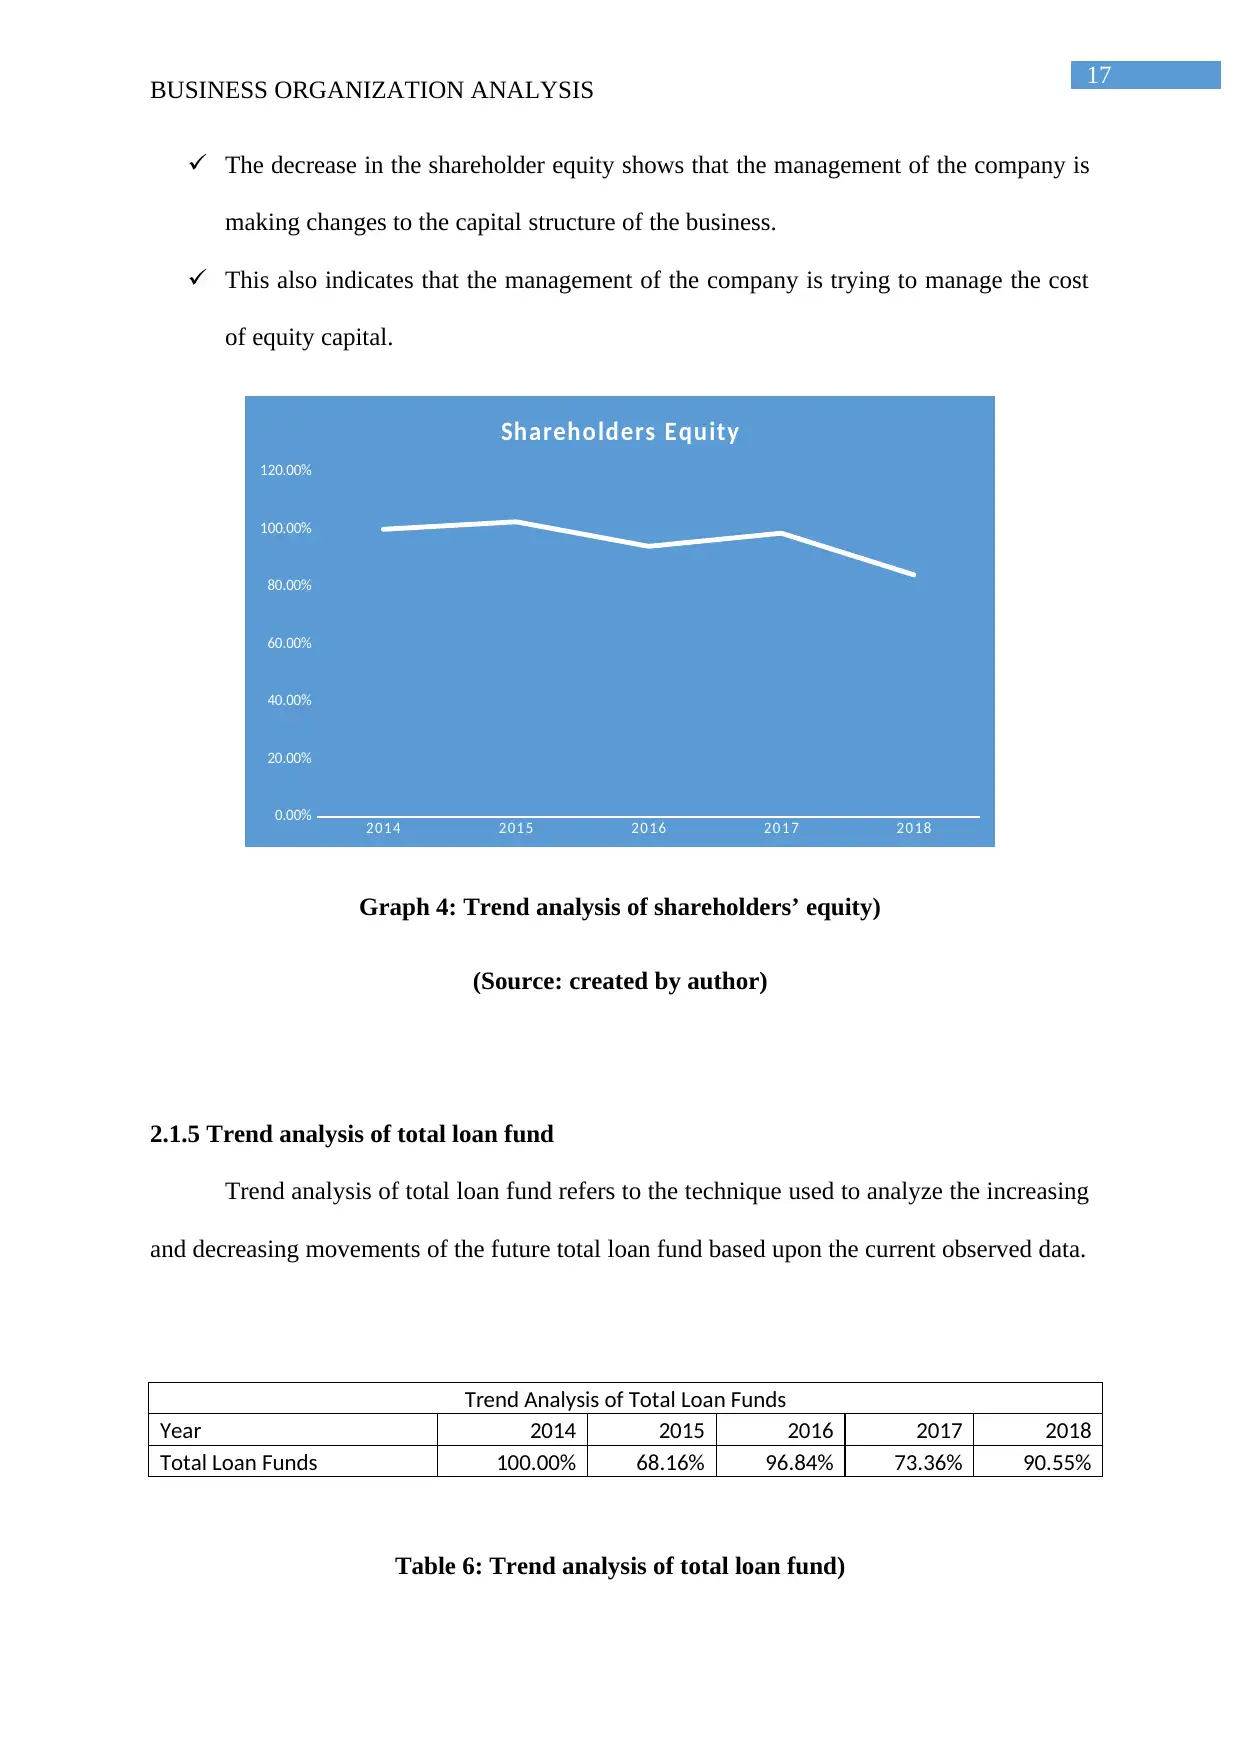
2.1.4 Trend analysis of shareholders’ equity
Trend analysis of shareholder’s equity refers to the technique used to analyze the
increasing and decreasing movements of the future shareholder equity based upon the current
observed data.
Year 2014 2015 2016 2017 2018
Shareholders Equity 100.00% 102.61% 94.06% 98.64% 84.16%
Trend Analysis of Shareholders Equity
Table 5: Trend analysis of shareholders’ equity)
(Source: created by author)
Interpretation- From the above table the following observation has been analyzed:
It has been observed that the shareholder equity is decreasing in the successive years.
BUSINESS ORGANIZATION ANALYSIS
The decrease in total liabilities indicates that the financial position of the business is
strong and it is stable as well.
2014 2015 2016 2017 2018
88.00%
90.00%
92.00%
94.00%
96.00%
98.00%
100.00%
102.00%
104.00%
106.00%
Total Liabiliti es
Graph 3: Trend analysis of total liabilities
(Source: created by author)
2.1.4 Trend analysis of shareholders’ equity
Trend analysis of shareholder’s equity refers to the technique used to analyze the
increasing and decreasing movements of the future shareholder equity based upon the current
observed data.
Year 2014 2015 2016 2017 2018
Shareholders Equity 100.00% 102.61% 94.06% 98.64% 84.16%
Trend Analysis of Shareholders Equity
Table 5: Trend analysis of shareholders’ equity)
(Source: created by author)
Interpretation- From the above table the following observation has been analyzed:
It has been observed that the shareholder equity is decreasing in the successive years.
17
BUSINESS ORGANIZATION ANALYSIS
The decrease in the shareholder equity shows that the management of the company is
making changes to the capital structure of the business.
This also indicates that the management of the company is trying to manage the cost
of equity capital.
20 14 2 01 5 20 16 20 1 7 20 18
0.00%
20.00%
40.00%
60.00%
80.00%
100.00%
120.00%
Shareholders Equity
Graph 4: Trend analysis of shareholders’ equity)
(Source: created by author)
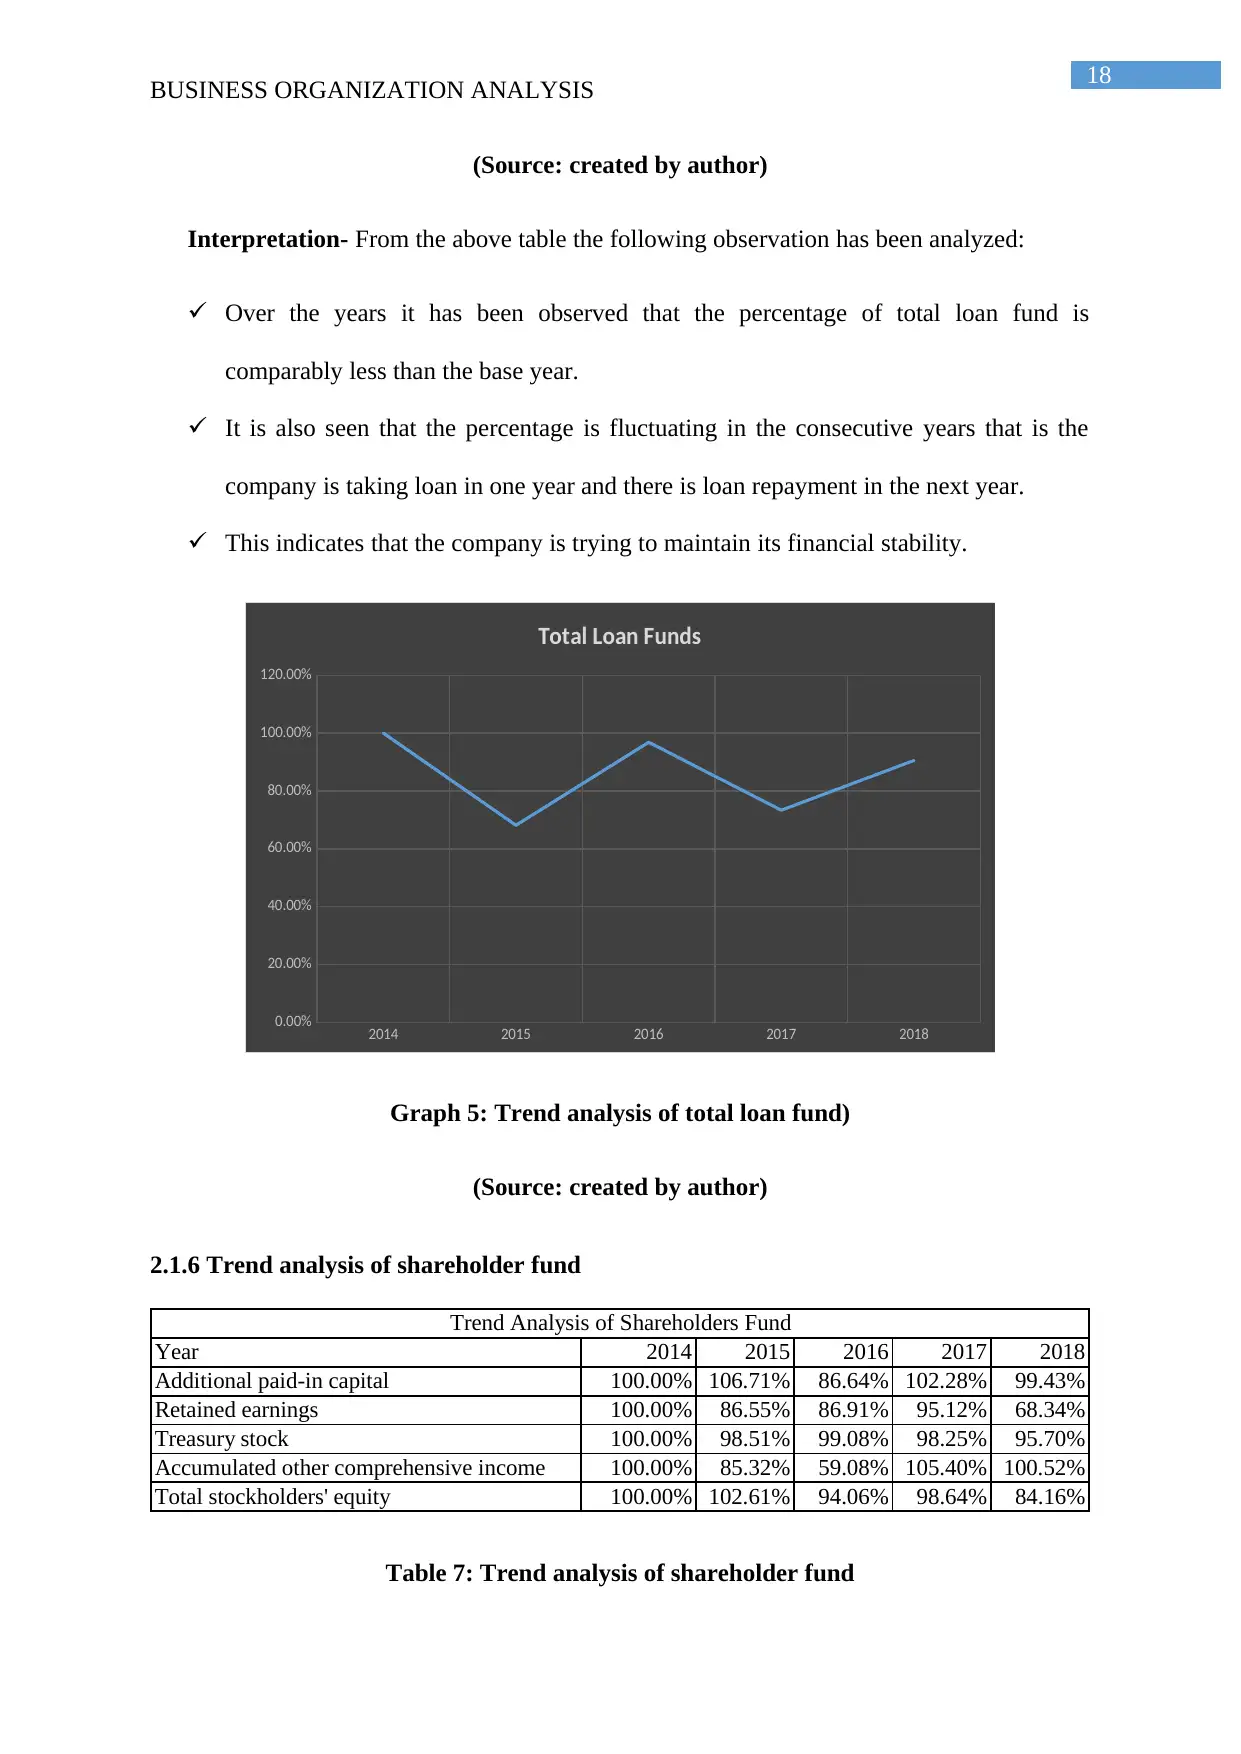
2.1.5 Trend analysis of total loan fund
Trend analysis of total loan fund refers to the technique used to analyze the increasing
and decreasing movements of the future total loan fund based upon the current observed data.
Trend Analysis of Total Loan Funds
Year 2014 2015 2016 2017 2018
Total Loan Funds 100.00% 68.16% 96.84% 73.36% 90.55%
Table 6: Trend analysis of total loan fund)
BUSINESS ORGANIZATION ANALYSIS
The decrease in the shareholder equity shows that the management of the company is
making changes to the capital structure of the business.
This also indicates that the management of the company is trying to manage the cost
of equity capital.
20 14 2 01 5 20 16 20 1 7 20 18
0.00%
20.00%
40.00%
60.00%
80.00%
100.00%
120.00%
Shareholders Equity
Graph 4: Trend analysis of shareholders’ equity)
(Source: created by author)
2.1.5 Trend analysis of total loan fund
Trend analysis of total loan fund refers to the technique used to analyze the increasing
and decreasing movements of the future total loan fund based upon the current observed data.
Trend Analysis of Total Loan Funds
Year 2014 2015 2016 2017 2018
Total Loan Funds 100.00% 68.16% 96.84% 73.36% 90.55%
Table 6: Trend analysis of total loan fund)
18
BUSINESS ORGANIZATION ANALYSIS
(Source: created by author)
Interpretation- From the above table the following observation has been analyzed:
Over the years it has been observed that the percentage of total loan fund is
comparably less than the base year.
It is also seen that the percentage is fluctuating in the consecutive years that is the
company is taking loan in one year and there is loan repayment in the next year.
This indicates that the company is trying to maintain its financial stability.
2014 2015 2016 2017 2018
0.00%
20.00%
40.00%
60.00%
80.00%
100.00%
120.00%
Total Loan Funds
Graph 5: Trend analysis of total loan fund)
(Source: created by author)
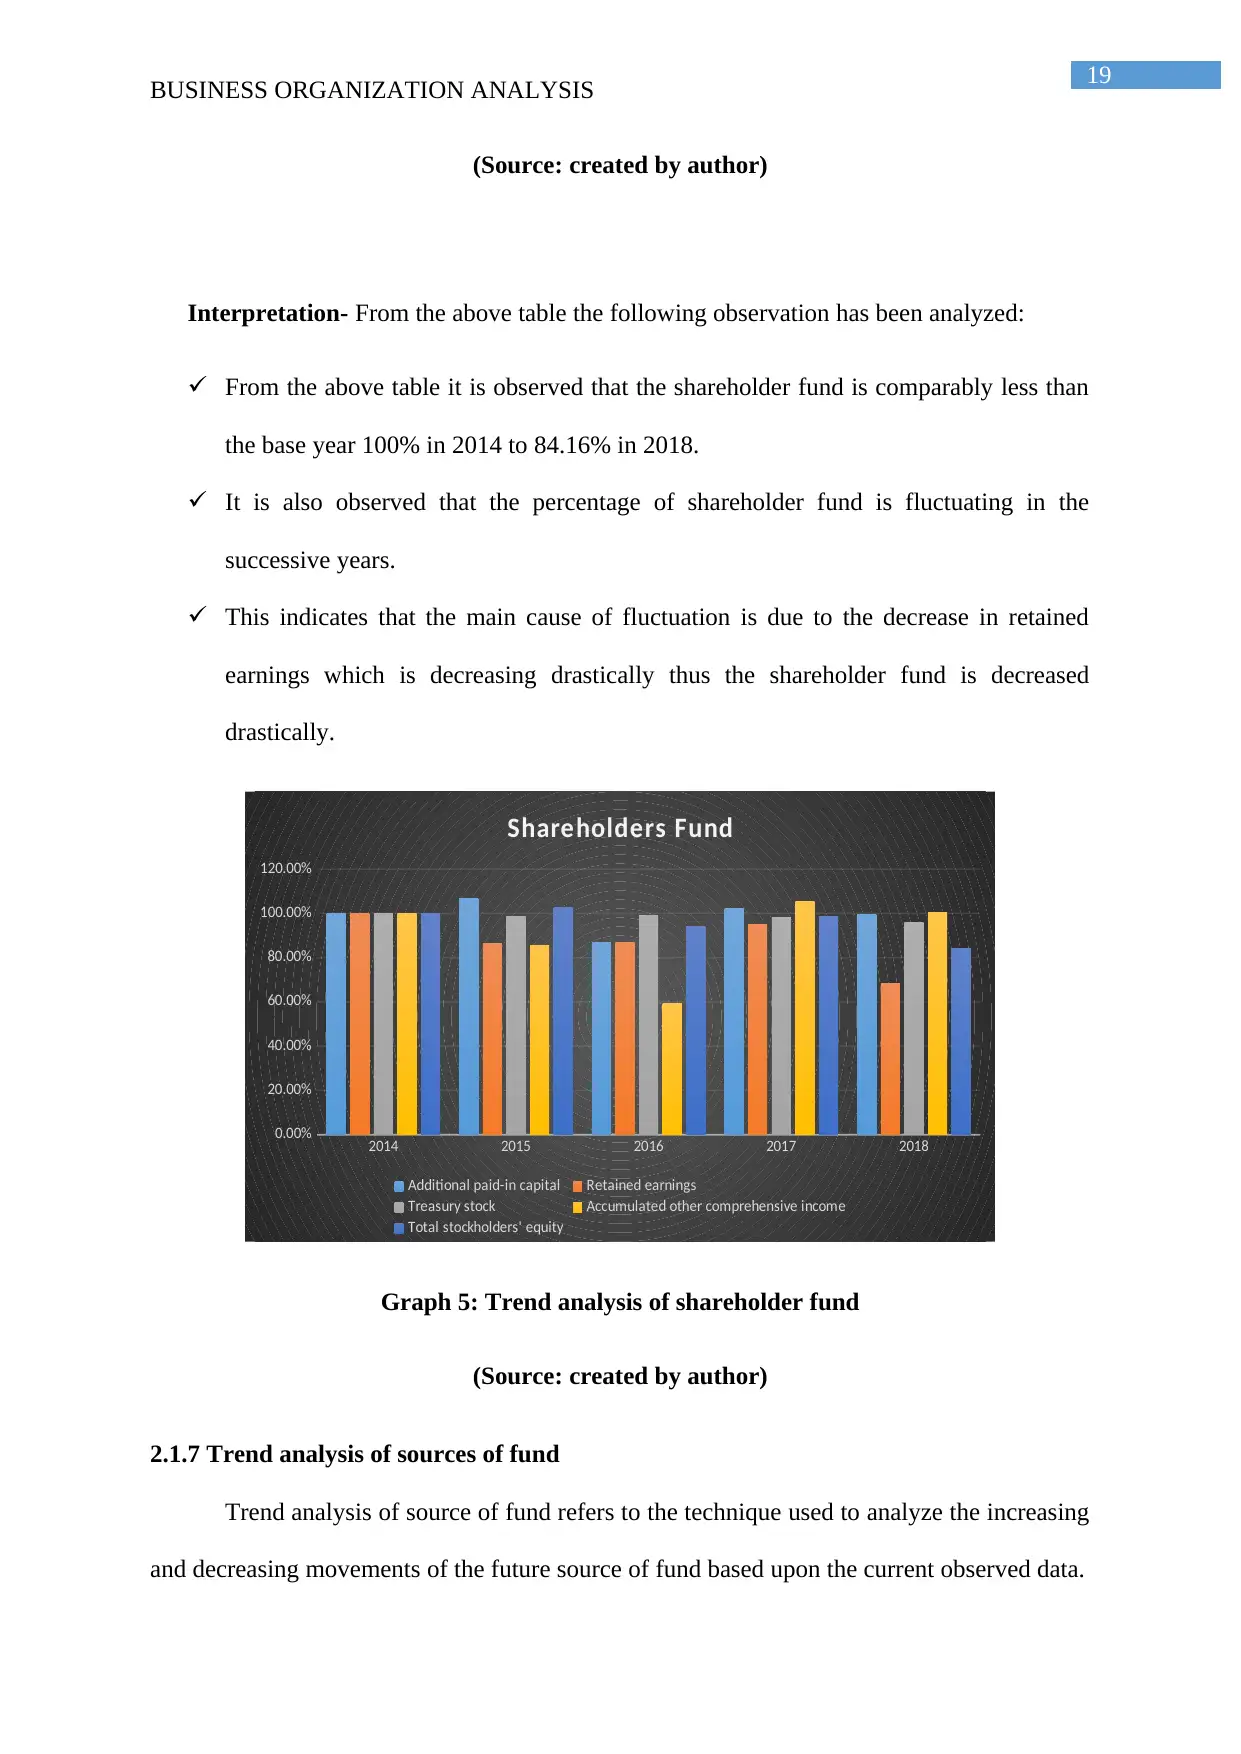
2.1.6 Trend analysis of shareholder fund
Year 2014 2015 2016 2017 2018
Additional paid-in capital 100.00% 106.71% 86.64% 102.28% 99.43%
Retained earnings 100.00% 86.55% 86.91% 95.12% 68.34%
Treasury stock 100.00% 98.51% 99.08% 98.25% 95.70%
Accumulated other comprehensive income 100.00% 85.32% 59.08% 105.40% 100.52%
Total stockholders' equity 100.00% 102.61% 94.06% 98.64% 84.16%
Trend Analysis of Shareholders Fund
Table 7: Trend analysis of shareholder fund
BUSINESS ORGANIZATION ANALYSIS
(Source: created by author)
Interpretation- From the above table the following observation has been analyzed:
Over the years it has been observed that the percentage of total loan fund is
comparably less than the base year.
It is also seen that the percentage is fluctuating in the consecutive years that is the
company is taking loan in one year and there is loan repayment in the next year.
This indicates that the company is trying to maintain its financial stability.
2014 2015 2016 2017 2018
0.00%
20.00%
40.00%
60.00%
80.00%
100.00%
120.00%
Total Loan Funds
Graph 5: Trend analysis of total loan fund)
(Source: created by author)
2.1.6 Trend analysis of shareholder fund
Year 2014 2015 2016 2017 2018
Additional paid-in capital 100.00% 106.71% 86.64% 102.28% 99.43%
Retained earnings 100.00% 86.55% 86.91% 95.12% 68.34%
Treasury stock 100.00% 98.51% 99.08% 98.25% 95.70%
Accumulated other comprehensive income 100.00% 85.32% 59.08% 105.40% 100.52%
Total stockholders' equity 100.00% 102.61% 94.06% 98.64% 84.16%
Trend Analysis of Shareholders Fund
Table 7: Trend analysis of shareholder fund
Paraphrase This Document
Need a fresh take? Get an instant paraphrase of this document with our AI Paraphraser
19
BUSINESS ORGANIZATION ANALYSIS
(Source: created by author)
Interpretation- From the above table the following observation has been analyzed:
From the above table it is observed that the shareholder fund is comparably less than
the base year 100% in 2014 to 84.16% in 2018.
It is also observed that the percentage of shareholder fund is fluctuating in the
successive years.
This indicates that the main cause of fluctuation is due to the decrease in retained
earnings which is decreasing drastically thus the shareholder fund is decreased
drastically.
2014 2015 2016 2017 2018
0.00%
20.00%
40.00%
60.00%
80.00%
100.00%
120.00%
Shareholders Fund
Additional paid-in capital Retained earnings
Treasury stock Accumulated other comprehensive income
Total stockholders' equity
Graph 5: Trend analysis of shareholder fund
(Source: created by author)
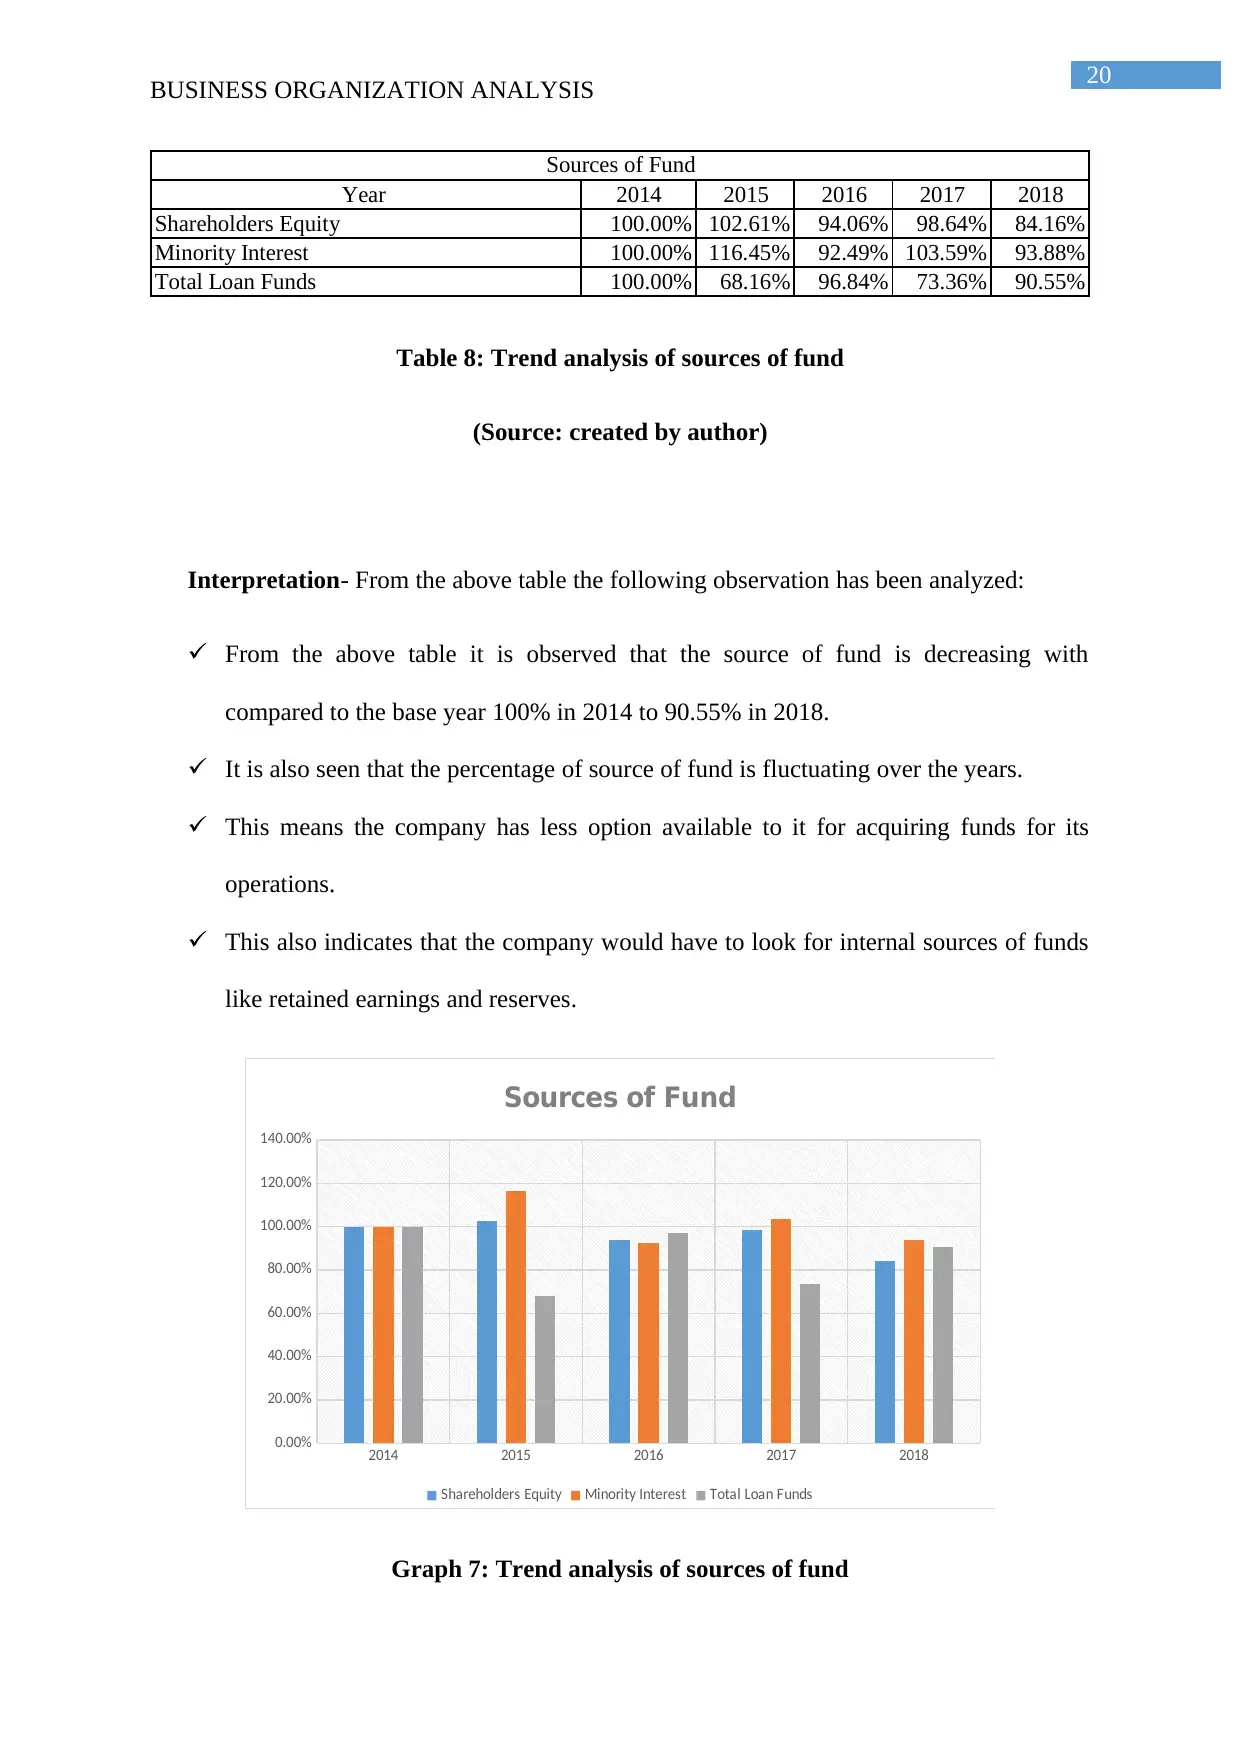
2.1.7 Trend analysis of sources of fund
Trend analysis of source of fund refers to the technique used to analyze the increasing
and decreasing movements of the future source of fund based upon the current observed data.
BUSINESS ORGANIZATION ANALYSIS
(Source: created by author)
Interpretation- From the above table the following observation has been analyzed:
From the above table it is observed that the shareholder fund is comparably less than
the base year 100% in 2014 to 84.16% in 2018.
It is also observed that the percentage of shareholder fund is fluctuating in the
successive years.
This indicates that the main cause of fluctuation is due to the decrease in retained
earnings which is decreasing drastically thus the shareholder fund is decreased
drastically.
2014 2015 2016 2017 2018
0.00%
20.00%
40.00%
60.00%
80.00%
100.00%
120.00%
Shareholders Fund
Additional paid-in capital Retained earnings
Treasury stock Accumulated other comprehensive income
Total stockholders' equity
Graph 5: Trend analysis of shareholder fund
(Source: created by author)
2.1.7 Trend analysis of sources of fund
Trend analysis of source of fund refers to the technique used to analyze the increasing
and decreasing movements of the future source of fund based upon the current observed data.
20
BUSINESS ORGANIZATION ANALYSIS
Year 2014 2015 2016 2017 2018
Shareholders Equity 100.00% 102.61% 94.06% 98.64% 84.16%
Minority Interest 100.00% 116.45% 92.49% 103.59% 93.88%
Total Loan Funds 100.00% 68.16% 96.84% 73.36% 90.55%
Sources of Fund
Table 8: Trend analysis of sources of fund
(Source: created by author)
Interpretation- From the above table the following observation has been analyzed:
From the above table it is observed that the source of fund is decreasing with
compared to the base year 100% in 2014 to 90.55% in 2018.
It is also seen that the percentage of source of fund is fluctuating over the years.
This means the company has less option available to it for acquiring funds for its
operations.
This also indicates that the company would have to look for internal sources of funds
like retained earnings and reserves.
2014 2015 2016 2017 2018
0.00%
20.00%
40.00%
60.00%
80.00%
100.00%
120.00%
140.00%
Sources of Fund
Shareholders Equity Minority Interest Total Loan Funds
Graph 7: Trend analysis of sources of fund
21
BUSINESS ORGANIZATION ANALYSIS
(Source: created by author)
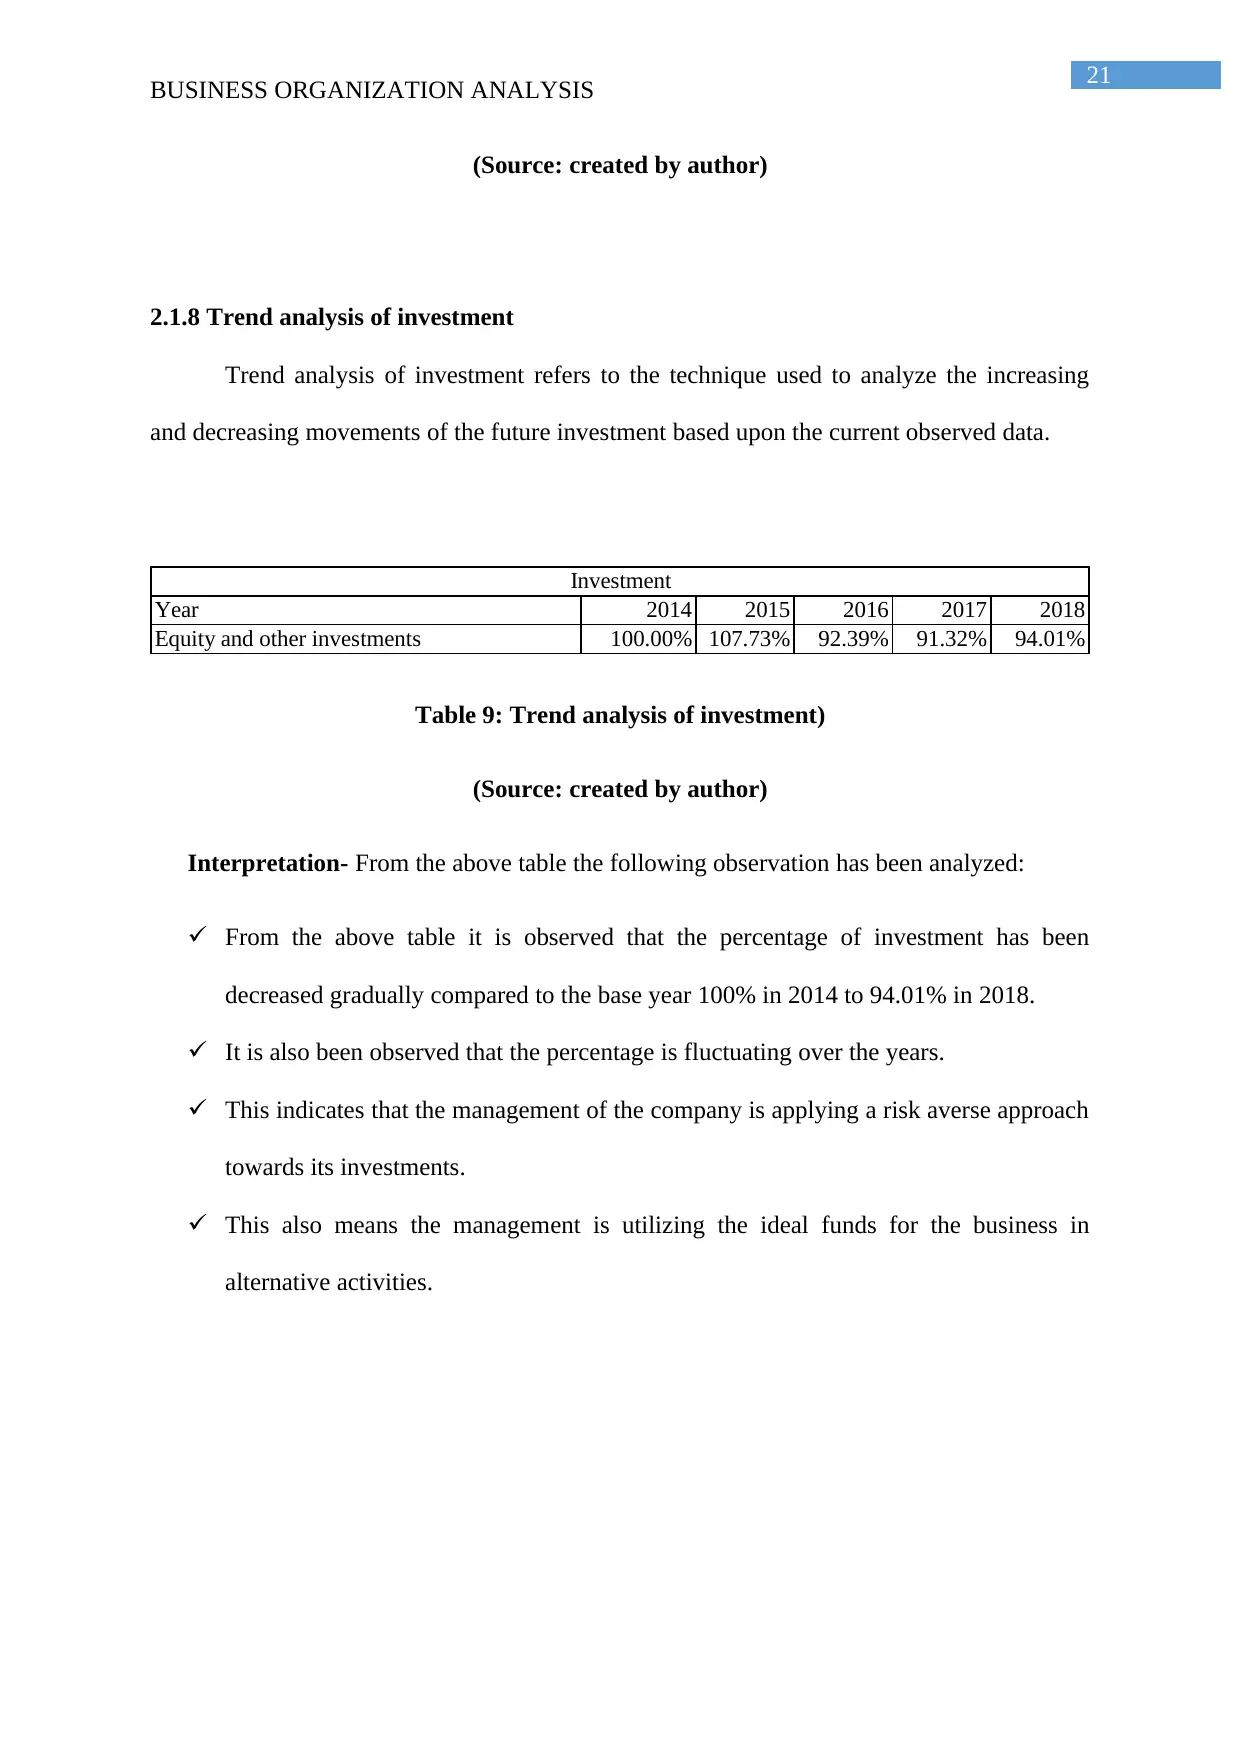
2.1.8 Trend analysis of investment
Trend analysis of investment refers to the technique used to analyze the increasing
and decreasing movements of the future investment based upon the current observed data.
Year 2014 2015 2016 2017 2018
Equity and other investments 100.00% 107.73% 92.39% 91.32% 94.01%
Investment
Table 9: Trend analysis of investment)
(Source: created by author)
Interpretation- From the above table the following observation has been analyzed:
From the above table it is observed that the percentage of investment has been
decreased gradually compared to the base year 100% in 2014 to 94.01% in 2018.
It is also been observed that the percentage is fluctuating over the years.
This indicates that the management of the company is applying a risk averse approach
towards its investments.
This also means the management is utilizing the ideal funds for the business in
alternative activities.
BUSINESS ORGANIZATION ANALYSIS
(Source: created by author)
2.1.8 Trend analysis of investment
Trend analysis of investment refers to the technique used to analyze the increasing
and decreasing movements of the future investment based upon the current observed data.
Year 2014 2015 2016 2017 2018
Equity and other investments 100.00% 107.73% 92.39% 91.32% 94.01%
Investment
Table 9: Trend analysis of investment)
(Source: created by author)
Interpretation- From the above table the following observation has been analyzed:
From the above table it is observed that the percentage of investment has been
decreased gradually compared to the base year 100% in 2014 to 94.01% in 2018.
It is also been observed that the percentage is fluctuating over the years.
This indicates that the management of the company is applying a risk averse approach
towards its investments.
This also means the management is utilizing the ideal funds for the business in
alternative activities.
Secure Best Marks with AI Grader
Need help grading? Try our AI Grader for instant feedback on your assignments.
22
BUSINESS ORGANIZATION ANALYSIS
2014 2015 2016 2017 2018
80.00%
85.00%
90.00%
95.00%
100.00%
105.00%
110.00%
Investment
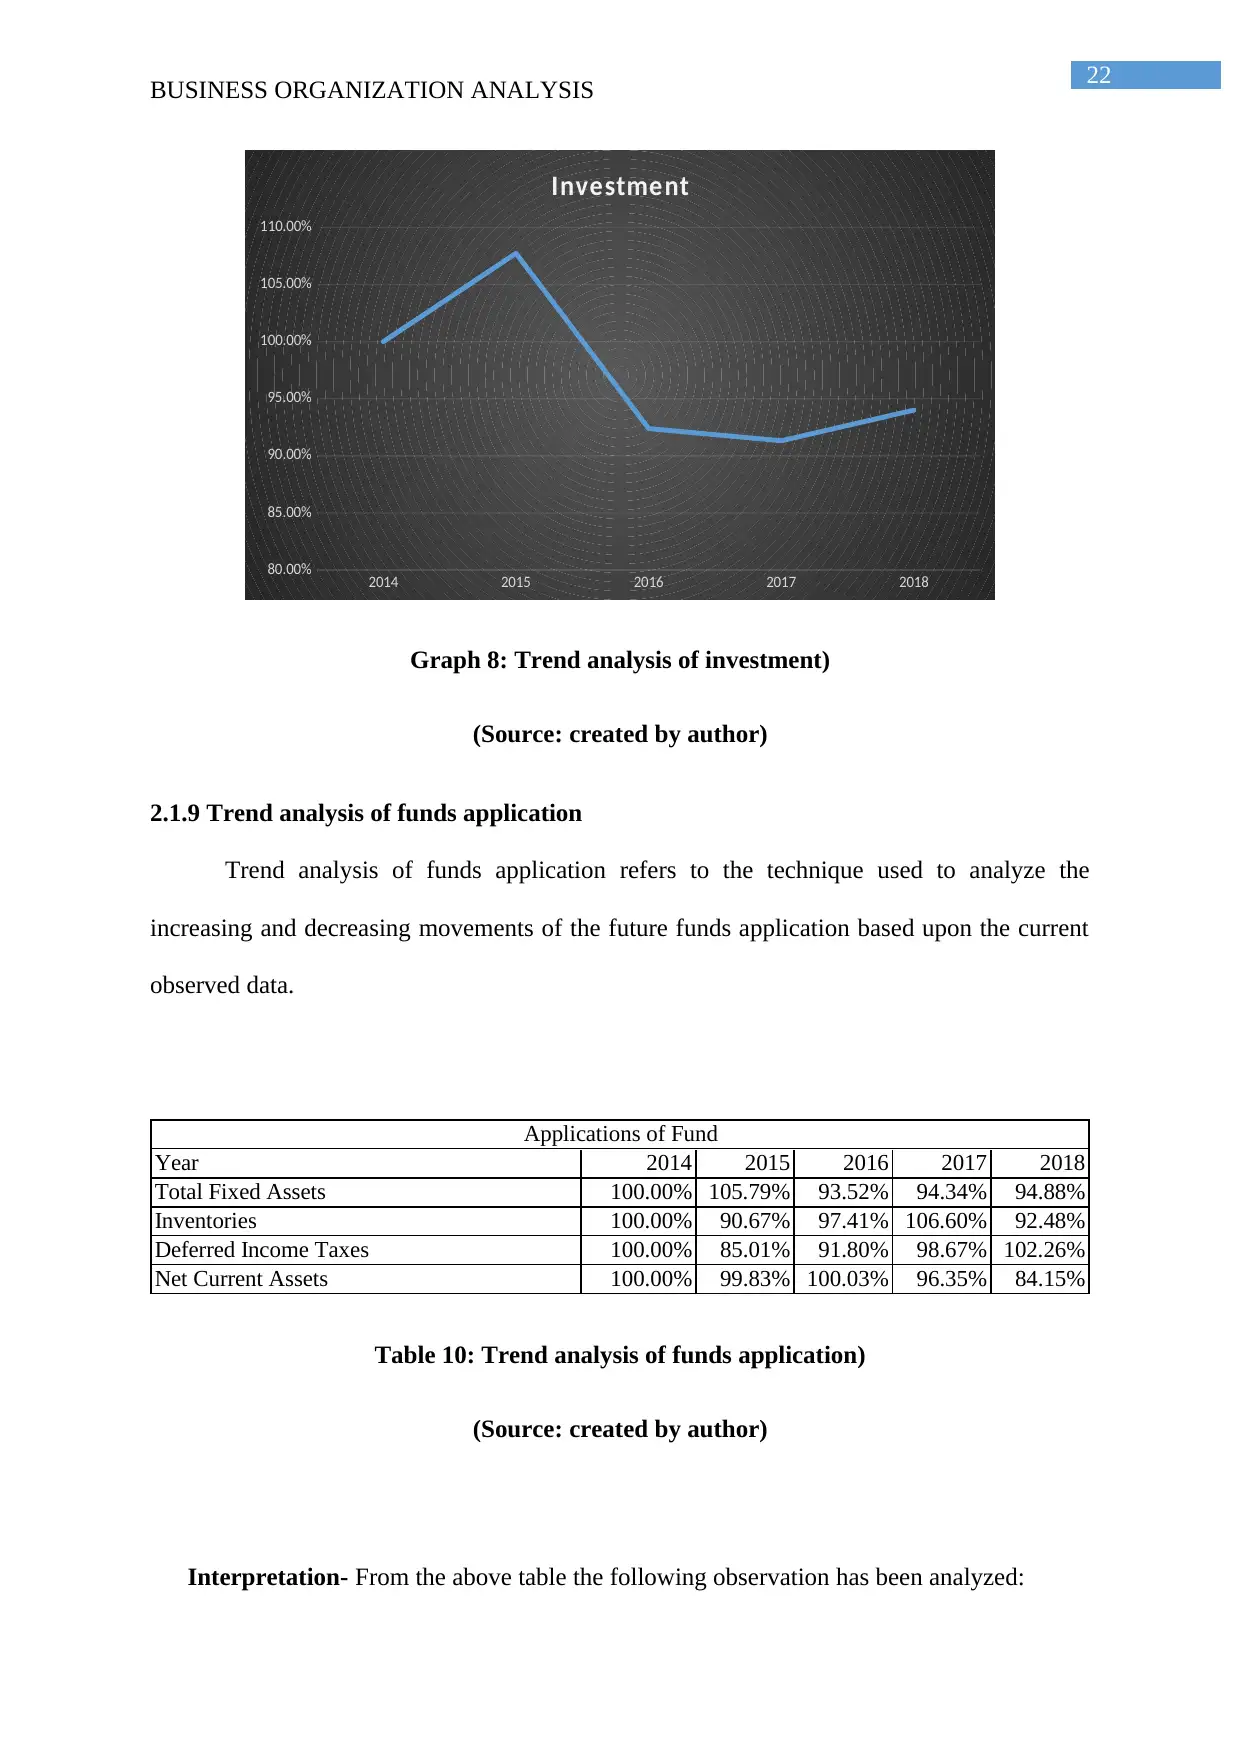
Graph 8: Trend analysis of investment)
(Source: created by author)
2.1.9 Trend analysis of funds application
Trend analysis of funds application refers to the technique used to analyze the
increasing and decreasing movements of the future funds application based upon the current
observed data.
Year 2014 2015 2016 2017 2018
Total Fixed Assets 100.00% 105.79% 93.52% 94.34% 94.88%
Inventories 100.00% 90.67% 97.41% 106.60% 92.48%
Deferred Income Taxes 100.00% 85.01% 91.80% 98.67% 102.26%
Net Current Assets 100.00% 99.83% 100.03% 96.35% 84.15%
Applications of Fund
Table 10: Trend analysis of funds application)
(Source: created by author)
Interpretation- From the above table the following observation has been analyzed:
BUSINESS ORGANIZATION ANALYSIS
2014 2015 2016 2017 2018
80.00%
85.00%
90.00%
95.00%
100.00%
105.00%
110.00%
Investment
Graph 8: Trend analysis of investment)
(Source: created by author)
2.1.9 Trend analysis of funds application
Trend analysis of funds application refers to the technique used to analyze the
increasing and decreasing movements of the future funds application based upon the current
observed data.
Year 2014 2015 2016 2017 2018
Total Fixed Assets 100.00% 105.79% 93.52% 94.34% 94.88%
Inventories 100.00% 90.67% 97.41% 106.60% 92.48%
Deferred Income Taxes 100.00% 85.01% 91.80% 98.67% 102.26%
Net Current Assets 100.00% 99.83% 100.03% 96.35% 84.15%
Applications of Fund
Table 10: Trend analysis of funds application)
(Source: created by author)
Interpretation- From the above table the following observation has been analyzed:
23
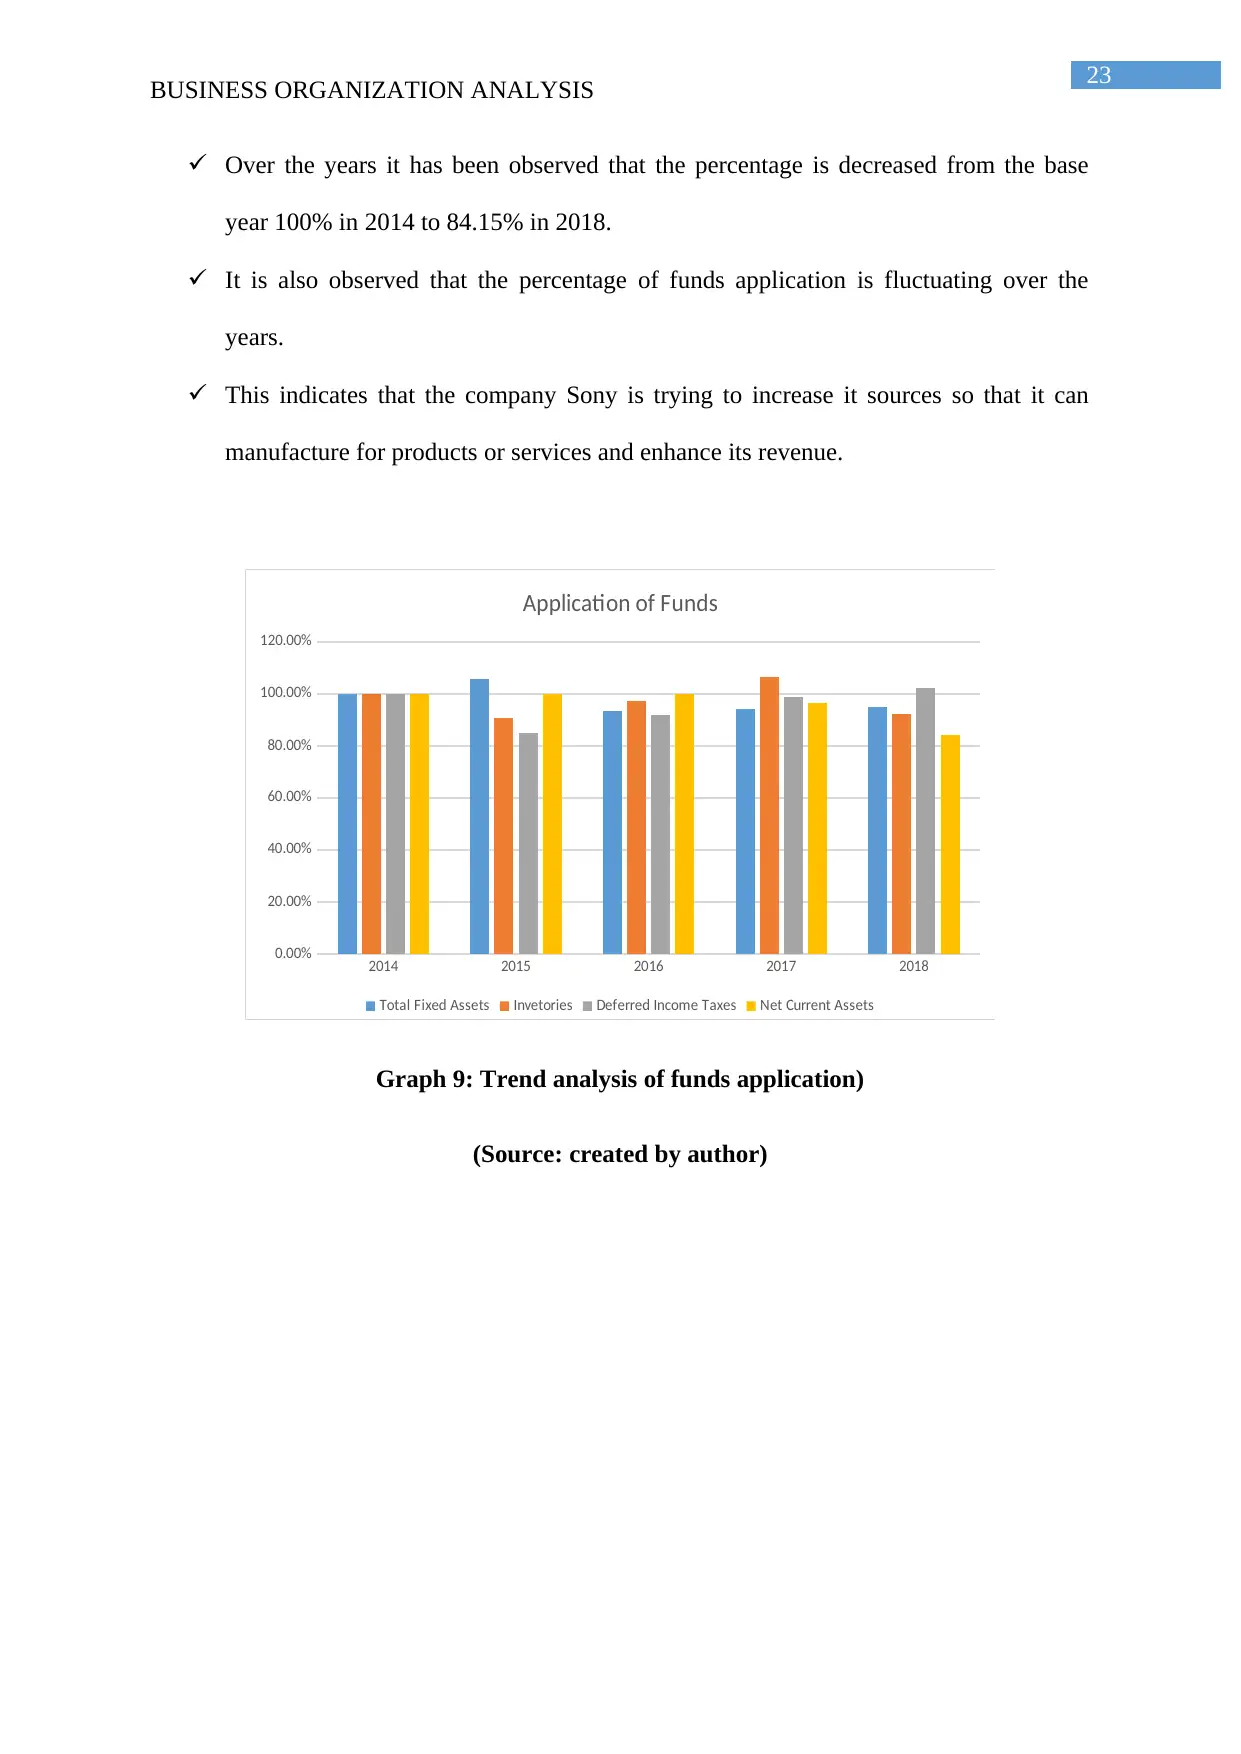
BUSINESS ORGANIZATION ANALYSIS
Over the years it has been observed that the percentage is decreased from the base
year 100% in 2014 to 84.15% in 2018.
It is also observed that the percentage of funds application is fluctuating over the
years.
This indicates that the company Sony is trying to increase it sources so that it can
manufacture for products or services and enhance its revenue.
2014 2015 2016 2017 2018
0.00%
20.00%
40.00%
60.00%
80.00%
100.00%
120.00%
Application of Funds
Total Fixed Assets Invetories Deferred Income Taxes Net Current Assets
Graph 9: Trend analysis of funds application)
(Source: created by author)
24
BUSINESS ORGANIZATION ANALYSIS
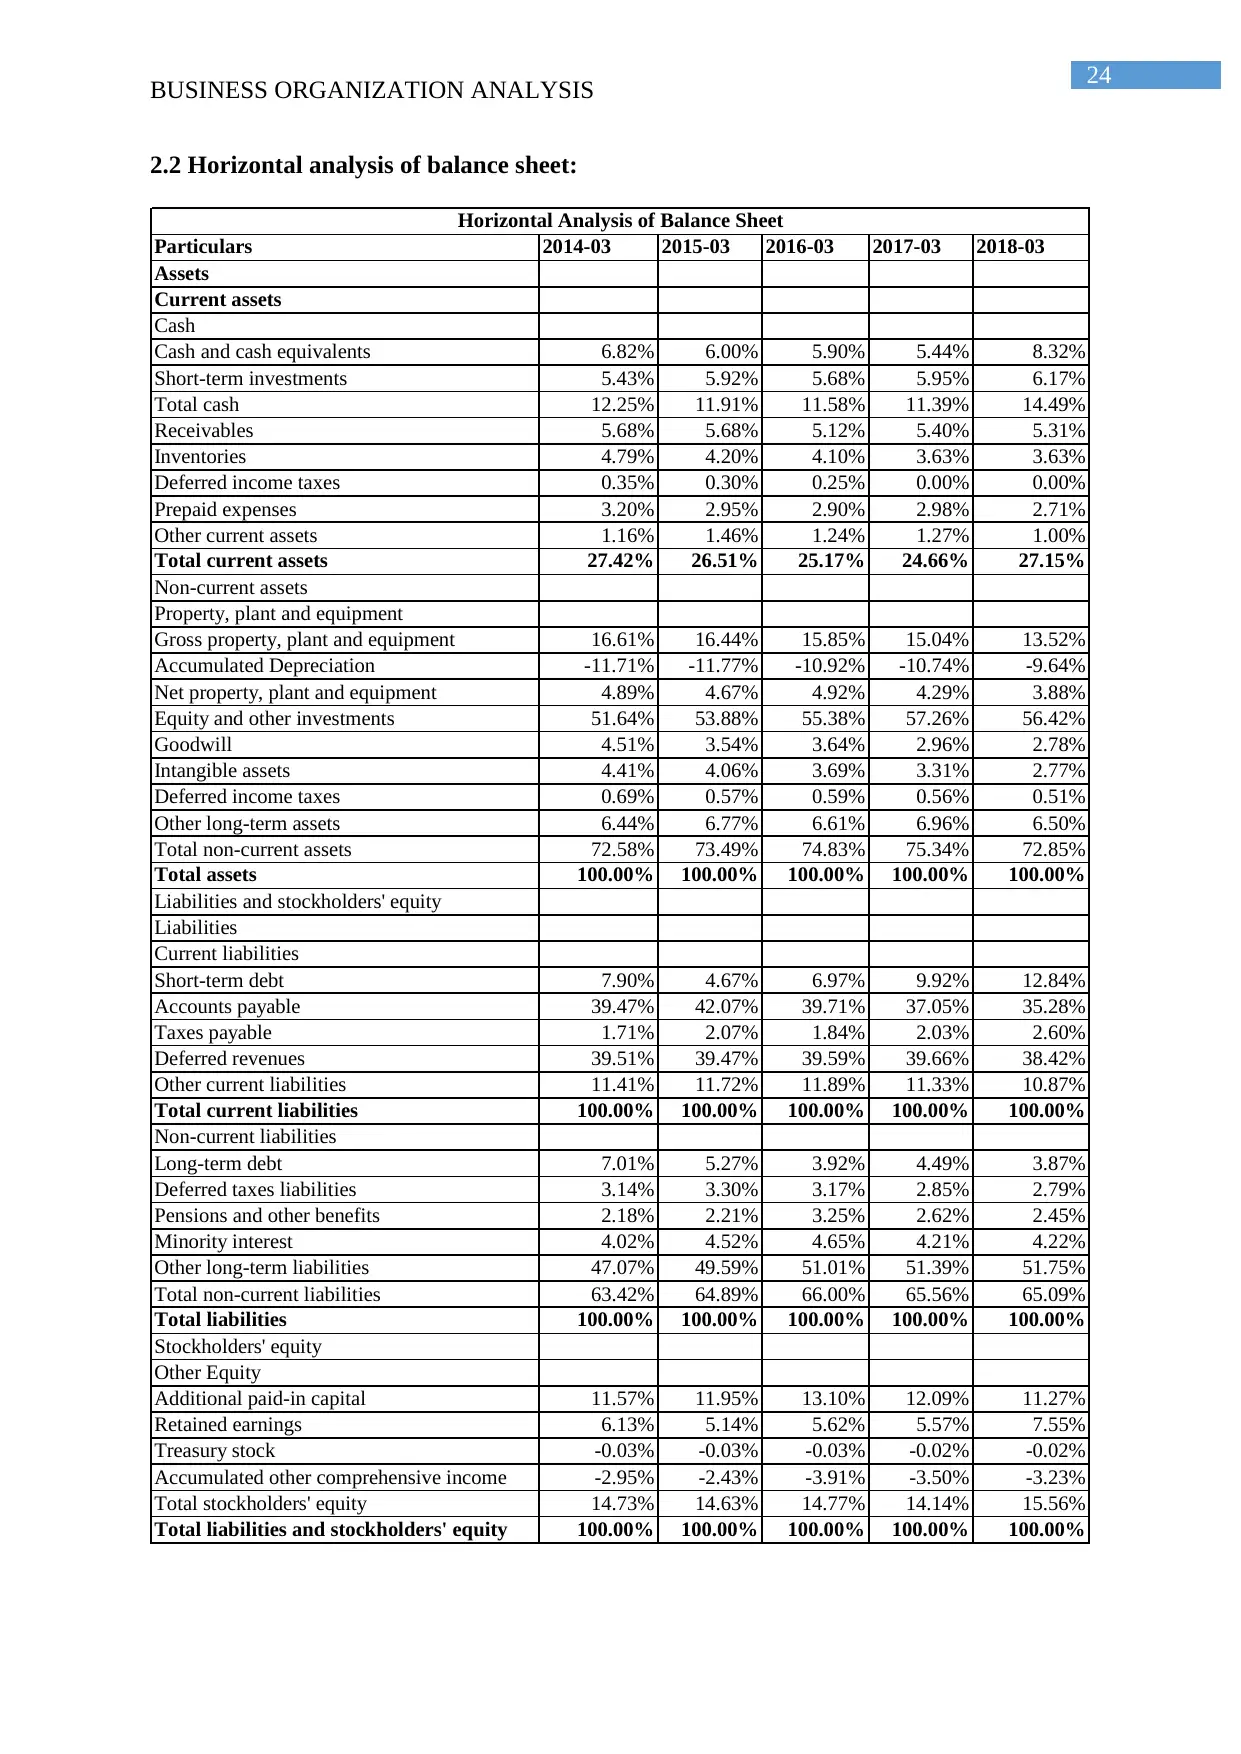
2.2 Horizontal analysis of balance sheet:
Particulars 2014-03 2015-03 2016-03 2017-03 2018-03
Assets
Current assets
Cash
Cash and cash equivalents 6.82% 6.00% 5.90% 5.44% 8.32%
Short-term investments 5.43% 5.92% 5.68% 5.95% 6.17%
Total cash 12.25% 11.91% 11.58% 11.39% 14.49%
Receivables 5.68% 5.68% 5.12% 5.40% 5.31%
Inventories 4.79% 4.20% 4.10% 3.63% 3.63%
Deferred income taxes 0.35% 0.30% 0.25% 0.00% 0.00%
Prepaid expenses 3.20% 2.95% 2.90% 2.98% 2.71%
Other current assets 1.16% 1.46% 1.24% 1.27% 1.00%
Total current assets 27.42% 26.51% 25.17% 24.66% 27.15%
Non-current assets
Property, plant and equipment
Gross property, plant and equipment 16.61% 16.44% 15.85% 15.04% 13.52%
Accumulated Depreciation -11.71% -11.77% -10.92% -10.74% -9.64%
Net property, plant and equipment 4.89% 4.67% 4.92% 4.29% 3.88%
Equity and other investments 51.64% 53.88% 55.38% 57.26% 56.42%
Goodwill 4.51% 3.54% 3.64% 2.96% 2.78%
Intangible assets 4.41% 4.06% 3.69% 3.31% 2.77%
Deferred income taxes 0.69% 0.57% 0.59% 0.56% 0.51%
Other long-term assets 6.44% 6.77% 6.61% 6.96% 6.50%
Total non-current assets 72.58% 73.49% 74.83% 75.34% 72.85%
Total assets 100.00% 100.00% 100.00% 100.00% 100.00%
Liabilities and stockholders' equity
Liabilities
Current liabilities
Short-term debt 7.90% 4.67% 6.97% 9.92% 12.84%
Accounts payable 39.47% 42.07% 39.71% 37.05% 35.28%
Taxes payable 1.71% 2.07% 1.84% 2.03% 2.60%
Deferred revenues 39.51% 39.47% 39.59% 39.66% 38.42%
Other current liabilities 11.41% 11.72% 11.89% 11.33% 10.87%
Total current liabilities 100.00% 100.00% 100.00% 100.00% 100.00%
Non-current liabilities
Long-term debt 7.01% 5.27% 3.92% 4.49% 3.87%
Deferred taxes liabilities 3.14% 3.30% 3.17% 2.85% 2.79%
Pensions and other benefits 2.18% 2.21% 3.25% 2.62% 2.45%
Minority interest 4.02% 4.52% 4.65% 4.21% 4.22%
Other long-term liabilities 47.07% 49.59% 51.01% 51.39% 51.75%
Total non-current liabilities 63.42% 64.89% 66.00% 65.56% 65.09%
Total liabilities 100.00% 100.00% 100.00% 100.00% 100.00%
Stockholders' equity
Other Equity
Additional paid-in capital 11.57% 11.95% 13.10% 12.09% 11.27%
Retained earnings 6.13% 5.14% 5.62% 5.57% 7.55%
Treasury stock -0.03% -0.03% -0.03% -0.02% -0.02%
Accumulated other comprehensive income -2.95% -2.43% -3.91% -3.50% -3.23%
Total stockholders' equity 14.73% 14.63% 14.77% 14.14% 15.56%
Total liabilities and stockholders' equity 100.00% 100.00% 100.00% 100.00% 100.00%
Horizontal Analysis of Balance Sheet
BUSINESS ORGANIZATION ANALYSIS
2.2 Horizontal analysis of balance sheet:
Particulars 2014-03 2015-03 2016-03 2017-03 2018-03
Assets
Current assets
Cash
Cash and cash equivalents 6.82% 6.00% 5.90% 5.44% 8.32%
Short-term investments 5.43% 5.92% 5.68% 5.95% 6.17%
Total cash 12.25% 11.91% 11.58% 11.39% 14.49%
Receivables 5.68% 5.68% 5.12% 5.40% 5.31%
Inventories 4.79% 4.20% 4.10% 3.63% 3.63%
Deferred income taxes 0.35% 0.30% 0.25% 0.00% 0.00%
Prepaid expenses 3.20% 2.95% 2.90% 2.98% 2.71%
Other current assets 1.16% 1.46% 1.24% 1.27% 1.00%
Total current assets 27.42% 26.51% 25.17% 24.66% 27.15%
Non-current assets
Property, plant and equipment
Gross property, plant and equipment 16.61% 16.44% 15.85% 15.04% 13.52%
Accumulated Depreciation -11.71% -11.77% -10.92% -10.74% -9.64%
Net property, plant and equipment 4.89% 4.67% 4.92% 4.29% 3.88%
Equity and other investments 51.64% 53.88% 55.38% 57.26% 56.42%
Goodwill 4.51% 3.54% 3.64% 2.96% 2.78%
Intangible assets 4.41% 4.06% 3.69% 3.31% 2.77%
Deferred income taxes 0.69% 0.57% 0.59% 0.56% 0.51%
Other long-term assets 6.44% 6.77% 6.61% 6.96% 6.50%
Total non-current assets 72.58% 73.49% 74.83% 75.34% 72.85%
Total assets 100.00% 100.00% 100.00% 100.00% 100.00%
Liabilities and stockholders' equity
Liabilities
Current liabilities
Short-term debt 7.90% 4.67% 6.97% 9.92% 12.84%
Accounts payable 39.47% 42.07% 39.71% 37.05% 35.28%
Taxes payable 1.71% 2.07% 1.84% 2.03% 2.60%
Deferred revenues 39.51% 39.47% 39.59% 39.66% 38.42%
Other current liabilities 11.41% 11.72% 11.89% 11.33% 10.87%
Total current liabilities 100.00% 100.00% 100.00% 100.00% 100.00%
Non-current liabilities
Long-term debt 7.01% 5.27% 3.92% 4.49% 3.87%
Deferred taxes liabilities 3.14% 3.30% 3.17% 2.85% 2.79%
Pensions and other benefits 2.18% 2.21% 3.25% 2.62% 2.45%
Minority interest 4.02% 4.52% 4.65% 4.21% 4.22%
Other long-term liabilities 47.07% 49.59% 51.01% 51.39% 51.75%
Total non-current liabilities 63.42% 64.89% 66.00% 65.56% 65.09%
Total liabilities 100.00% 100.00% 100.00% 100.00% 100.00%
Stockholders' equity
Other Equity
Additional paid-in capital 11.57% 11.95% 13.10% 12.09% 11.27%
Retained earnings 6.13% 5.14% 5.62% 5.57% 7.55%
Treasury stock -0.03% -0.03% -0.03% -0.02% -0.02%
Accumulated other comprehensive income -2.95% -2.43% -3.91% -3.50% -3.23%
Total stockholders' equity 14.73% 14.63% 14.77% 14.14% 15.56%
Total liabilities and stockholders' equity 100.00% 100.00% 100.00% 100.00% 100.00%
Horizontal Analysis of Balance Sheet
Paraphrase This Document
Need a fresh take? Get an instant paraphrase of this document with our AI Paraphraser
25
BUSINESS ORGANIZATION ANALYSIS
Table 11: Trend analysis of horizontal analysis of balance sheet
(Source: created by author)
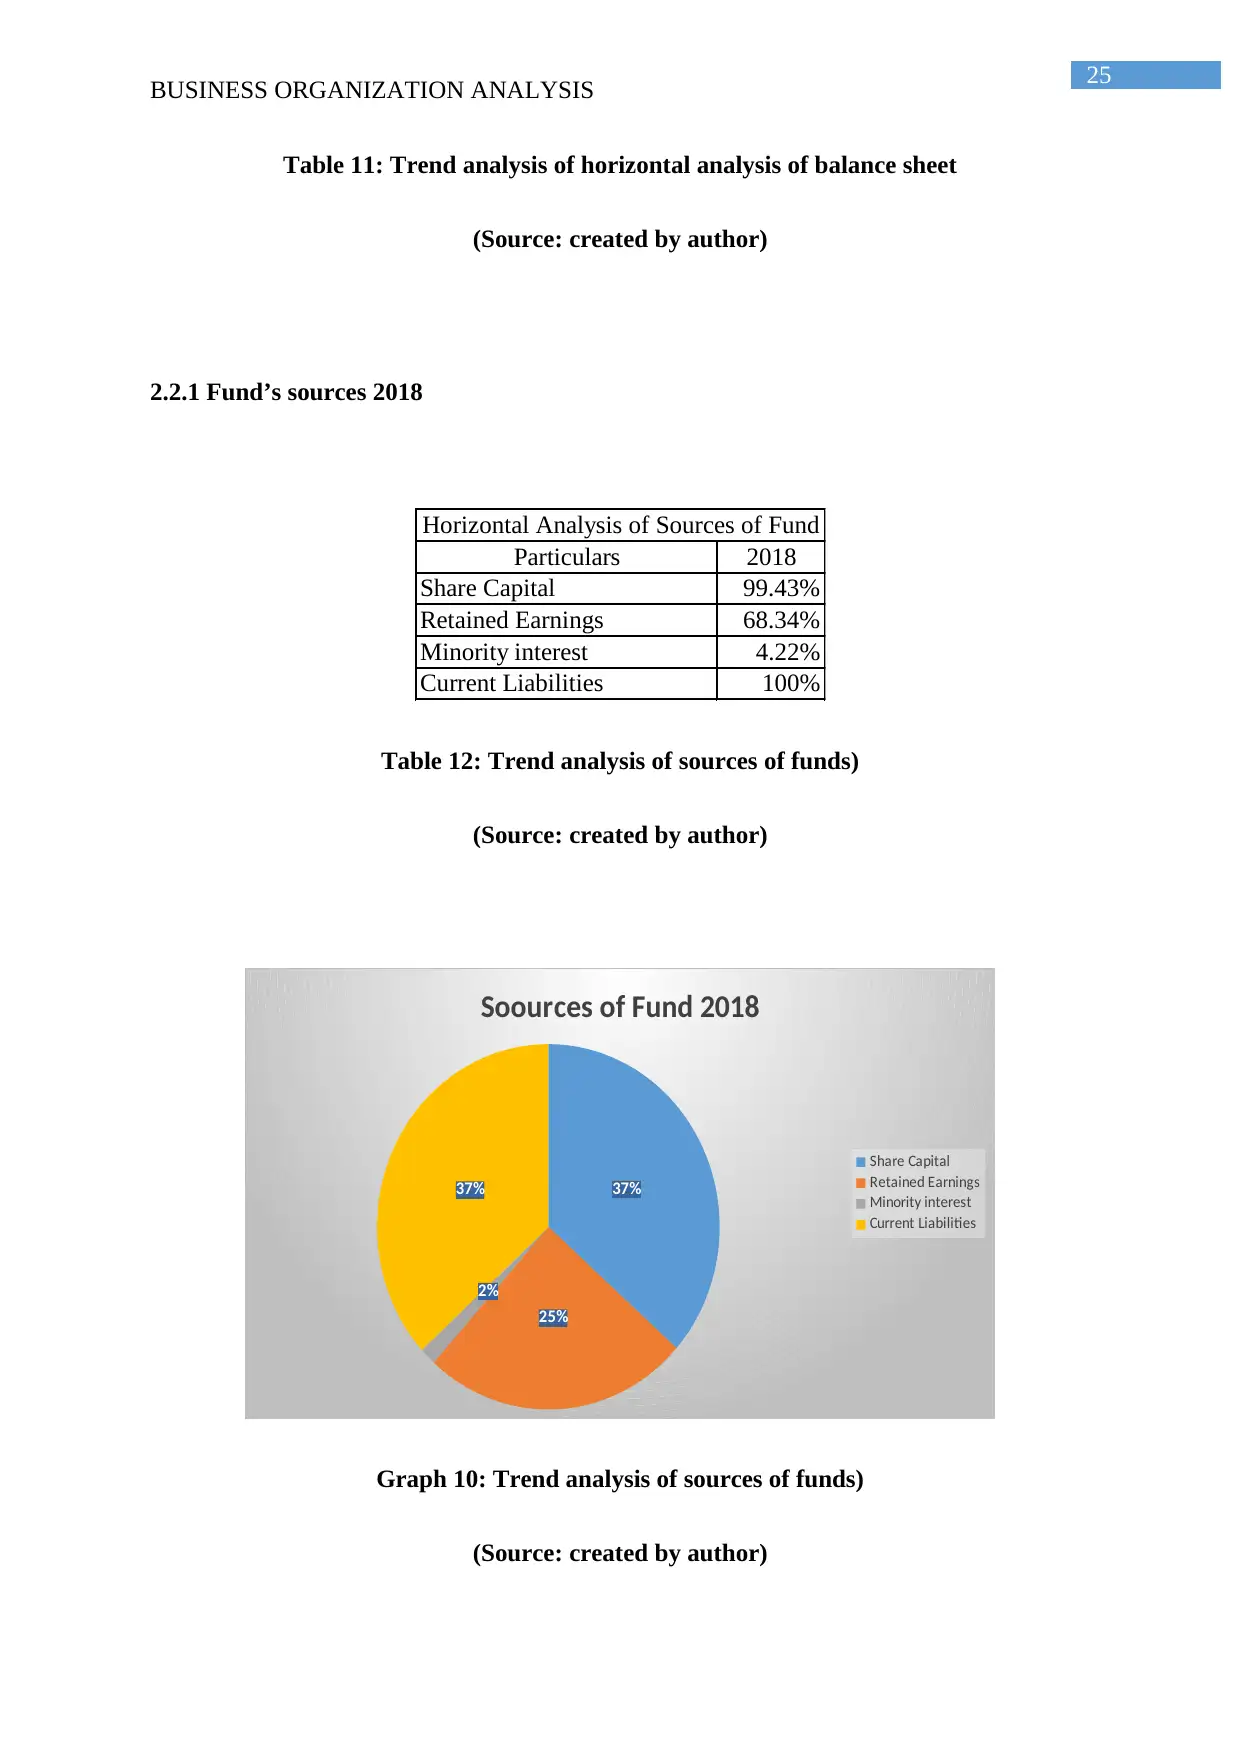
2.2.1 Fund’s sources 2018
Particulars 2018
Share Capital 99.43%
Retained Earnings 68.34%
Minority interest 4.22%
Current Liabilities 100%
Horizontal Analysis of Sources of Fund
Table 12: Trend analysis of sources of funds)
(Source: created by author)
37%
25%
2%
37%
Soources of Fund 2018
Share Capital
Retained Earnings
Minority interest
Current Liabilities
Graph 10: Trend analysis of sources of funds)
(Source: created by author)
BUSINESS ORGANIZATION ANALYSIS
Table 11: Trend analysis of horizontal analysis of balance sheet
(Source: created by author)
2.2.1 Fund’s sources 2018
Particulars 2018
Share Capital 99.43%
Retained Earnings 68.34%
Minority interest 4.22%
Current Liabilities 100%
Horizontal Analysis of Sources of Fund
Table 12: Trend analysis of sources of funds)
(Source: created by author)
37%
25%
2%
37%
Soources of Fund 2018
Share Capital
Retained Earnings
Minority interest
Current Liabilities
Graph 10: Trend analysis of sources of funds)
(Source: created by author)
26
BUSINESS ORGANIZATION ANALYSIS
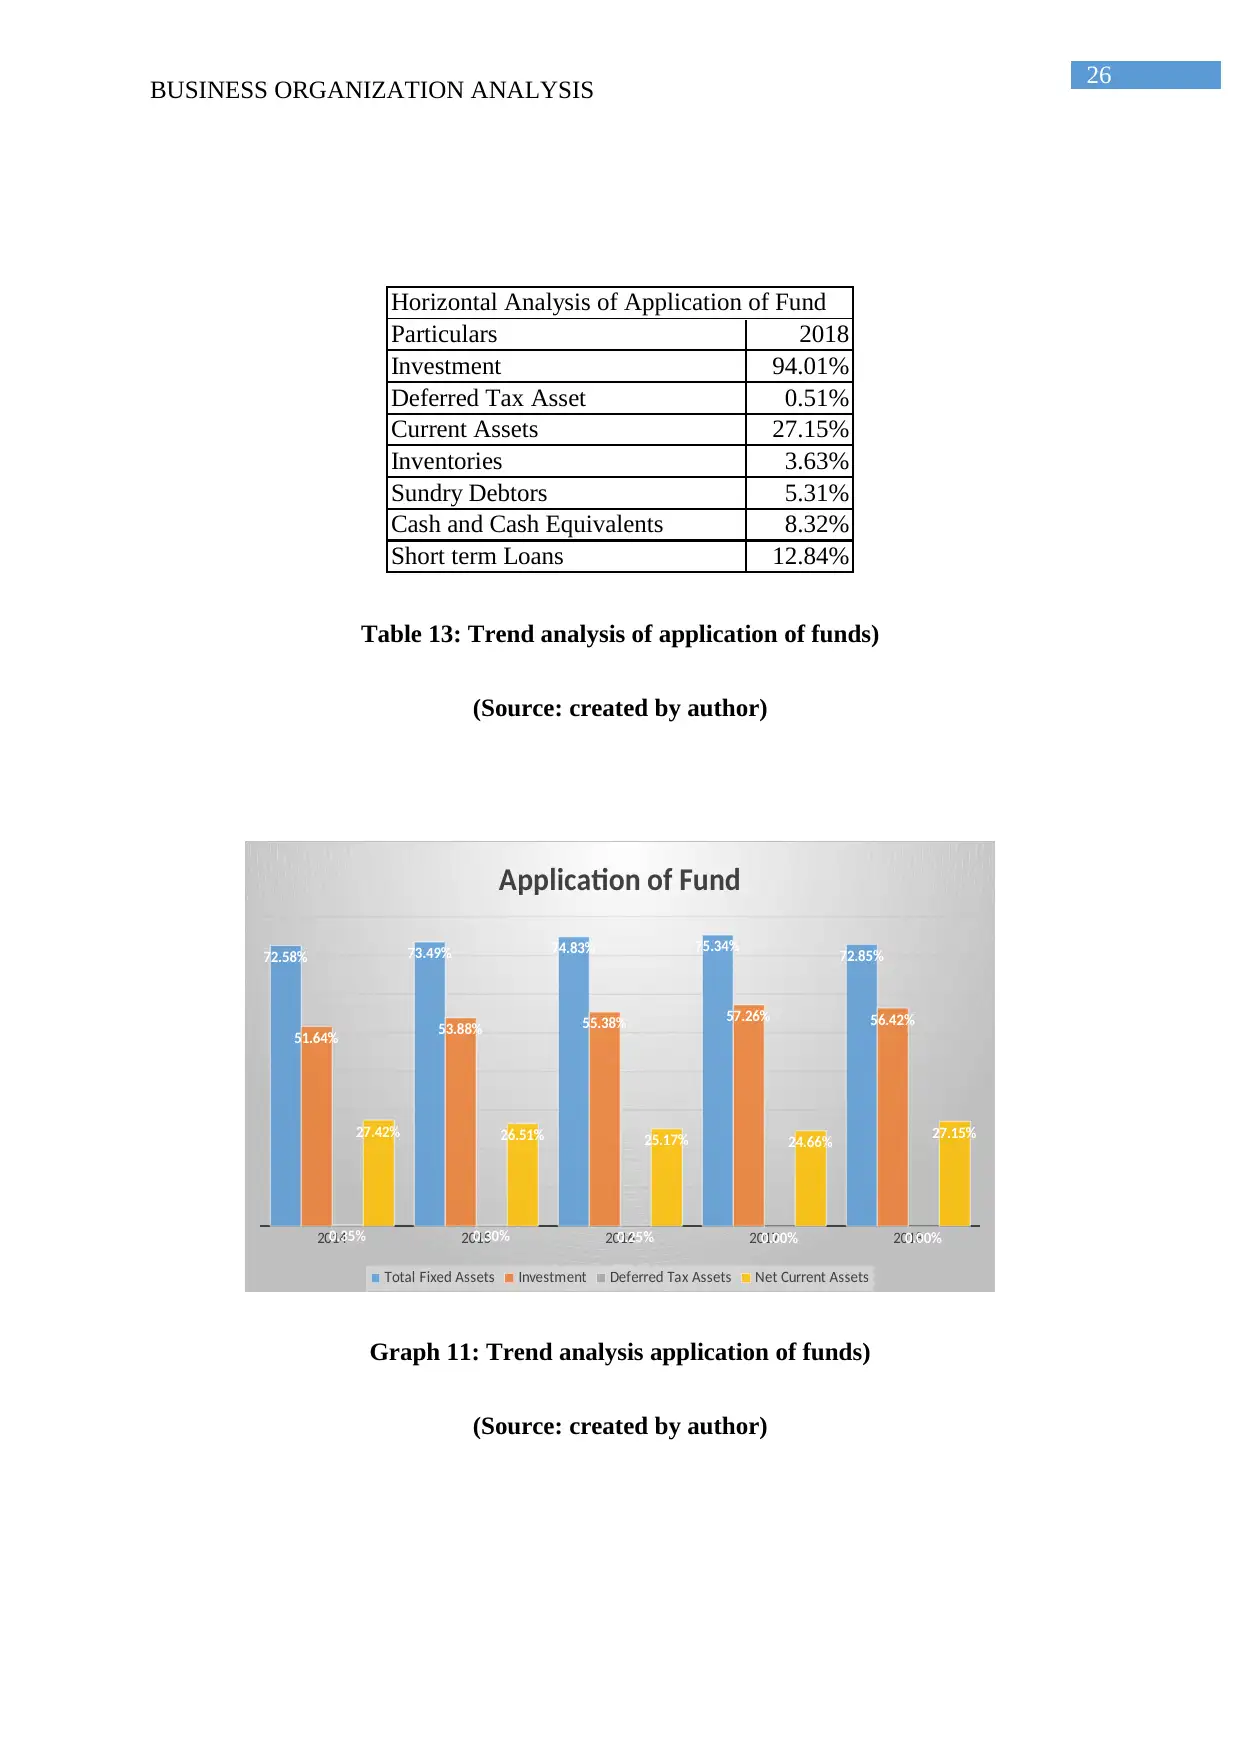
Horizontal Analysis of Application of Fund
Particulars 2018
Investment 94.01%
Deferred Tax Asset 0.51%
Current Assets 27.15%
Inventories 3.63%
Sundry Debtors 5.31%
Cash and Cash Equivalents 8.32%
Short term Loans 12.84%
Table 13: Trend analysis of application of funds)
(Source: created by author)
2014 2015 2016 2017 2018
72.58% 73.49% 74.83% 75.34% 72.85%
51.64% 53.88% 55.38% 57.26% 56.42%
0.35% 0.30% 0.25% 0.00% 0.00%
27.42% 26.51% 25.17% 24.66% 27.15%
Application of Fund
Total Fixed Assets Investment Deferred Tax Assets Net Current Assets
Graph 11: Trend analysis application of funds)
(Source: created by author)
BUSINESS ORGANIZATION ANALYSIS
Horizontal Analysis of Application of Fund
Particulars 2018
Investment 94.01%
Deferred Tax Asset 0.51%
Current Assets 27.15%
Inventories 3.63%
Sundry Debtors 5.31%
Cash and Cash Equivalents 8.32%
Short term Loans 12.84%
Table 13: Trend analysis of application of funds)
(Source: created by author)
2014 2015 2016 2017 2018
72.58% 73.49% 74.83% 75.34% 72.85%
51.64% 53.88% 55.38% 57.26% 56.42%
0.35% 0.30% 0.25% 0.00% 0.00%
27.42% 26.51% 25.17% 24.66% 27.15%
Application of Fund
Total Fixed Assets Investment Deferred Tax Assets Net Current Assets
Graph 11: Trend analysis application of funds)
(Source: created by author)
27
BUSINESS ORGANIZATION ANALYSIS
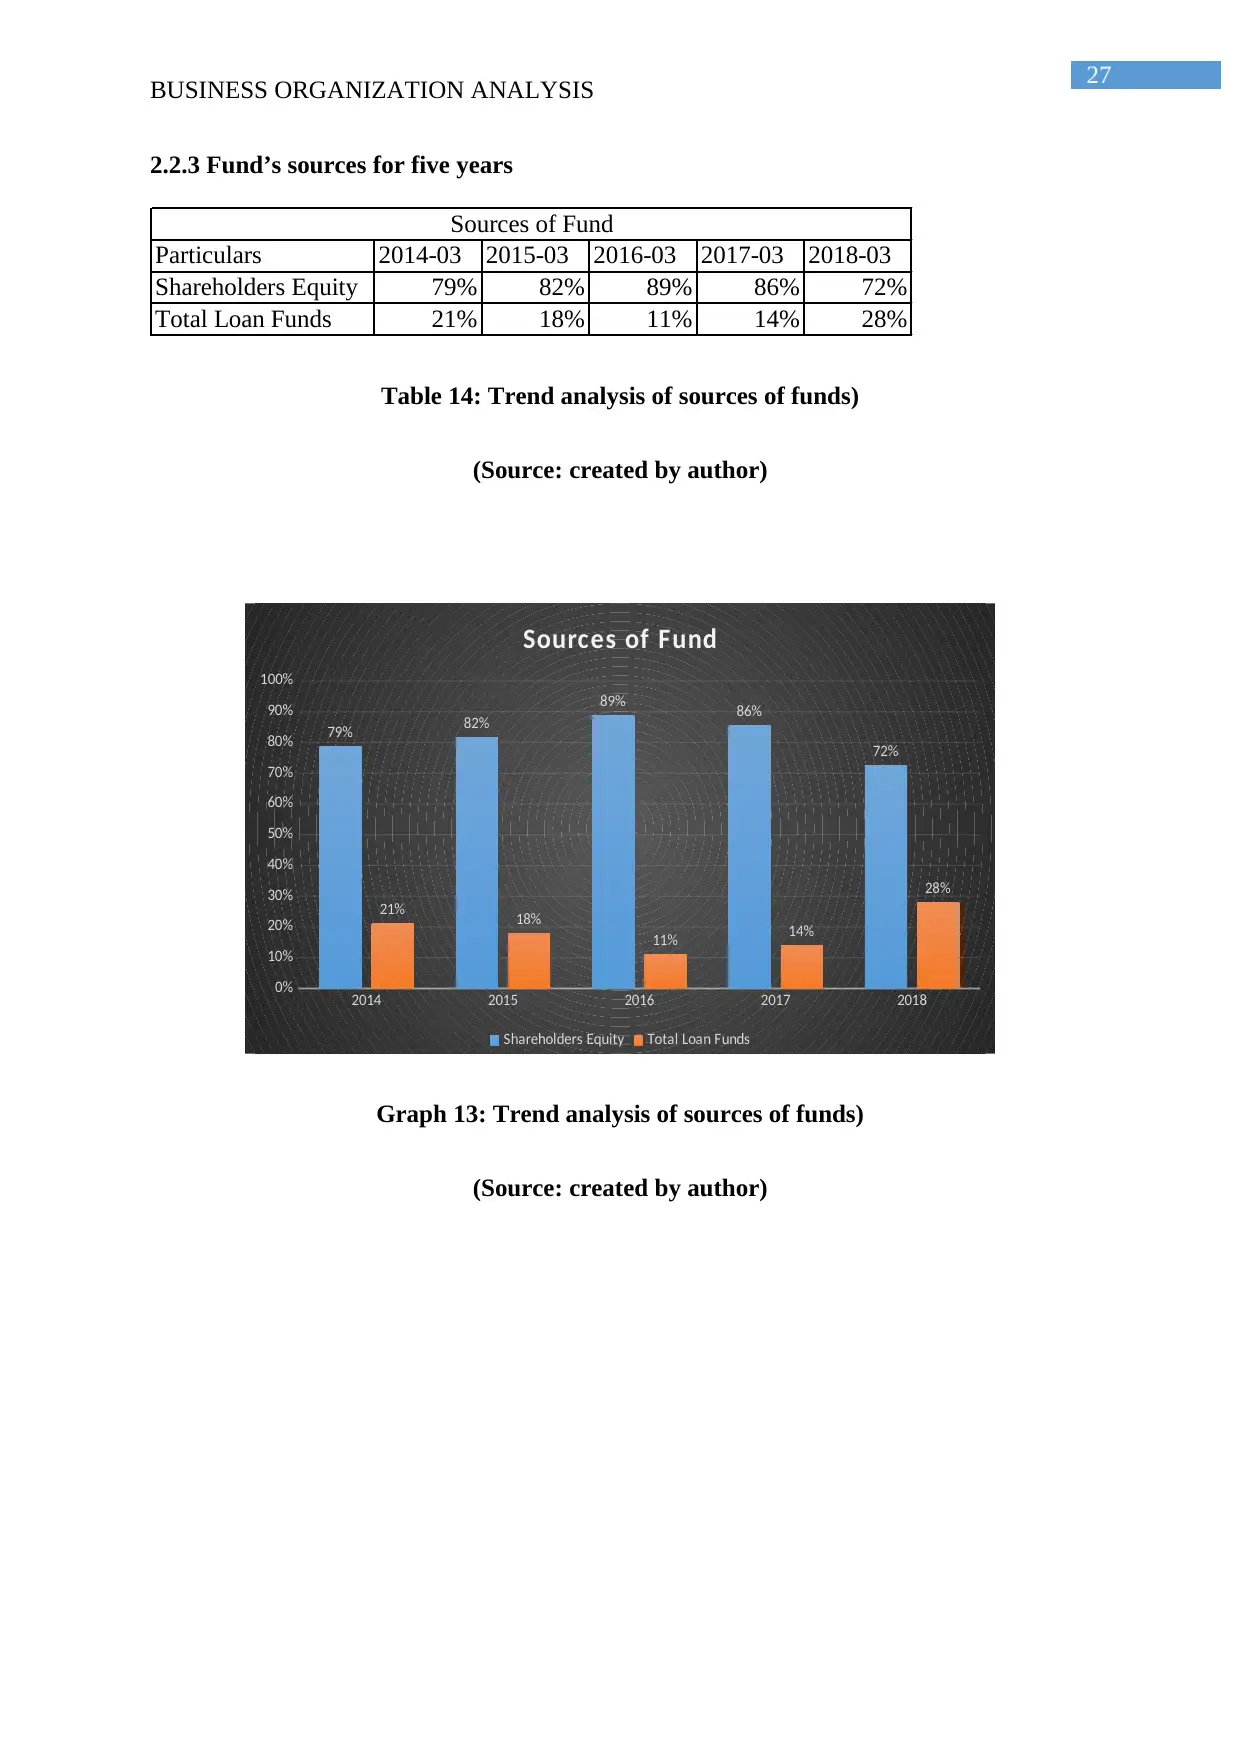
2.2.3 Fund’s sources for five years
Particulars 2014-03 2015-03 2016-03 2017-03 2018-03
Shareholders Equity 79% 82% 89% 86% 72%
Total Loan Funds 21% 18% 11% 14% 28%
Sources of Fund
Table 14: Trend analysis of sources of funds)
(Source: created by author)
2014 2015 2016 2017 2018
0%
10%
20%
30%
40%
50%
60%
70%
80%
90%
100%
79% 82%
89% 86%
72%
21% 18%
11% 14%
28%
Sources of Fund
Shareholders Equity Total Loan Funds
Graph 13: Trend analysis of sources of funds)
(Source: created by author)
BUSINESS ORGANIZATION ANALYSIS
2.2.3 Fund’s sources for five years
Particulars 2014-03 2015-03 2016-03 2017-03 2018-03
Shareholders Equity 79% 82% 89% 86% 72%
Total Loan Funds 21% 18% 11% 14% 28%
Sources of Fund
Table 14: Trend analysis of sources of funds)
(Source: created by author)
2014 2015 2016 2017 2018
0%
10%
20%
30%
40%
50%
60%
70%
80%
90%
100%
79% 82%
89% 86%
72%
21% 18%
11% 14%
28%
Sources of Fund
Shareholders Equity Total Loan Funds
Graph 13: Trend analysis of sources of funds)
(Source: created by author)
Secure Best Marks with AI Grader
Need help grading? Try our AI Grader for instant feedback on your assignments.
28
BUSINESS ORGANIZATION ANALYSIS
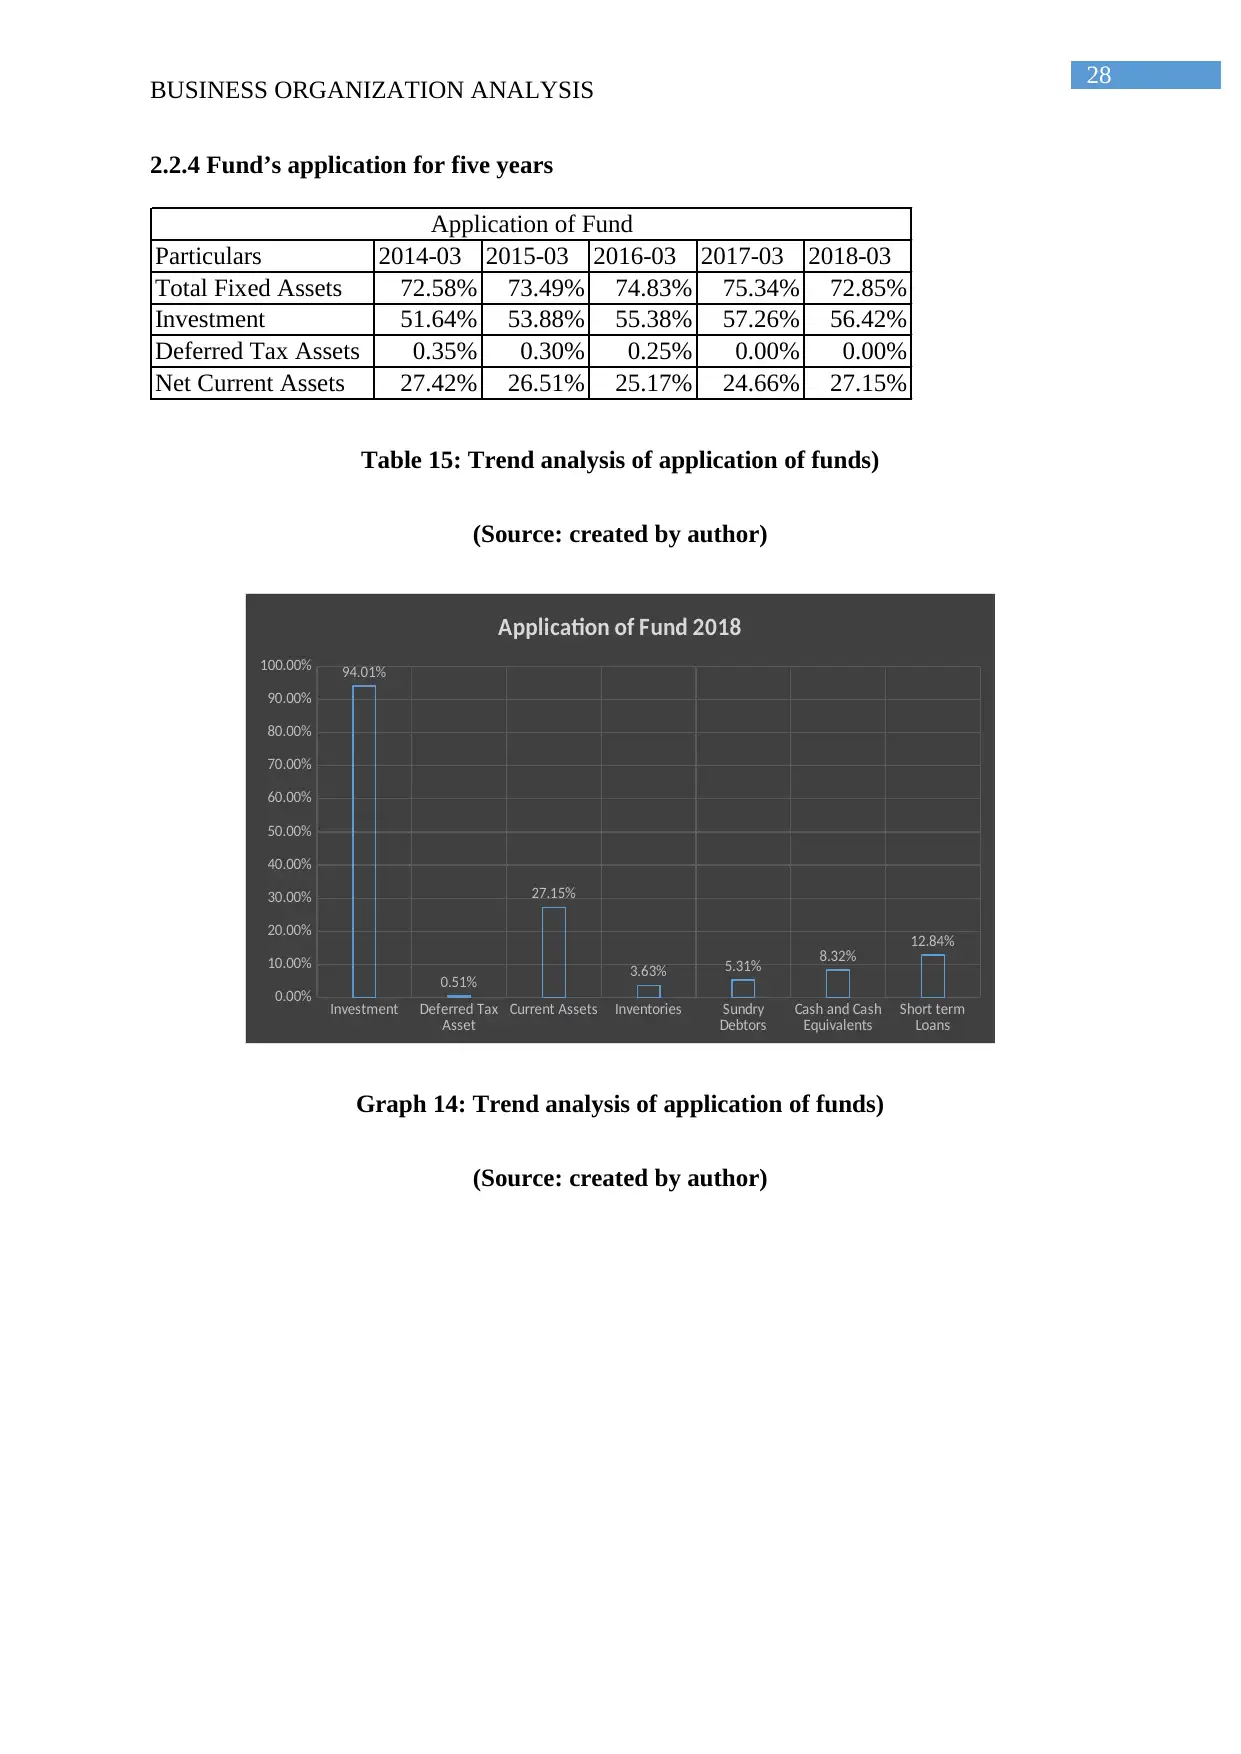
2.2.4 Fund’s application for five years
Particulars 2014-03 2015-03 2016-03 2017-03 2018-03
Total Fixed Assets 72.58% 73.49% 74.83% 75.34% 72.85%
Investment 51.64% 53.88% 55.38% 57.26% 56.42%
Deferred Tax Assets 0.35% 0.30% 0.25% 0.00% 0.00%
Net Current Assets 27.42% 26.51% 25.17% 24.66% 27.15%
Application of Fund
Table 15: Trend analysis of application of funds)
(Source: created by author)
Investment Deferred Tax
Asset
Current Assets Inventories Sundry
Debtors
Cash and Cash
Equivalents
Short term
Loans
0.00%
10.00%
20.00%
30.00%
40.00%
50.00%
60.00%
70.00%
80.00%
90.00%
100.00% 94.01%
0.51%
27.15%
3.63% 5.31% 8.32% 12.84%
Application of Fund 2018
Graph 14: Trend analysis of application of funds)
(Source: created by author)
BUSINESS ORGANIZATION ANALYSIS
2.2.4 Fund’s application for five years
Particulars 2014-03 2015-03 2016-03 2017-03 2018-03
Total Fixed Assets 72.58% 73.49% 74.83% 75.34% 72.85%
Investment 51.64% 53.88% 55.38% 57.26% 56.42%
Deferred Tax Assets 0.35% 0.30% 0.25% 0.00% 0.00%
Net Current Assets 27.42% 26.51% 25.17% 24.66% 27.15%
Application of Fund
Table 15: Trend analysis of application of funds)
(Source: created by author)
Investment Deferred Tax
Asset
Current Assets Inventories Sundry
Debtors
Cash and Cash
Equivalents
Short term
Loans
0.00%
10.00%
20.00%
30.00%
40.00%
50.00%
60.00%
70.00%
80.00%
90.00%
100.00% 94.01%
0.51%
27.15%
3.63% 5.31% 8.32% 12.84%
Application of Fund 2018
Graph 14: Trend analysis of application of funds)
(Source: created by author)
29
BUSINESS ORGANIZATION ANALYSIS
3. Analyzing the P& L account
3.1 Trend analysis of P & L
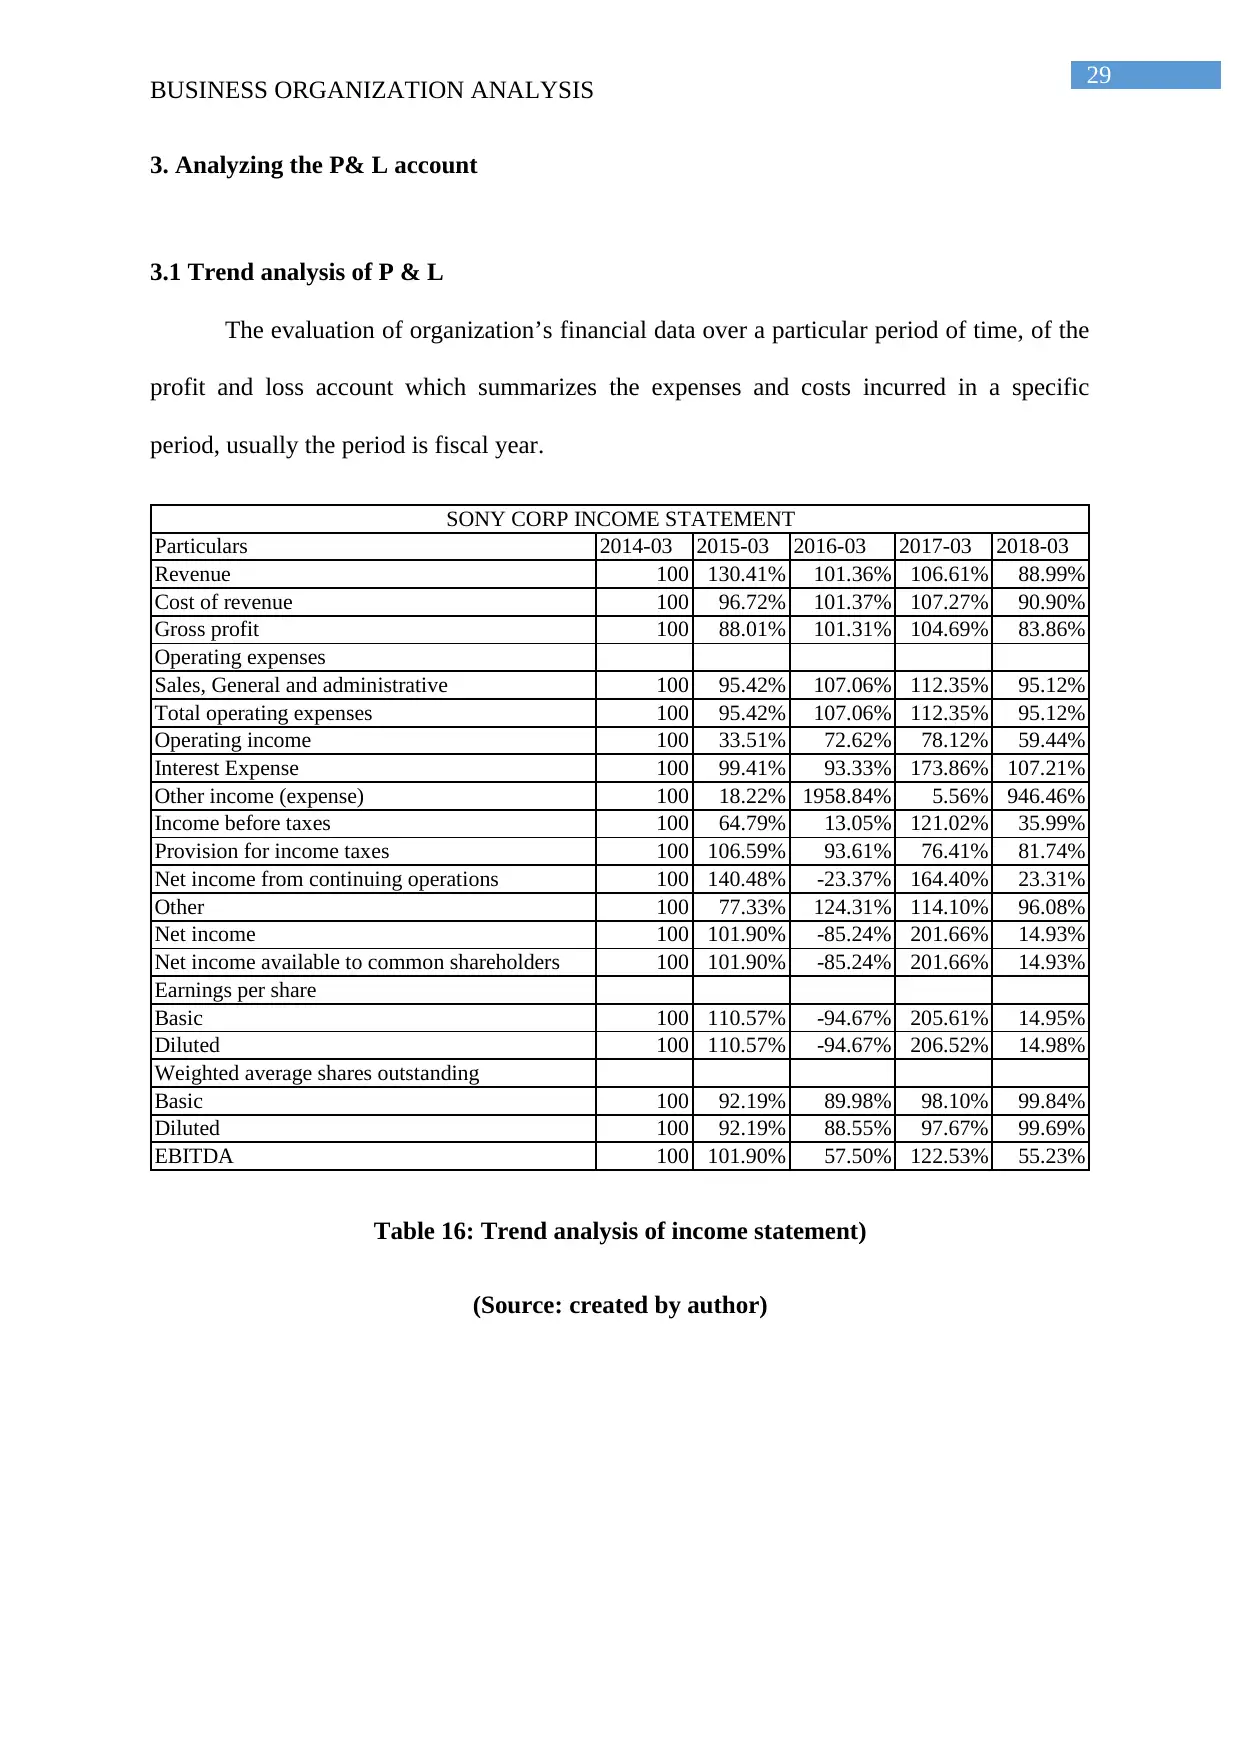
The evaluation of organization’s financial data over a particular period of time, of the
profit and loss account which summarizes the expenses and costs incurred in a specific
period, usually the period is fiscal year.
Particulars 2014-03 2015-03 2016-03 2017-03 2018-03
Revenue 100 130.41% 101.36% 106.61% 88.99%
Cost of revenue 100 96.72% 101.37% 107.27% 90.90%
Gross profit 100 88.01% 101.31% 104.69% 83.86%
Operating expenses
Sales, General and administrative 100 95.42% 107.06% 112.35% 95.12%
Total operating expenses 100 95.42% 107.06% 112.35% 95.12%
Operating income 100 33.51% 72.62% 78.12% 59.44%
Interest Expense 100 99.41% 93.33% 173.86% 107.21%
Other income (expense) 100 18.22% 1958.84% 5.56% 946.46%
Income before taxes 100 64.79% 13.05% 121.02% 35.99%
Provision for income taxes 100 106.59% 93.61% 76.41% 81.74%
Net income from continuing operations 100 140.48% -23.37% 164.40% 23.31%
Other 100 77.33% 124.31% 114.10% 96.08%
Net income 100 101.90% -85.24% 201.66% 14.93%
Net income available to common shareholders 100 101.90% -85.24% 201.66% 14.93%
Earnings per share
Basic 100 110.57% -94.67% 205.61% 14.95%
Diluted 100 110.57% -94.67% 206.52% 14.98%
Weighted average shares outstanding
Basic 100 92.19% 89.98% 98.10% 99.84%
Diluted 100 92.19% 88.55% 97.67% 99.69%
EBITDA 100 101.90% 57.50% 122.53% 55.23%
SONY CORP INCOME STATEMENT
Table 16: Trend analysis of income statement)
(Source: created by author)
BUSINESS ORGANIZATION ANALYSIS
3. Analyzing the P& L account
3.1 Trend analysis of P & L
The evaluation of organization’s financial data over a particular period of time, of the
profit and loss account which summarizes the expenses and costs incurred in a specific
period, usually the period is fiscal year.
Particulars 2014-03 2015-03 2016-03 2017-03 2018-03
Revenue 100 130.41% 101.36% 106.61% 88.99%
Cost of revenue 100 96.72% 101.37% 107.27% 90.90%
Gross profit 100 88.01% 101.31% 104.69% 83.86%
Operating expenses
Sales, General and administrative 100 95.42% 107.06% 112.35% 95.12%
Total operating expenses 100 95.42% 107.06% 112.35% 95.12%
Operating income 100 33.51% 72.62% 78.12% 59.44%
Interest Expense 100 99.41% 93.33% 173.86% 107.21%
Other income (expense) 100 18.22% 1958.84% 5.56% 946.46%
Income before taxes 100 64.79% 13.05% 121.02% 35.99%
Provision for income taxes 100 106.59% 93.61% 76.41% 81.74%
Net income from continuing operations 100 140.48% -23.37% 164.40% 23.31%
Other 100 77.33% 124.31% 114.10% 96.08%
Net income 100 101.90% -85.24% 201.66% 14.93%
Net income available to common shareholders 100 101.90% -85.24% 201.66% 14.93%
Earnings per share
Basic 100 110.57% -94.67% 205.61% 14.95%
Diluted 100 110.57% -94.67% 206.52% 14.98%
Weighted average shares outstanding
Basic 100 92.19% 89.98% 98.10% 99.84%
Diluted 100 92.19% 88.55% 97.67% 99.69%
EBITDA 100 101.90% 57.50% 122.53% 55.23%
SONY CORP INCOME STATEMENT
Table 16: Trend analysis of income statement)
(Source: created by author)
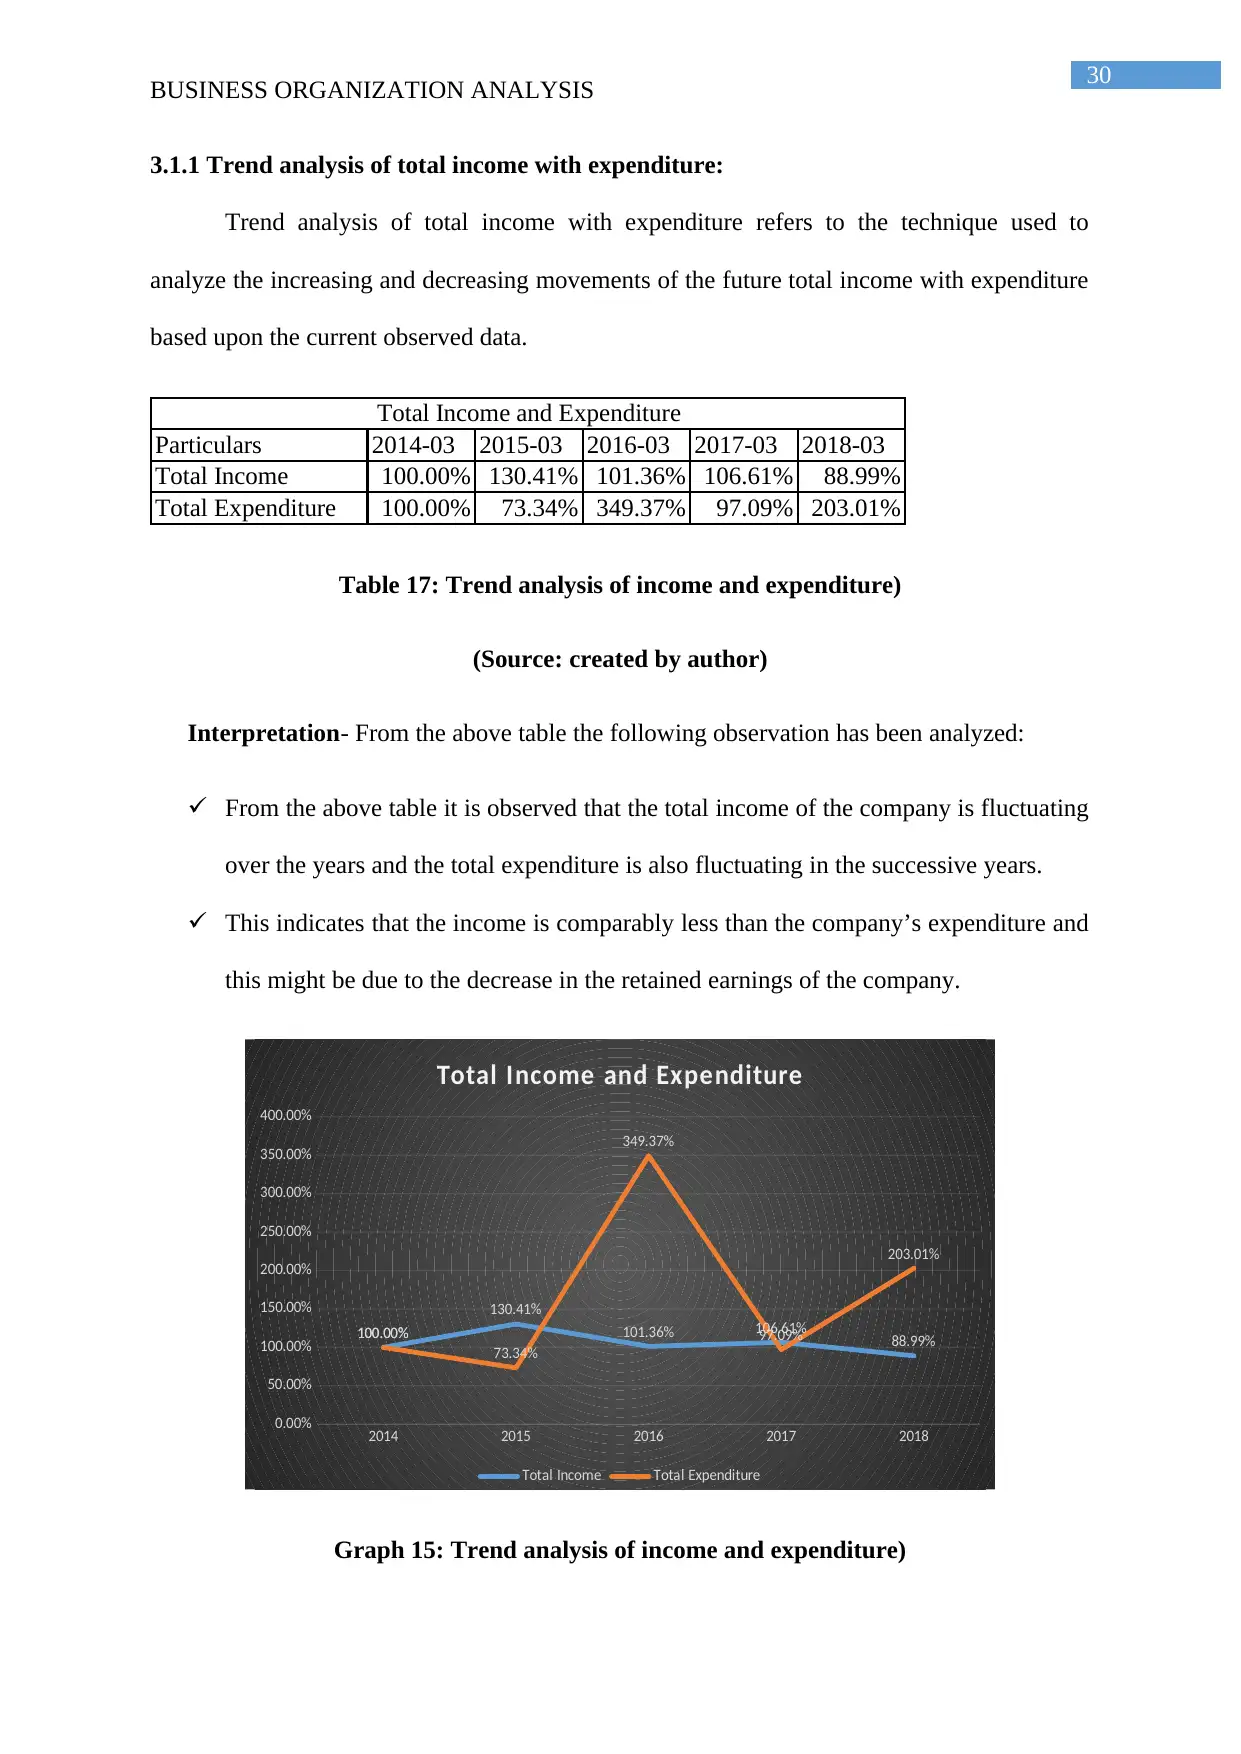
30
BUSINESS ORGANIZATION ANALYSIS
3.1.1 Trend analysis of total income with expenditure:
Trend analysis of total income with expenditure refers to the technique used to
analyze the increasing and decreasing movements of the future total income with expenditure
based upon the current observed data.
Particulars 2014-03 2015-03 2016-03 2017-03 2018-03
Total Income 100.00% 130.41% 101.36% 106.61% 88.99%
Total Expenditure 100.00% 73.34% 349.37% 97.09% 203.01%
Total Income and Expenditure
Table 17: Trend analysis of income and expenditure)
(Source: created by author)
Interpretation- From the above table the following observation has been analyzed:
From the above table it is observed that the total income of the company is fluctuating
over the years and the total expenditure is also fluctuating in the successive years.
This indicates that the income is comparably less than the company’s expenditure and
this might be due to the decrease in the retained earnings of the company.
2014 2015 2016 2017 2018
0.00%
50.00%
100.00%
150.00%
200.00%
250.00%
300.00%
350.00%
400.00%
100.00%
130.41%
101.36% 106.61% 88.99%
100.00%
73.34%
349.37%
97.09%
203.01%
Total Income and Expenditure
Total Income Total Expenditure
Graph 15: Trend analysis of income and expenditure)
Paraphrase This Document
Need a fresh take? Get an instant paraphrase of this document with our AI Paraphraser
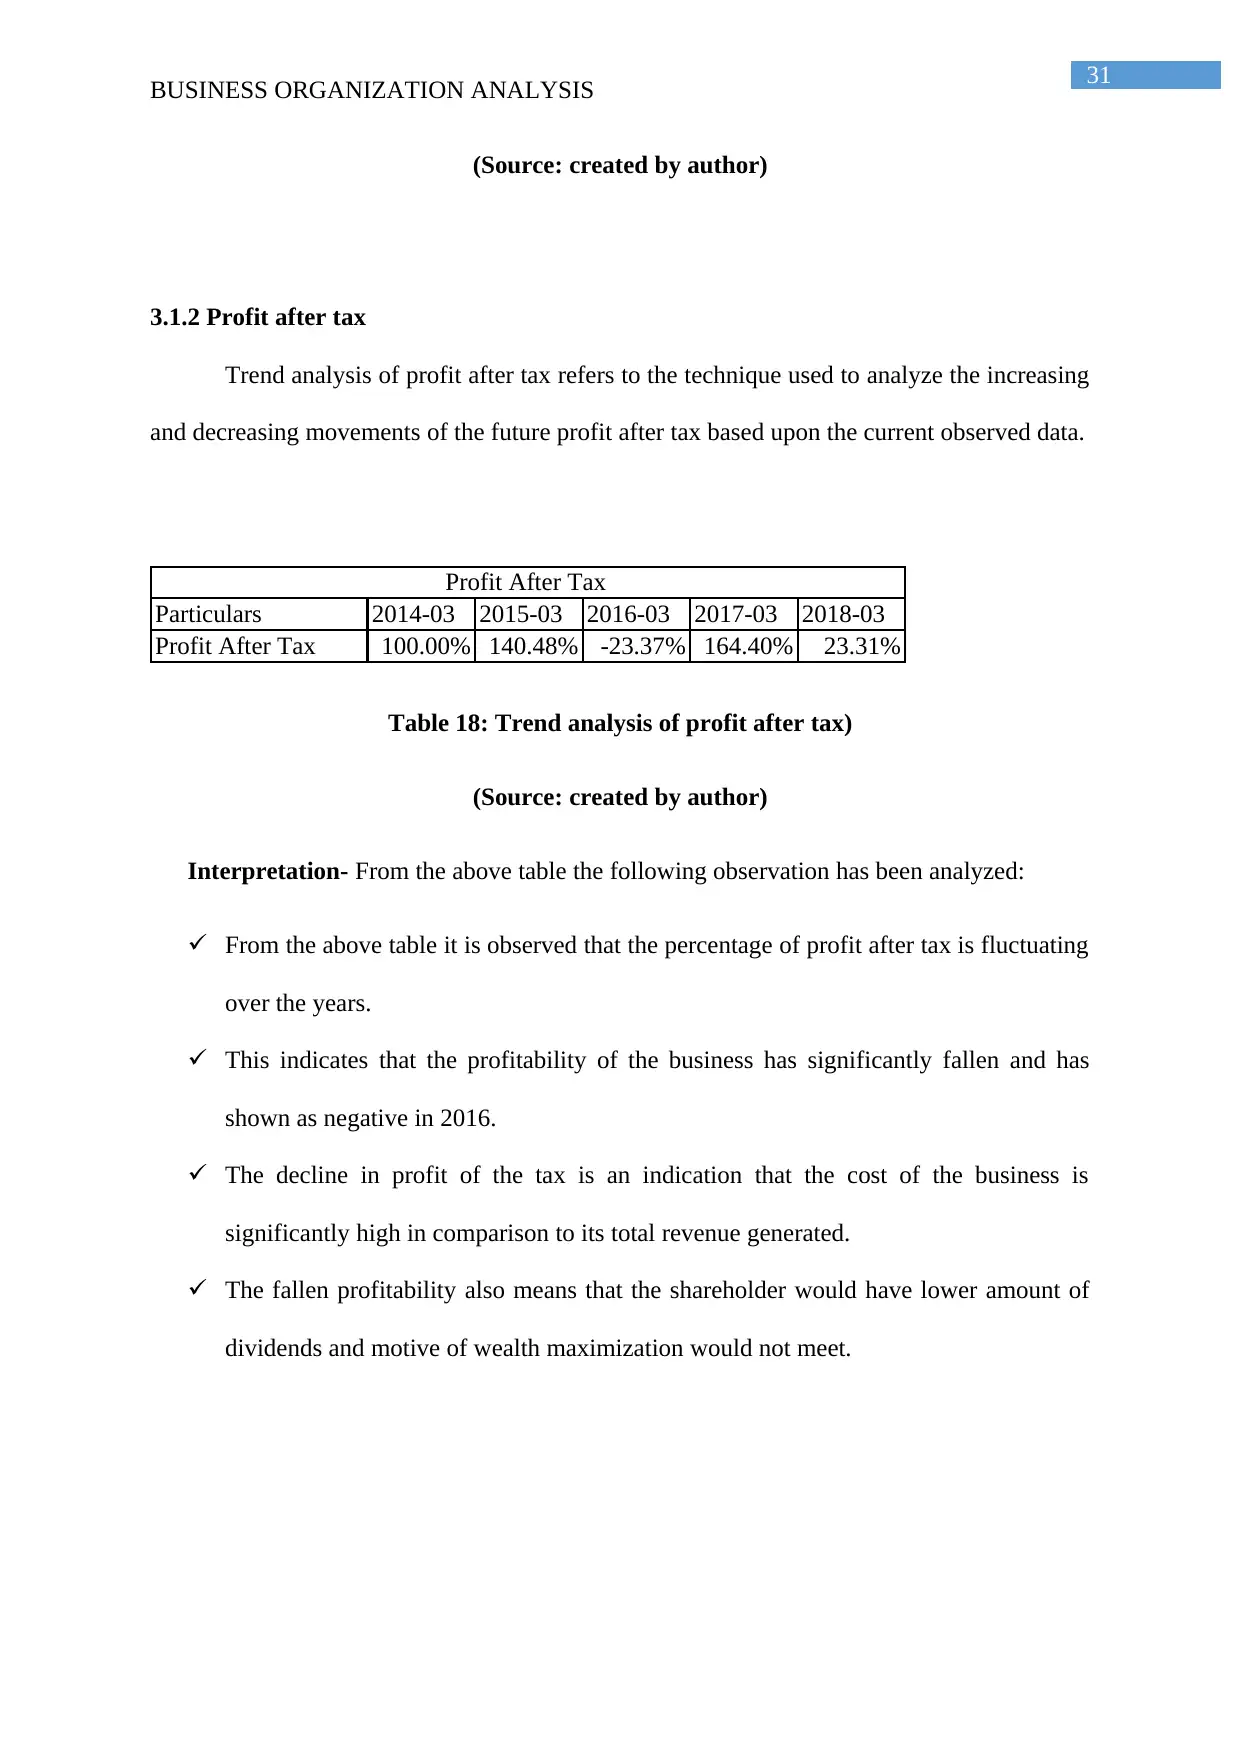
31
BUSINESS ORGANIZATION ANALYSIS
(Source: created by author)
3.1.2 Profit after tax
Trend analysis of profit after tax refers to the technique used to analyze the increasing
and decreasing movements of the future profit after tax based upon the current observed data.
Particulars 2014-03 2015-03 2016-03 2017-03 2018-03
Profit After Tax 100.00% 140.48% -23.37% 164.40% 23.31%
Profit After Tax
Table 18: Trend analysis of profit after tax)
(Source: created by author)
Interpretation- From the above table the following observation has been analyzed:
From the above table it is observed that the percentage of profit after tax is fluctuating
over the years.
This indicates that the profitability of the business has significantly fallen and has
shown as negative in 2016.
The decline in profit of the tax is an indication that the cost of the business is
significantly high in comparison to its total revenue generated.
The fallen profitability also means that the shareholder would have lower amount of
dividends and motive of wealth maximization would not meet.
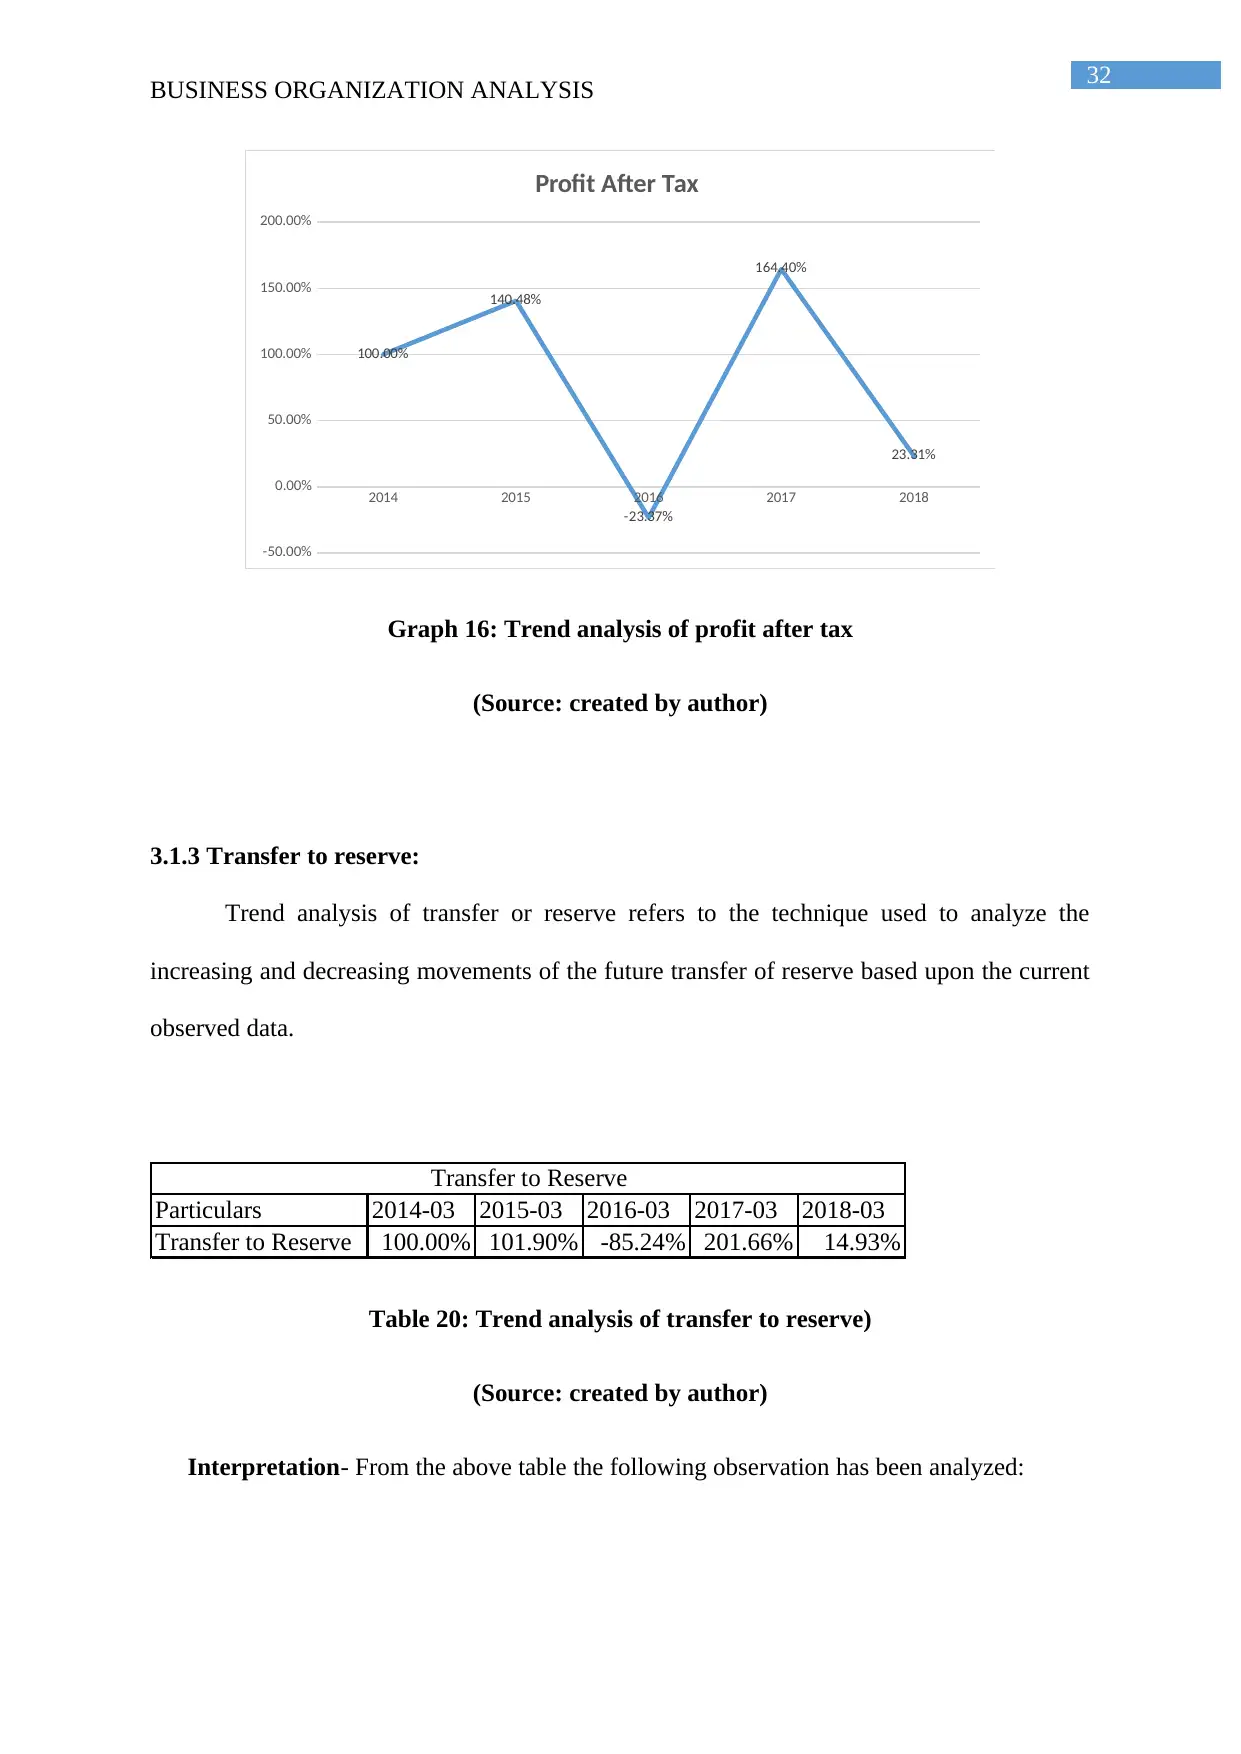
32
BUSINESS ORGANIZATION ANALYSIS
2014 2015 2016 2017 2018
-50.00%
0.00%
50.00%
100.00%
150.00%
200.00%
100.00%
140.48%
-23.37%
164.40%
23.31%
Profit After Tax
Graph 16: Trend analysis of profit after tax
(Source: created by author)
3.1.3 Transfer to reserve:
Trend analysis of transfer or reserve refers to the technique used to analyze the
increasing and decreasing movements of the future transfer of reserve based upon the current
observed data.
Particulars 2014-03 2015-03 2016-03 2017-03 2018-03
Transfer to Reserve 100.00% 101.90% -85.24% 201.66% 14.93%
Transfer to Reserve
Table 20: Trend analysis of transfer to reserve)
(Source: created by author)
Interpretation- From the above table the following observation has been analyzed:
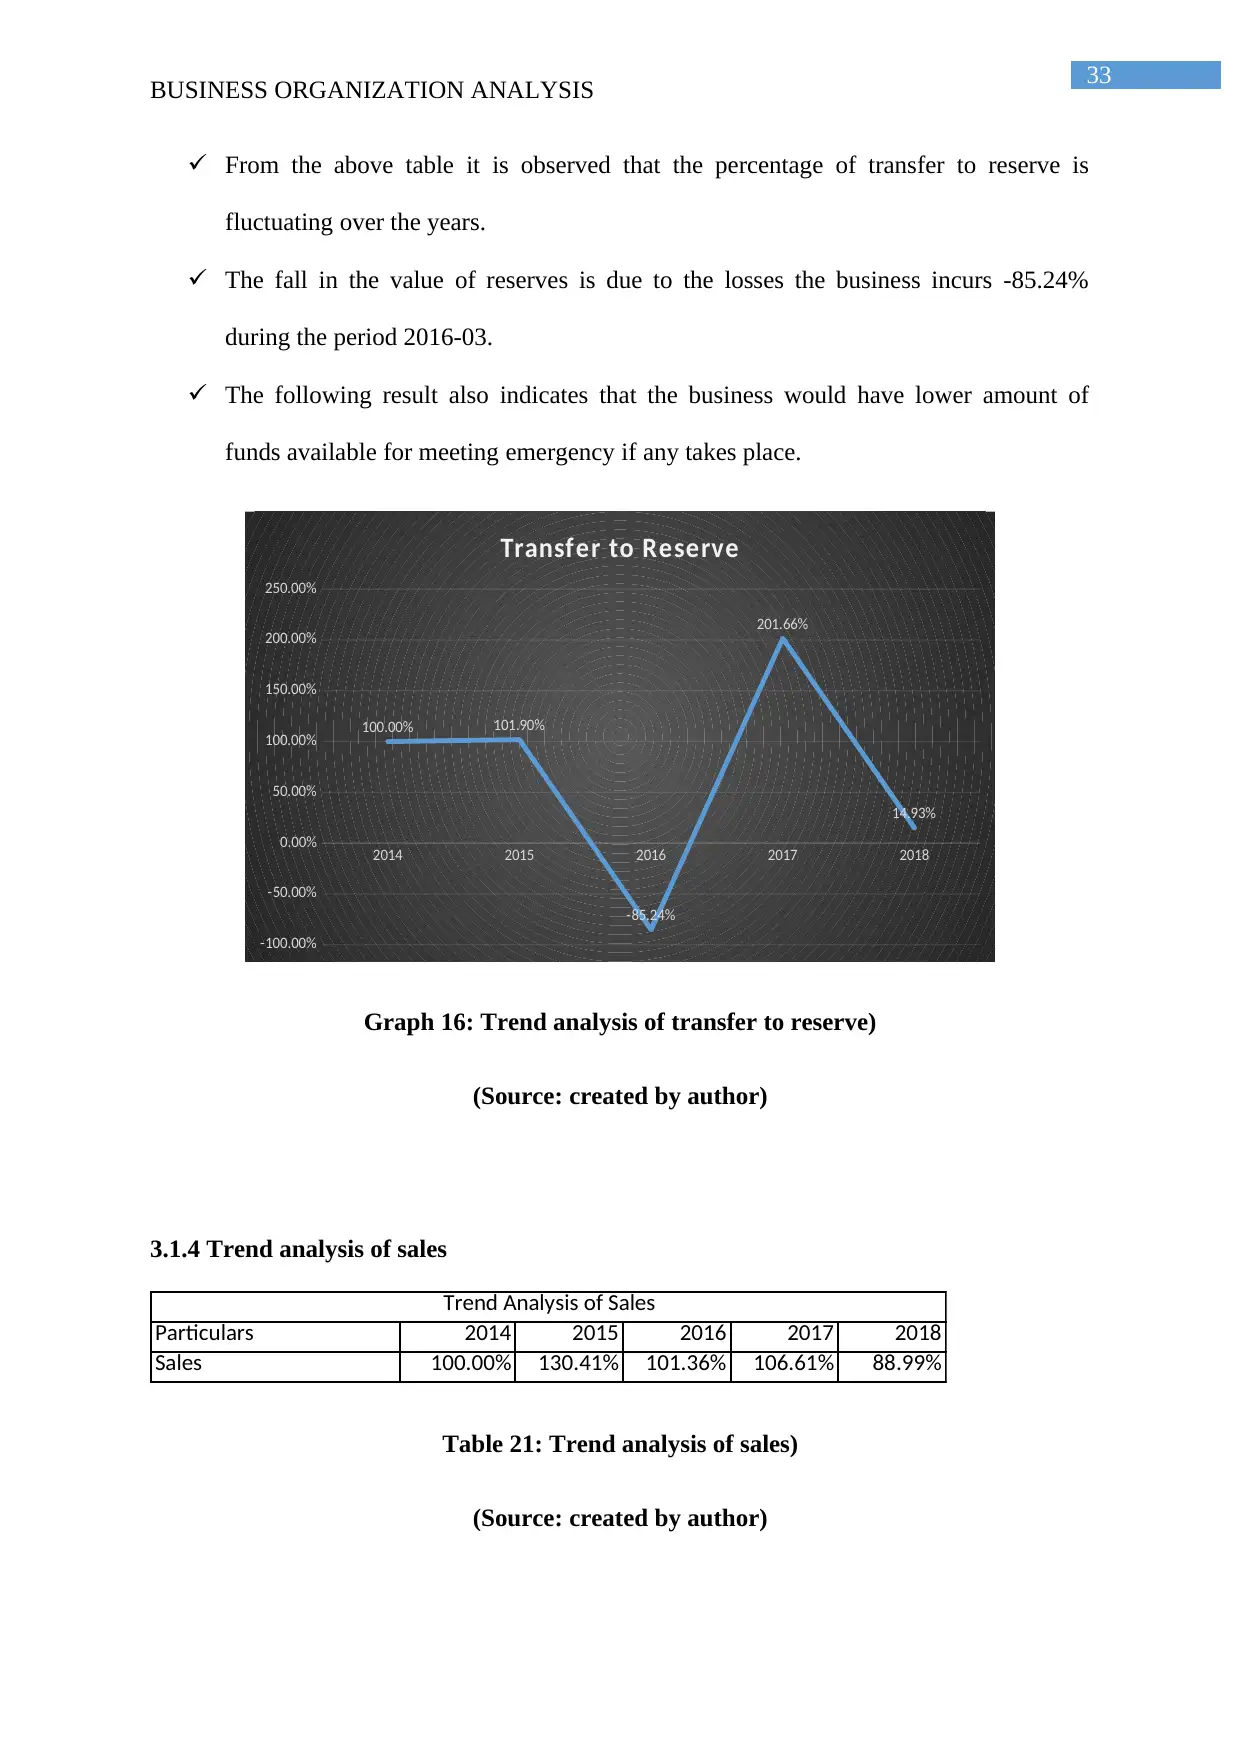
33
BUSINESS ORGANIZATION ANALYSIS
From the above table it is observed that the percentage of transfer to reserve is
fluctuating over the years.
The fall in the value of reserves is due to the losses the business incurs -85.24%
during the period 2016-03.
The following result also indicates that the business would have lower amount of
funds available for meeting emergency if any takes place.
2014 2015 2016 2017 2018
-100.00%
-50.00%
0.00%
50.00%
100.00%
150.00%
200.00%
250.00%
100.00% 101.90%
-85.24%
201.66%
14.93%
Transfer to Reserve
Graph 16: Trend analysis of transfer to reserve)
(Source: created by author)
3.1.4 Trend analysis of sales
Particulars 2014 2015 2016 2017 2018
Sales 100.00% 130.41% 101.36% 106.61% 88.99%
Trend Analysis of Sales
Table 21: Trend analysis of sales)
(Source: created by author)
Secure Best Marks with AI Grader
Need help grading? Try our AI Grader for instant feedback on your assignments.
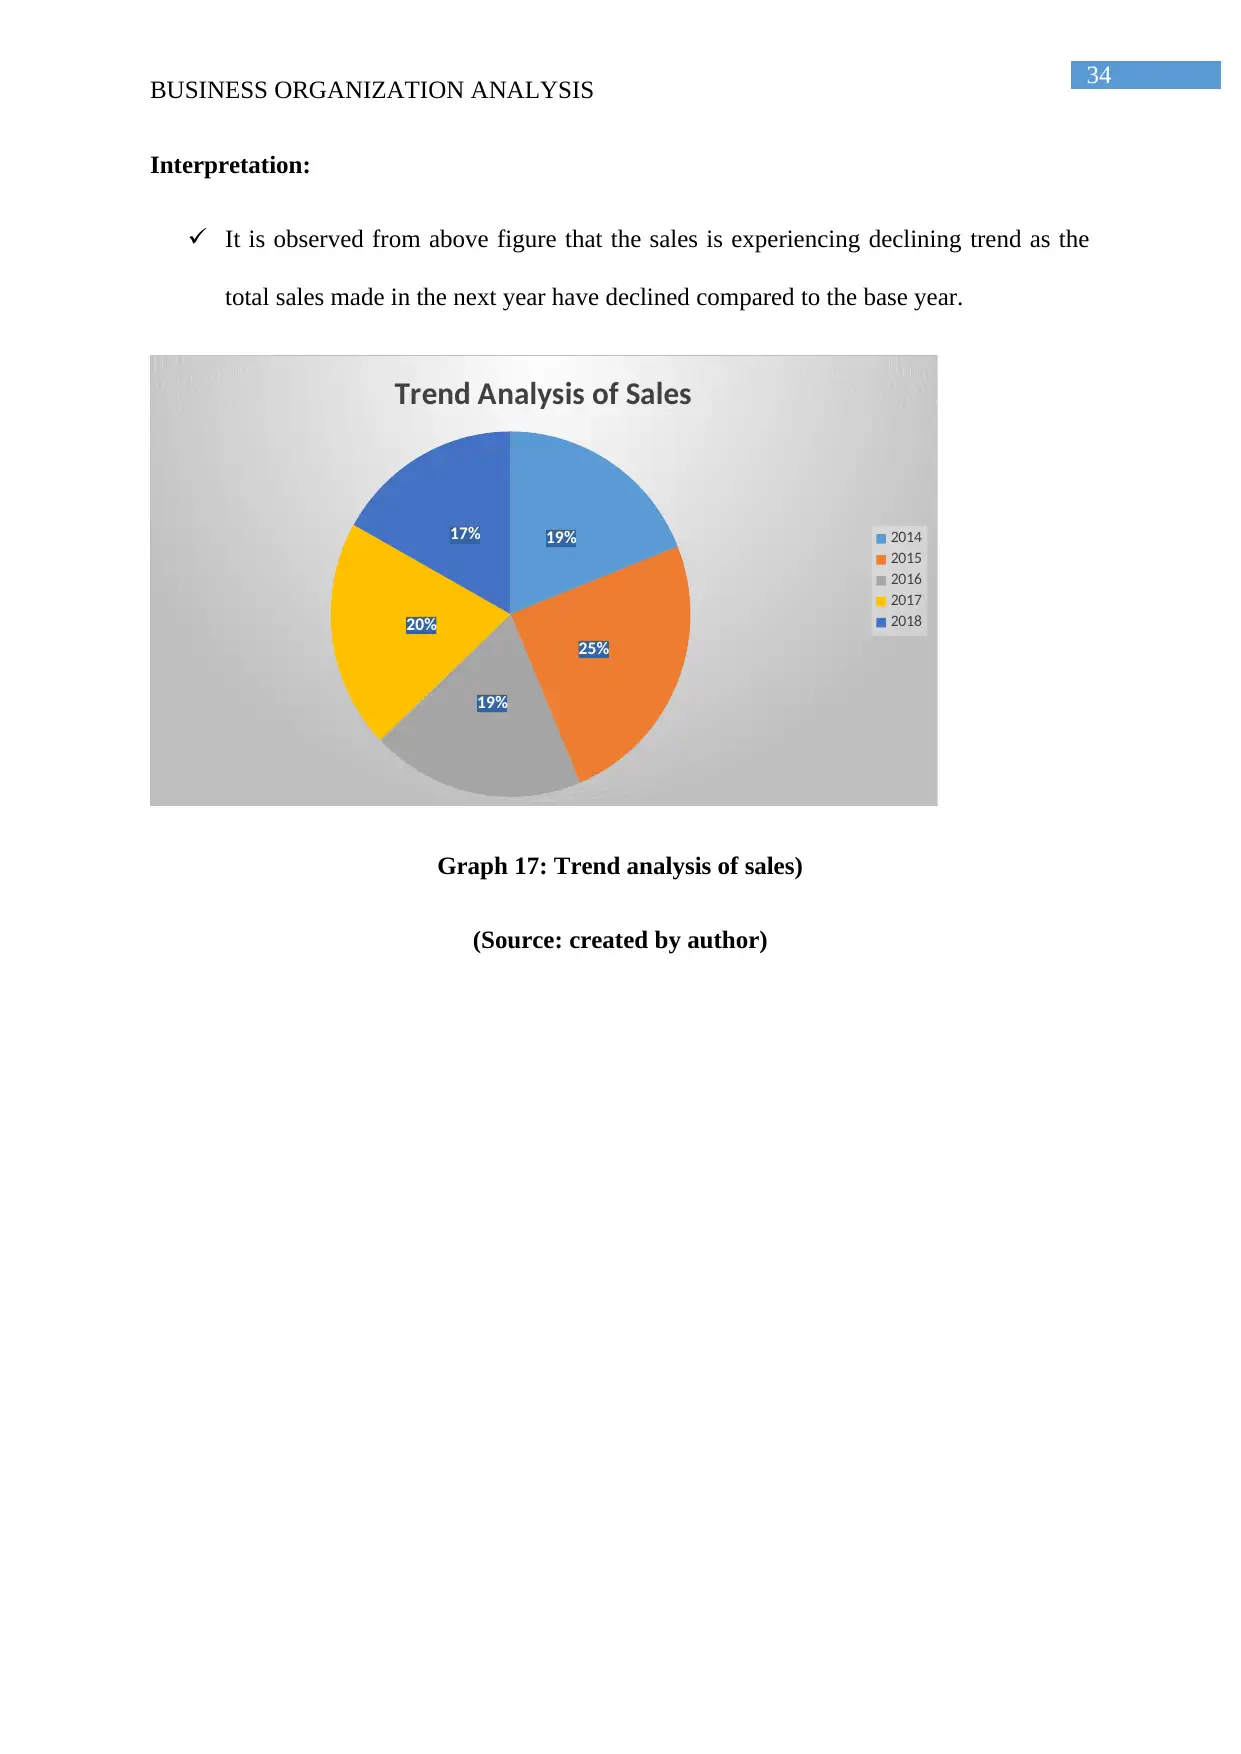
34
BUSINESS ORGANIZATION ANALYSIS
Interpretation:
It is observed from above figure that the sales is experiencing declining trend as the
total sales made in the next year have declined compared to the base year.
19%
25%
19%
20%
17%
Trend Analysis of Sales
2014
2015
2016
2017
2018
Graph 17: Trend analysis of sales)
(Source: created by author)
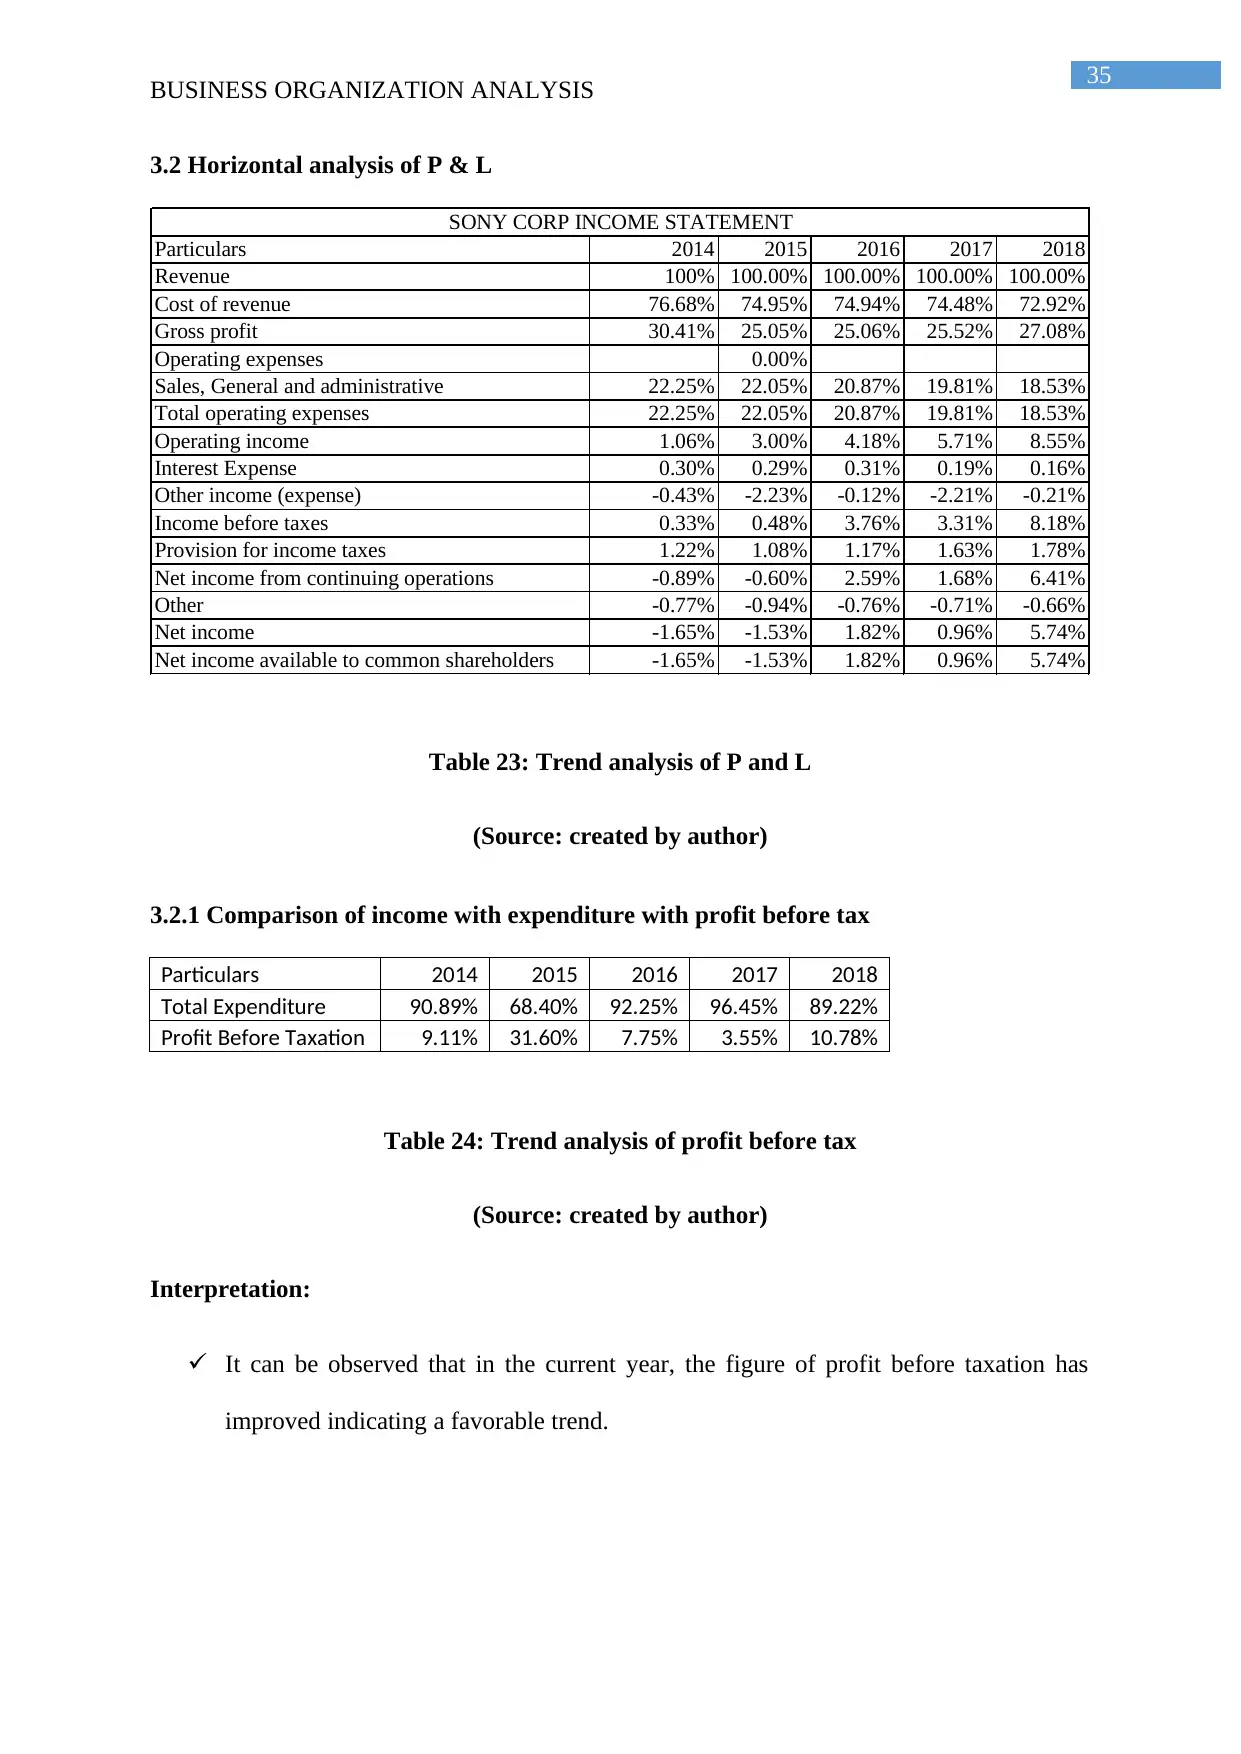
35
BUSINESS ORGANIZATION ANALYSIS
3.2 Horizontal analysis of P & L
Particulars 2014 2015 2016 2017 2018
Revenue 100% 100.00% 100.00% 100.00% 100.00%
Cost of revenue 76.68% 74.95% 74.94% 74.48% 72.92%
Gross profit 30.41% 25.05% 25.06% 25.52% 27.08%
Operating expenses 0.00%
Sales, General and administrative 22.25% 22.05% 20.87% 19.81% 18.53%
Total operating expenses 22.25% 22.05% 20.87% 19.81% 18.53%
Operating income 1.06% 3.00% 4.18% 5.71% 8.55%
Interest Expense 0.30% 0.29% 0.31% 0.19% 0.16%
Other income (expense) -0.43% -2.23% -0.12% -2.21% -0.21%
Income before taxes 0.33% 0.48% 3.76% 3.31% 8.18%
Provision for income taxes 1.22% 1.08% 1.17% 1.63% 1.78%
Net income from continuing operations -0.89% -0.60% 2.59% 1.68% 6.41%
Other -0.77% -0.94% -0.76% -0.71% -0.66%
Net income -1.65% -1.53% 1.82% 0.96% 5.74%
Net income available to common shareholders -1.65% -1.53% 1.82% 0.96% 5.74%
SONY CORP INCOME STATEMENT
Table 23: Trend analysis of P and L
(Source: created by author)
3.2.1 Comparison of income with expenditure with profit before tax
Particulars 2014 2015 2016 2017 2018
Total Expenditure 90.89% 68.40% 92.25% 96.45% 89.22%
Profit Before Taxation 9.11% 31.60% 7.75% 3.55% 10.78%
Table 24: Trend analysis of profit before tax
(Source: created by author)
Interpretation:
It can be observed that in the current year, the figure of profit before taxation has
improved indicating a favorable trend.
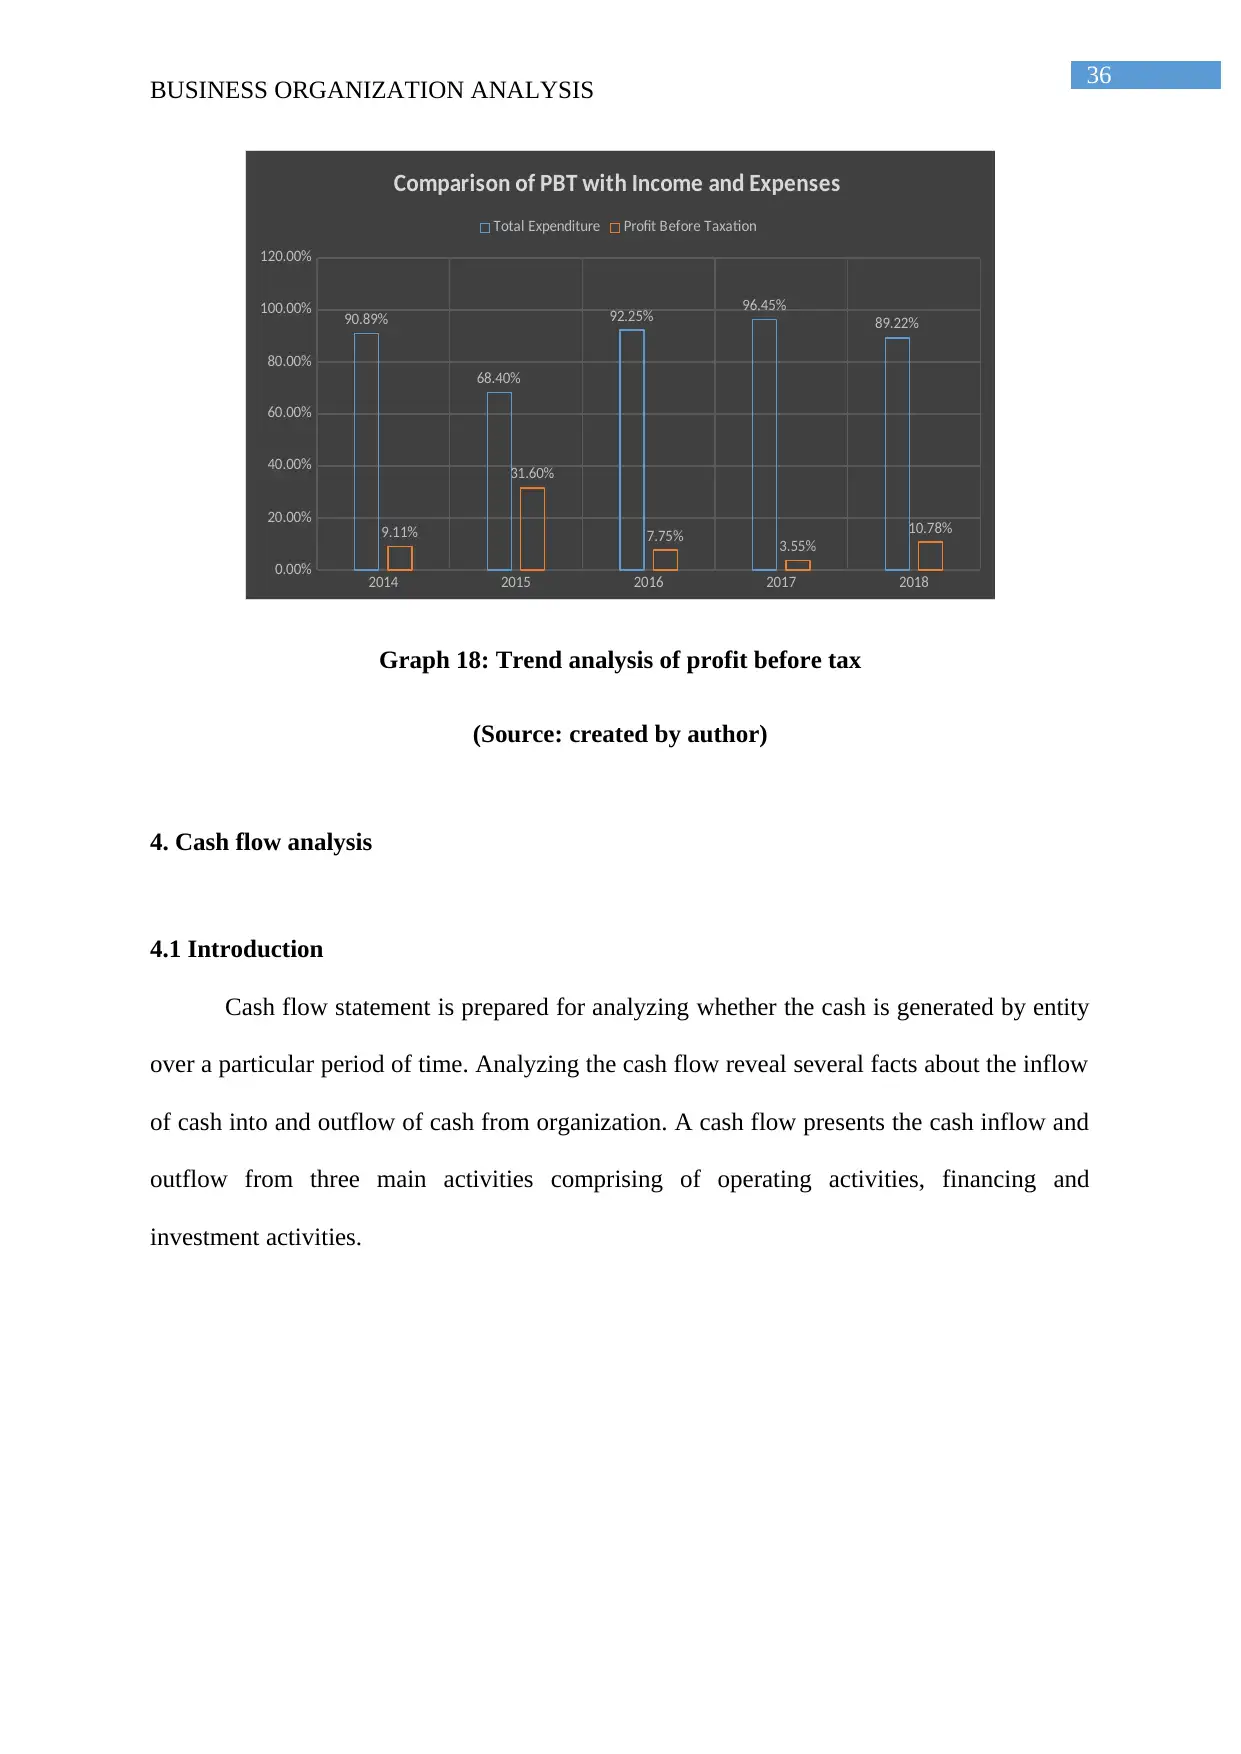
36
BUSINESS ORGANIZATION ANALYSIS
2014 2015 2016 2017 2018
0.00%
20.00%
40.00%
60.00%
80.00%
100.00%
120.00%
90.89%
68.40%
92.25% 96.45%
89.22%
9.11%
31.60%
7.75% 3.55%
10.78%
Comparison of PBT with Income and Expenses
Total Expenditure Profit Before Taxation
Graph 18: Trend analysis of profit before tax
(Source: created by author)
4. Cash flow analysis
4.1 Introduction
Cash flow statement is prepared for analyzing whether the cash is generated by entity
over a particular period of time. Analyzing the cash flow reveal several facts about the inflow
of cash into and outflow of cash from organization. A cash flow presents the cash inflow and
outflow from three main activities comprising of operating activities, financing and
investment activities.
Paraphrase This Document
Need a fresh take? Get an instant paraphrase of this document with our AI Paraphraser
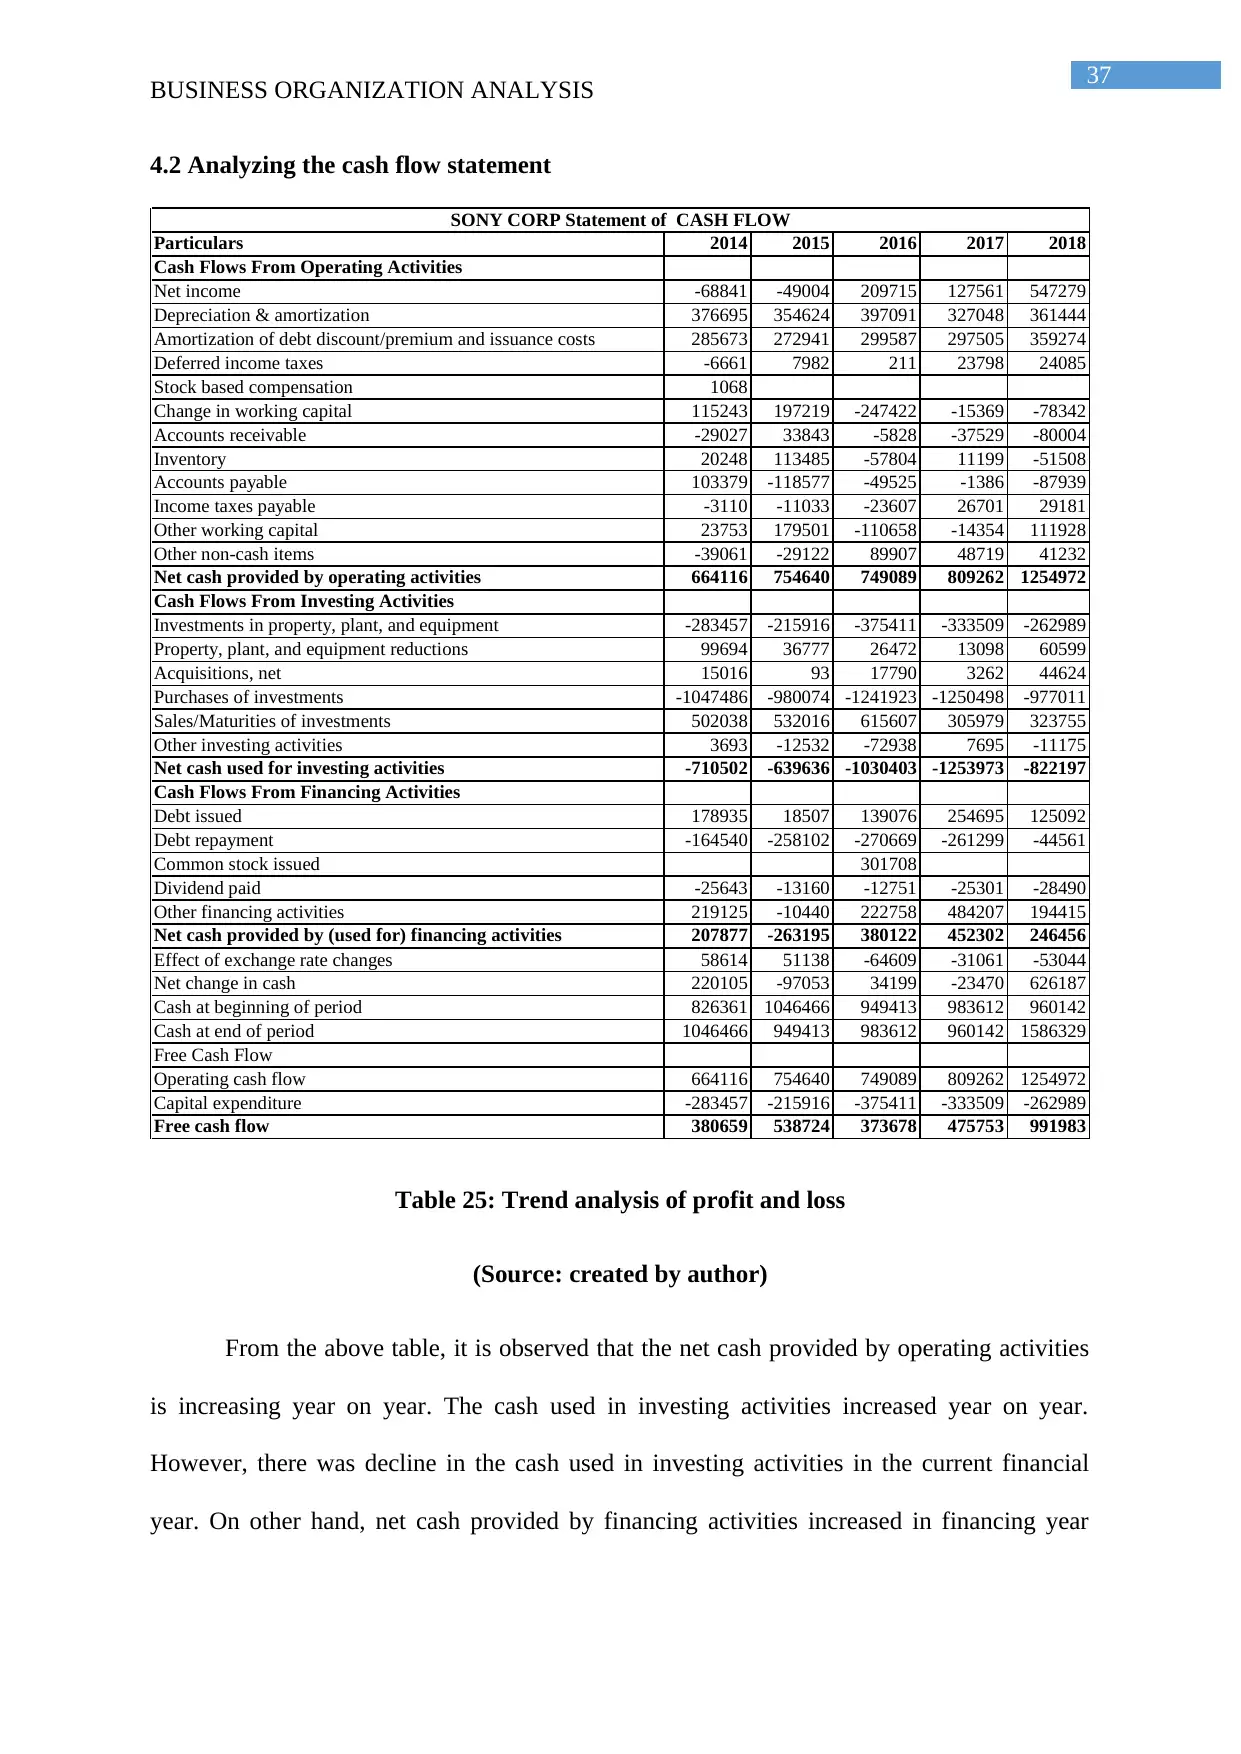
37
BUSINESS ORGANIZATION ANALYSIS
4.2 Analyzing the cash flow statement
Particulars 2014 2015 2016 2017 2018
Cash Flows From Operating Activities
Net income -68841 -49004 209715 127561 547279
Depreciation & amortization 376695 354624 397091 327048 361444
Amortization of debt discount/premium and issuance costs 285673 272941 299587 297505 359274
Deferred income taxes -6661 7982 211 23798 24085
Stock based compensation 1068
Change in working capital 115243 197219 -247422 -15369 -78342
Accounts receivable -29027 33843 -5828 -37529 -80004
Inventory 20248 113485 -57804 11199 -51508
Accounts payable 103379 -118577 -49525 -1386 -87939
Income taxes payable -3110 -11033 -23607 26701 29181
Other working capital 23753 179501 -110658 -14354 111928
Other non-cash items -39061 -29122 89907 48719 41232
Net cash provided by operating activities 664116 754640 749089 809262 1254972
Cash Flows From Investing Activities
Investments in property, plant, and equipment -283457 -215916 -375411 -333509 -262989
Property, plant, and equipment reductions 99694 36777 26472 13098 60599
Acquisitions, net 15016 93 17790 3262 44624
Purchases of investments -1047486 -980074 -1241923 -1250498 -977011
Sales/Maturities of investments 502038 532016 615607 305979 323755
Other investing activities 3693 -12532 -72938 7695 -11175
Net cash used for investing activities -710502 -639636 -1030403 -1253973 -822197
Cash Flows From Financing Activities
Debt issued 178935 18507 139076 254695 125092
Debt repayment -164540 -258102 -270669 -261299 -44561
Common stock issued 301708
Dividend paid -25643 -13160 -12751 -25301 -28490
Other financing activities 219125 -10440 222758 484207 194415
Net cash provided by (used for) financing activities 207877 -263195 380122 452302 246456
Effect of exchange rate changes 58614 51138 -64609 -31061 -53044
Net change in cash 220105 -97053 34199 -23470 626187
Cash at beginning of period 826361 1046466 949413 983612 960142
Cash at end of period 1046466 949413 983612 960142 1586329
Free Cash Flow
Operating cash flow 664116 754640 749089 809262 1254972
Capital expenditure -283457 -215916 -375411 -333509 -262989
Free cash flow 380659 538724 373678 475753 991983
SONY CORP Statement of CASH FLOW
Table 25: Trend analysis of profit and loss
(Source: created by author)
From the above table, it is observed that the net cash provided by operating activities
is increasing year on year. The cash used in investing activities increased year on year.
However, there was decline in the cash used in investing activities in the current financial
year. On other hand, net cash provided by financing activities increased in financing year
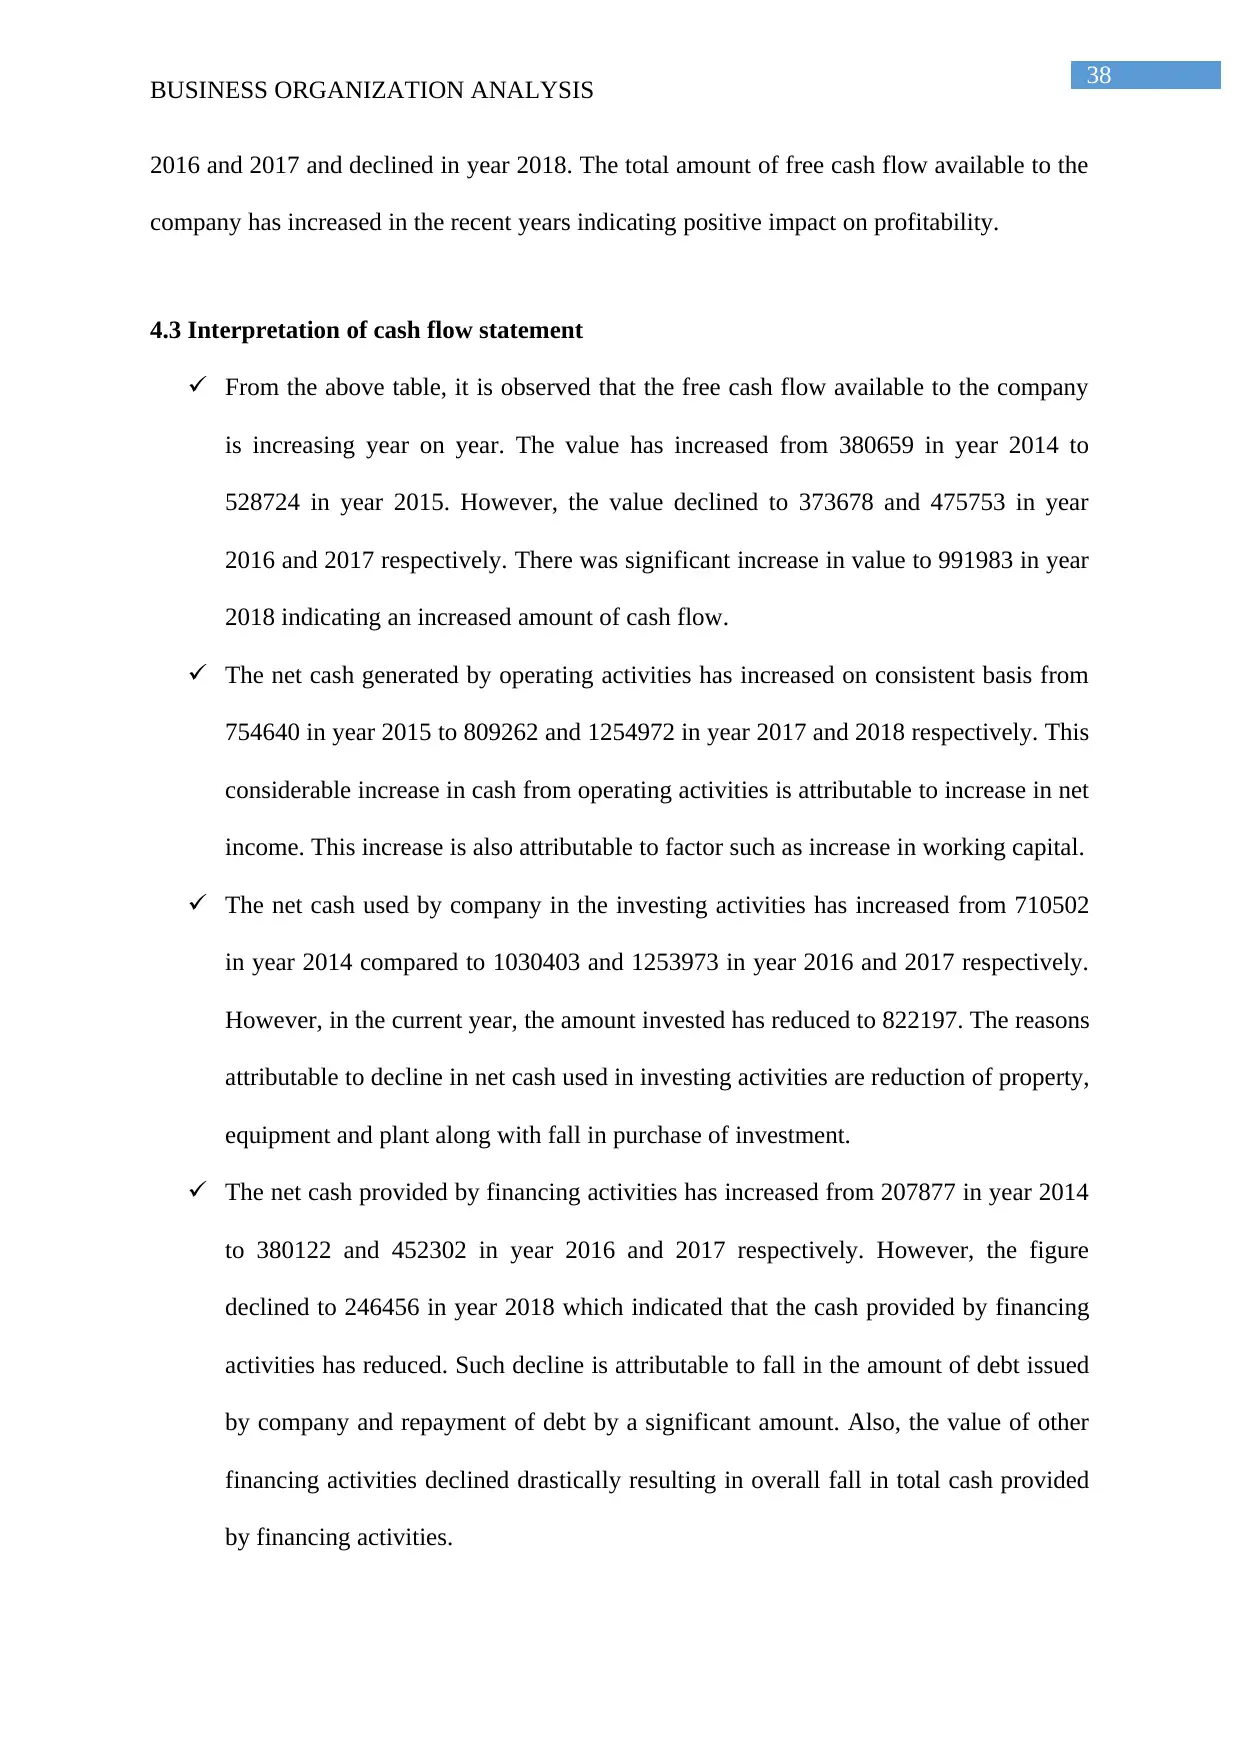
38
BUSINESS ORGANIZATION ANALYSIS
2016 and 2017 and declined in year 2018. The total amount of free cash flow available to the
company has increased in the recent years indicating positive impact on profitability.
4.3 Interpretation of cash flow statement
From the above table, it is observed that the free cash flow available to the company
is increasing year on year. The value has increased from 380659 in year 2014 to
528724 in year 2015. However, the value declined to 373678 and 475753 in year
2016 and 2017 respectively. There was significant increase in value to 991983 in year
2018 indicating an increased amount of cash flow.
The net cash generated by operating activities has increased on consistent basis from
754640 in year 2015 to 809262 and 1254972 in year 2017 and 2018 respectively. This
considerable increase in cash from operating activities is attributable to increase in net
income. This increase is also attributable to factor such as increase in working capital.
The net cash used by company in the investing activities has increased from 710502
in year 2014 compared to 1030403 and 1253973 in year 2016 and 2017 respectively.
However, in the current year, the amount invested has reduced to 822197. The reasons
attributable to decline in net cash used in investing activities are reduction of property,
equipment and plant along with fall in purchase of investment.
The net cash provided by financing activities has increased from 207877 in year 2014
to 380122 and 452302 in year 2016 and 2017 respectively. However, the figure
declined to 246456 in year 2018 which indicated that the cash provided by financing
activities has reduced. Such decline is attributable to fall in the amount of debt issued
by company and repayment of debt by a significant amount. Also, the value of other
financing activities declined drastically resulting in overall fall in total cash provided
by financing activities.
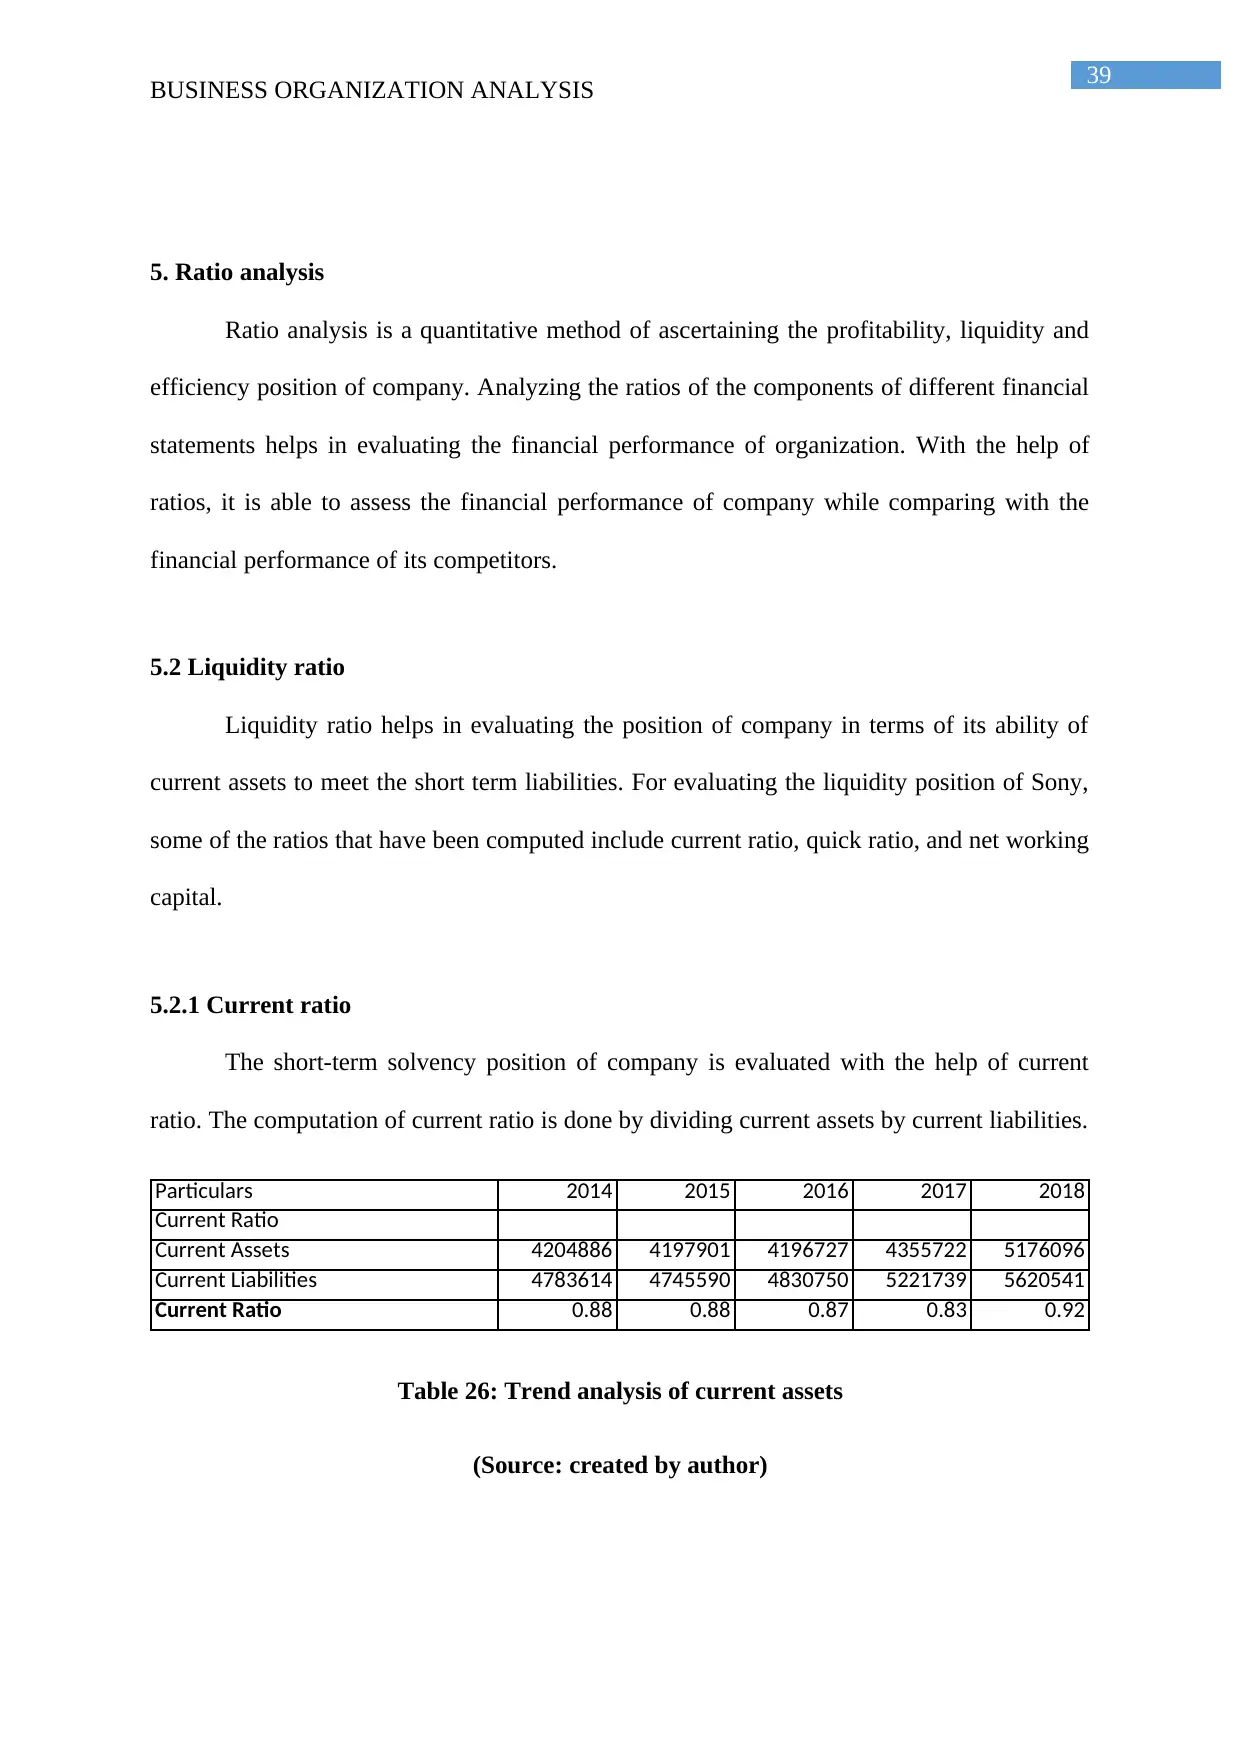
39
BUSINESS ORGANIZATION ANALYSIS
5. Ratio analysis
Ratio analysis is a quantitative method of ascertaining the profitability, liquidity and
efficiency position of company. Analyzing the ratios of the components of different financial
statements helps in evaluating the financial performance of organization. With the help of
ratios, it is able to assess the financial performance of company while comparing with the
financial performance of its competitors.
5.2 Liquidity ratio
Liquidity ratio helps in evaluating the position of company in terms of its ability of
current assets to meet the short term liabilities. For evaluating the liquidity position of Sony,
some of the ratios that have been computed include current ratio, quick ratio, and net working
capital.
5.2.1 Current ratio
The short-term solvency position of company is evaluated with the help of current
ratio. The computation of current ratio is done by dividing current assets by current liabilities.
Particulars 2014 2015 2016 2017 2018
Current Ratio
Current Assets 4204886 4197901 4196727 4355722 5176096
Current Liabilities 4783614 4745590 4830750 5221739 5620541
Current Ratio 0.88 0.88 0.87 0.83 0.92
Table 26: Trend analysis of current assets
(Source: created by author)
Secure Best Marks with AI Grader
Need help grading? Try our AI Grader for instant feedback on your assignments.
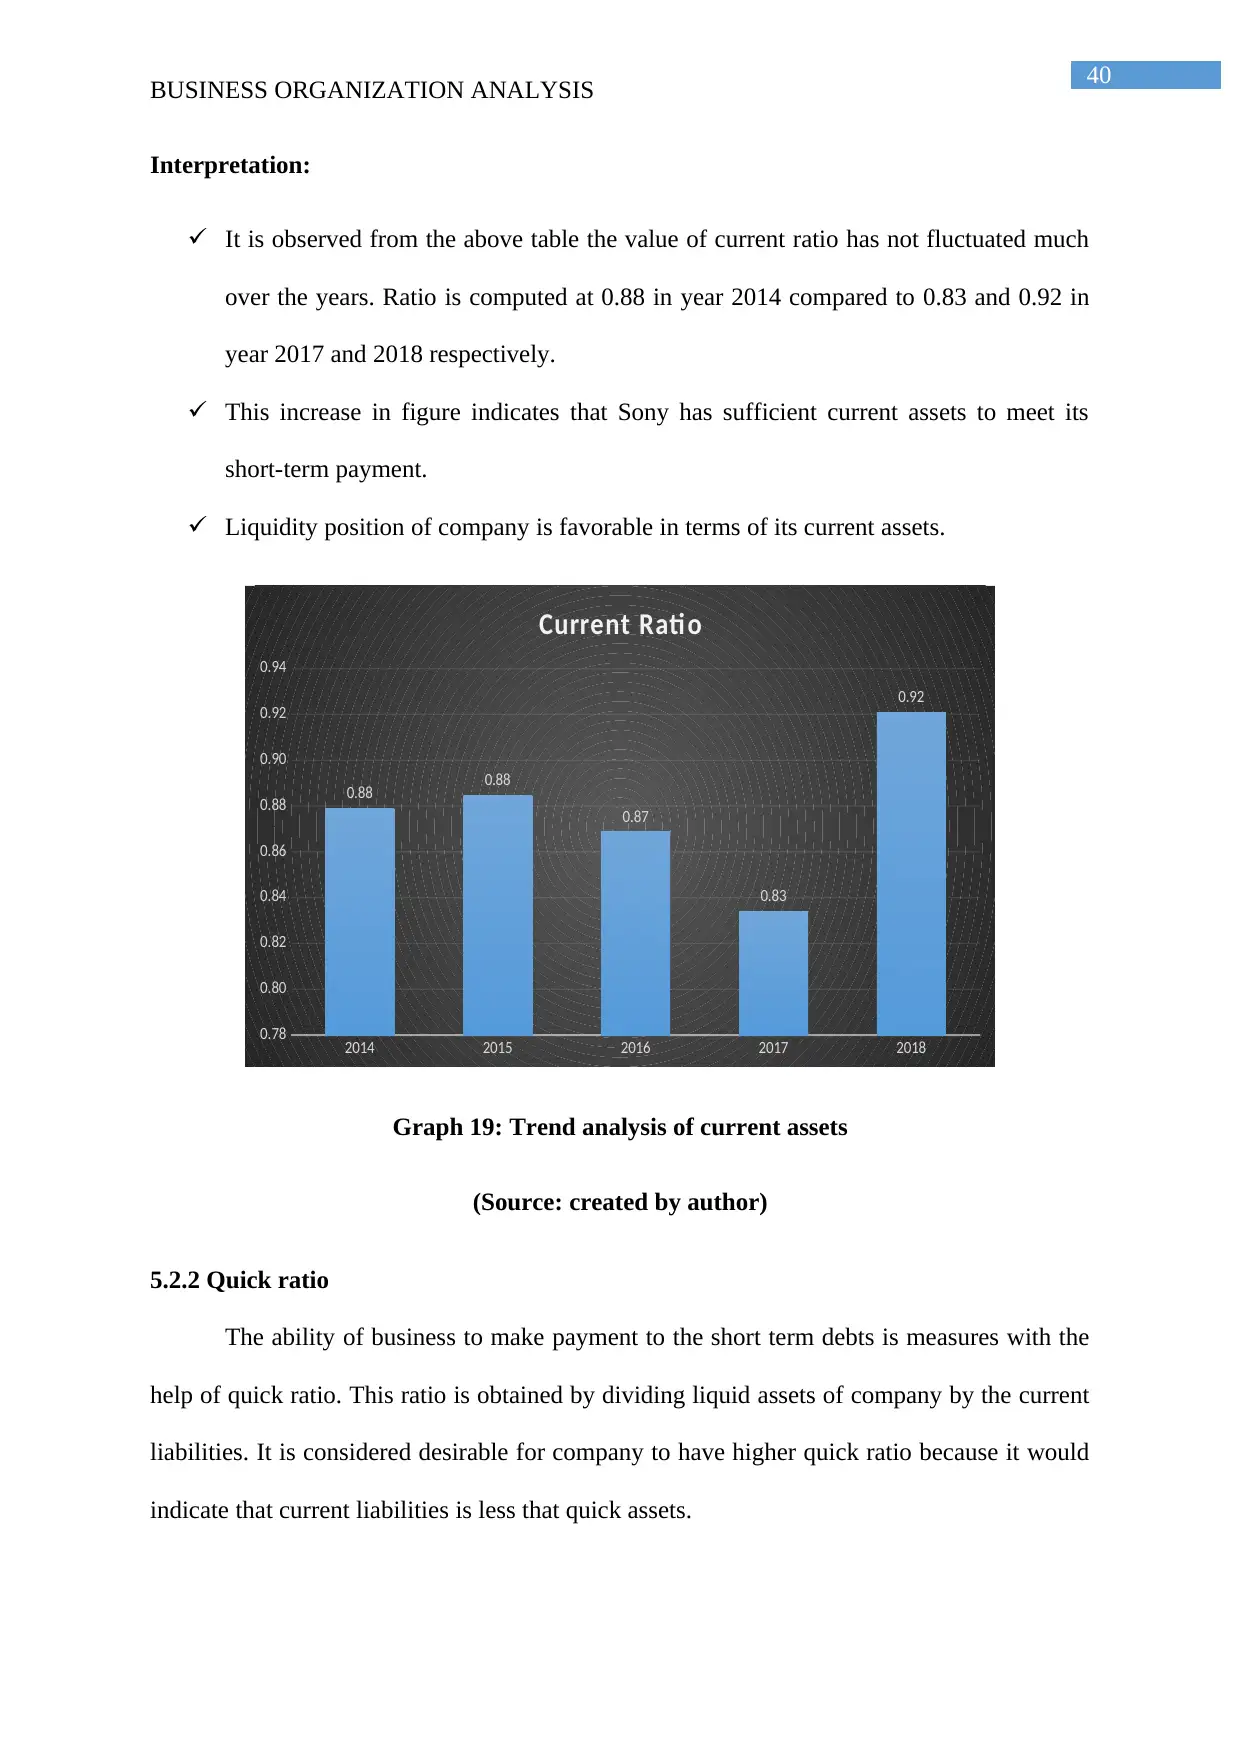
40
BUSINESS ORGANIZATION ANALYSIS
Interpretation:
It is observed from the above table the value of current ratio has not fluctuated much
over the years. Ratio is computed at 0.88 in year 2014 compared to 0.83 and 0.92 in
year 2017 and 2018 respectively.
This increase in figure indicates that Sony has sufficient current assets to meet its
short-term payment.
Liquidity position of company is favorable in terms of its current assets.
2014 2015 2016 2017 2018
0.78
0.80
0.82
0.84
0.86
0.88
0.90
0.92
0.94
0.88 0.88
0.87
0.83
0.92
Current Rati o
Graph 19: Trend analysis of current assets
(Source: created by author)
5.2.2 Quick ratio
The ability of business to make payment to the short term debts is measures with the
help of quick ratio. This ratio is obtained by dividing liquid assets of company by the current
liabilities. It is considered desirable for company to have higher quick ratio because it would
indicate that current liabilities is less that quick assets.
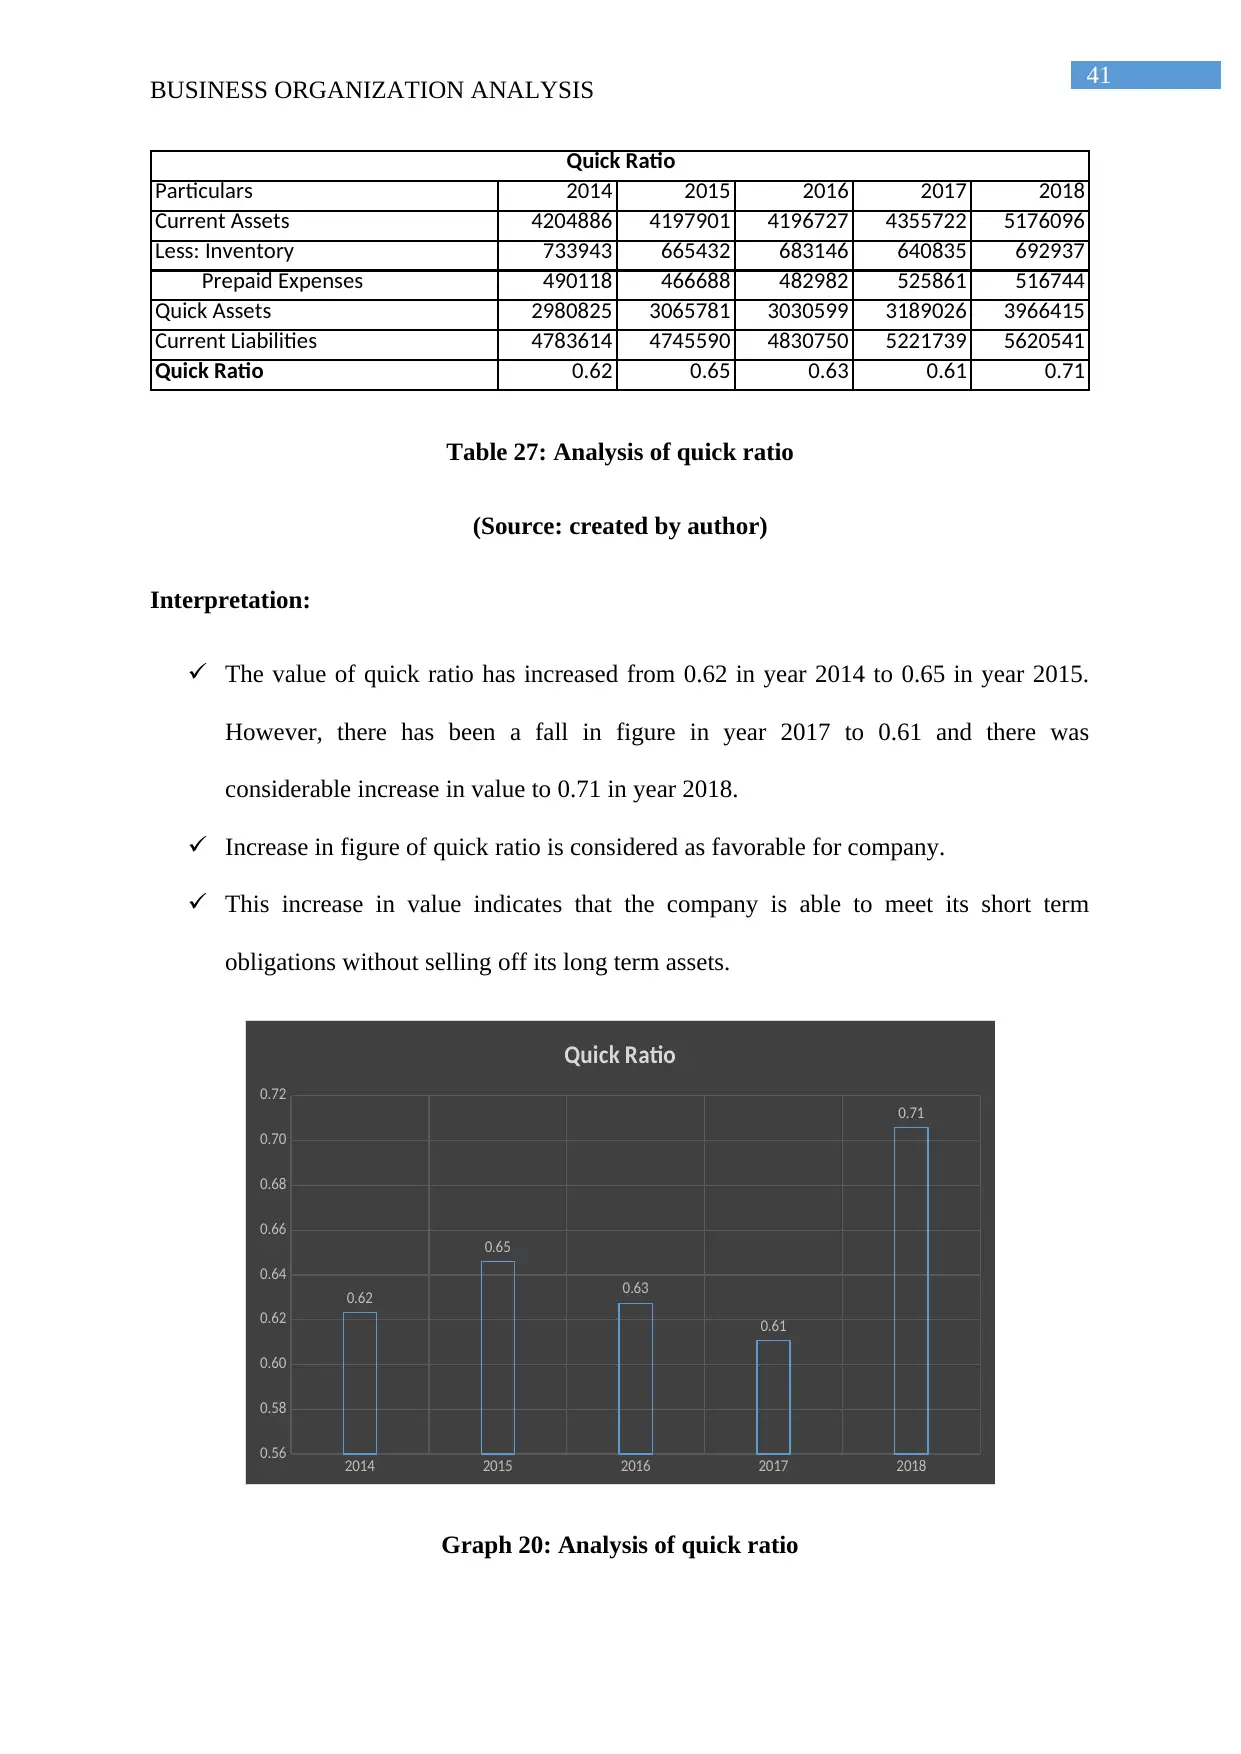
41
BUSINESS ORGANIZATION ANALYSIS
Particulars 2014 2015 2016 2017 2018
Current Assets 4204886 4197901 4196727 4355722 5176096
Less: Inventory 733943 665432 683146 640835 692937
Prepaid Expenses 490118 466688 482982 525861 516744
Quick Assets 2980825 3065781 3030599 3189026 3966415
Current Liabilities 4783614 4745590 4830750 5221739 5620541
Quick Ratio 0.62 0.65 0.63 0.61 0.71
Quick Ratio
Table 27: Analysis of quick ratio
(Source: created by author)
Interpretation:
The value of quick ratio has increased from 0.62 in year 2014 to 0.65 in year 2015.
However, there has been a fall in figure in year 2017 to 0.61 and there was
considerable increase in value to 0.71 in year 2018.
Increase in figure of quick ratio is considered as favorable for company.
This increase in value indicates that the company is able to meet its short term
obligations without selling off its long term assets.
2014 2015 2016 2017 2018
0.56
0.58
0.60
0.62
0.64
0.66
0.68
0.70
0.72
0.62
0.65
0.63
0.61
0.71
Quick Ratio
Graph 20: Analysis of quick ratio
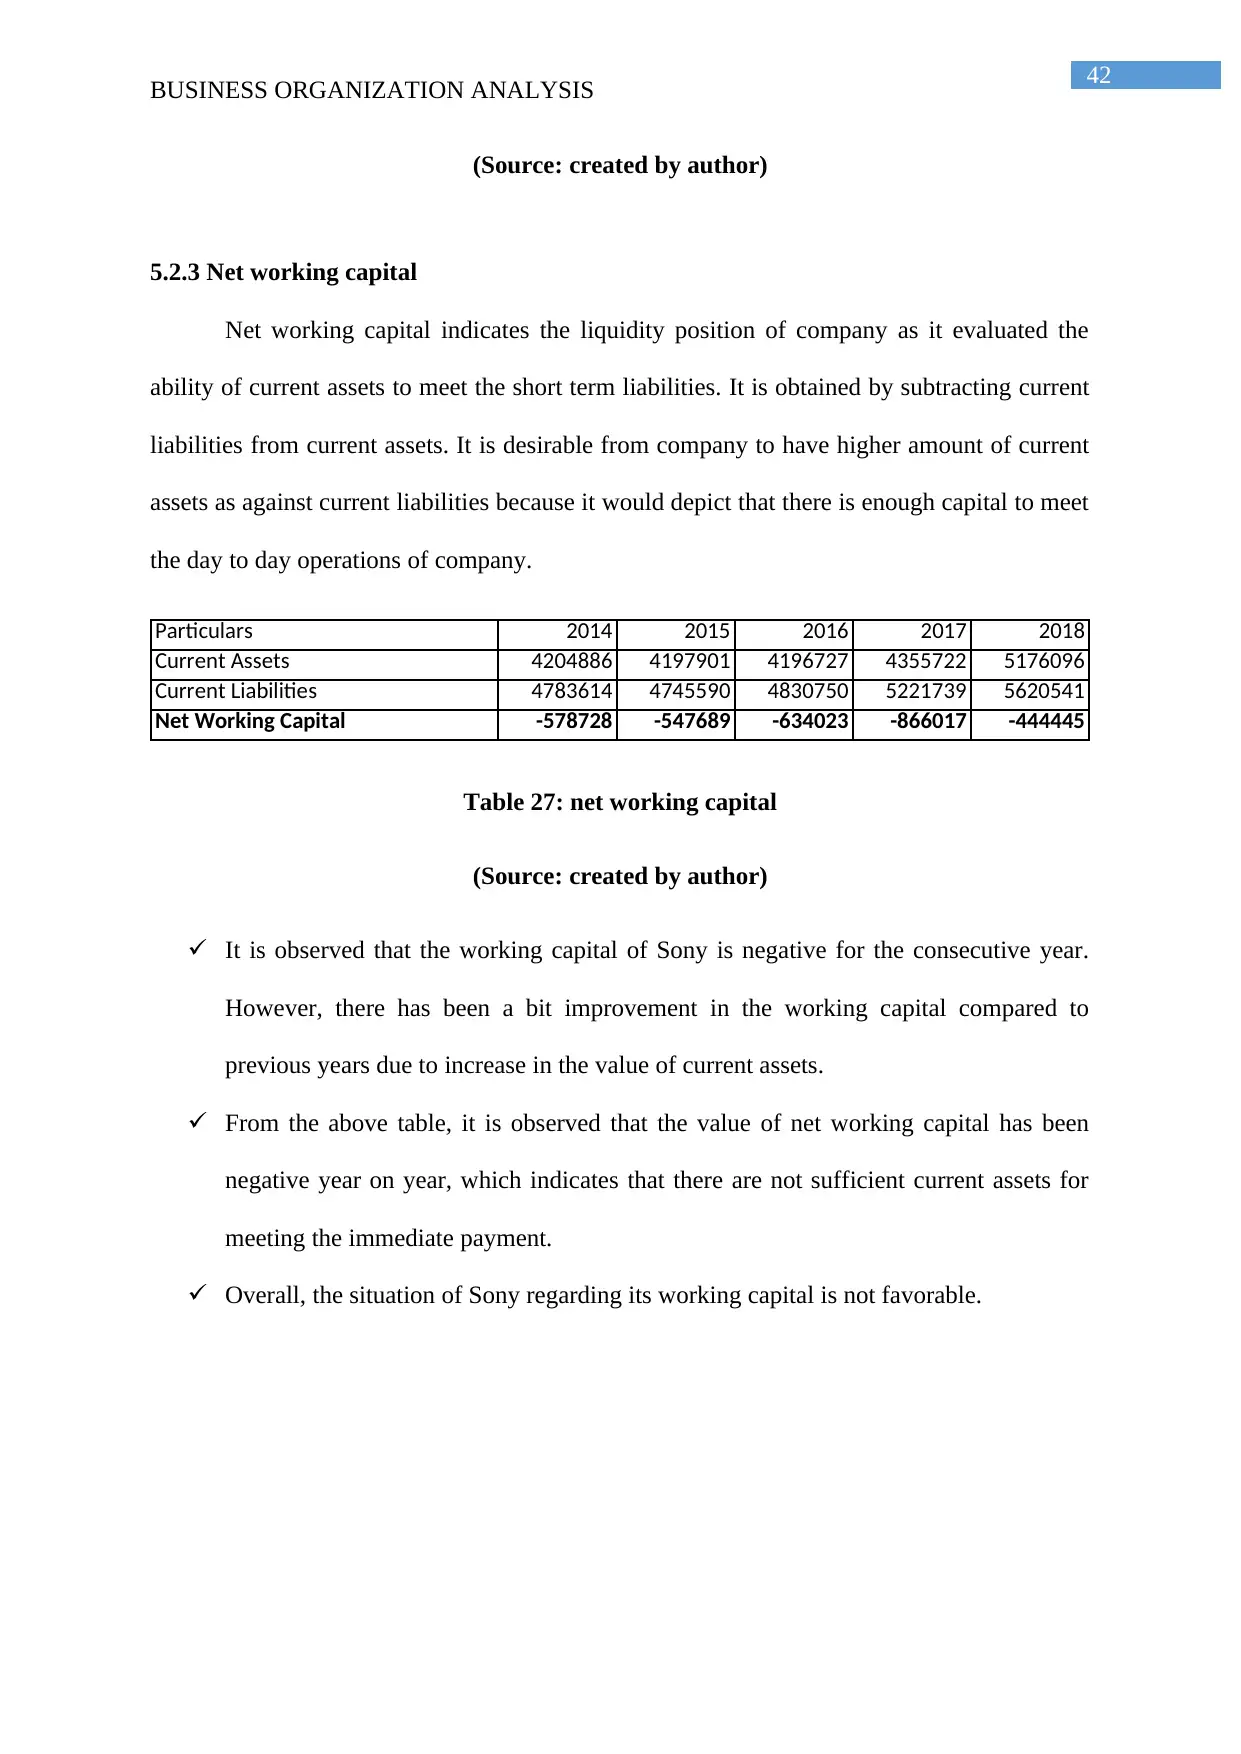
42
BUSINESS ORGANIZATION ANALYSIS
(Source: created by author)
5.2.3 Net working capital
Net working capital indicates the liquidity position of company as it evaluated the
ability of current assets to meet the short term liabilities. It is obtained by subtracting current
liabilities from current assets. It is desirable from company to have higher amount of current
assets as against current liabilities because it would depict that there is enough capital to meet
the day to day operations of company.
Particulars 2014 2015 2016 2017 2018
Current Assets 4204886 4197901 4196727 4355722 5176096
Current Liabilities 4783614 4745590 4830750 5221739 5620541
Net Working Capital -578728 -547689 -634023 -866017 -444445
Table 27: net working capital
(Source: created by author)
It is observed that the working capital of Sony is negative for the consecutive year.
However, there has been a bit improvement in the working capital compared to
previous years due to increase in the value of current assets.
From the above table, it is observed that the value of net working capital has been
negative year on year, which indicates that there are not sufficient current assets for
meeting the immediate payment.
Overall, the situation of Sony regarding its working capital is not favorable.
Paraphrase This Document
Need a fresh take? Get an instant paraphrase of this document with our AI Paraphraser
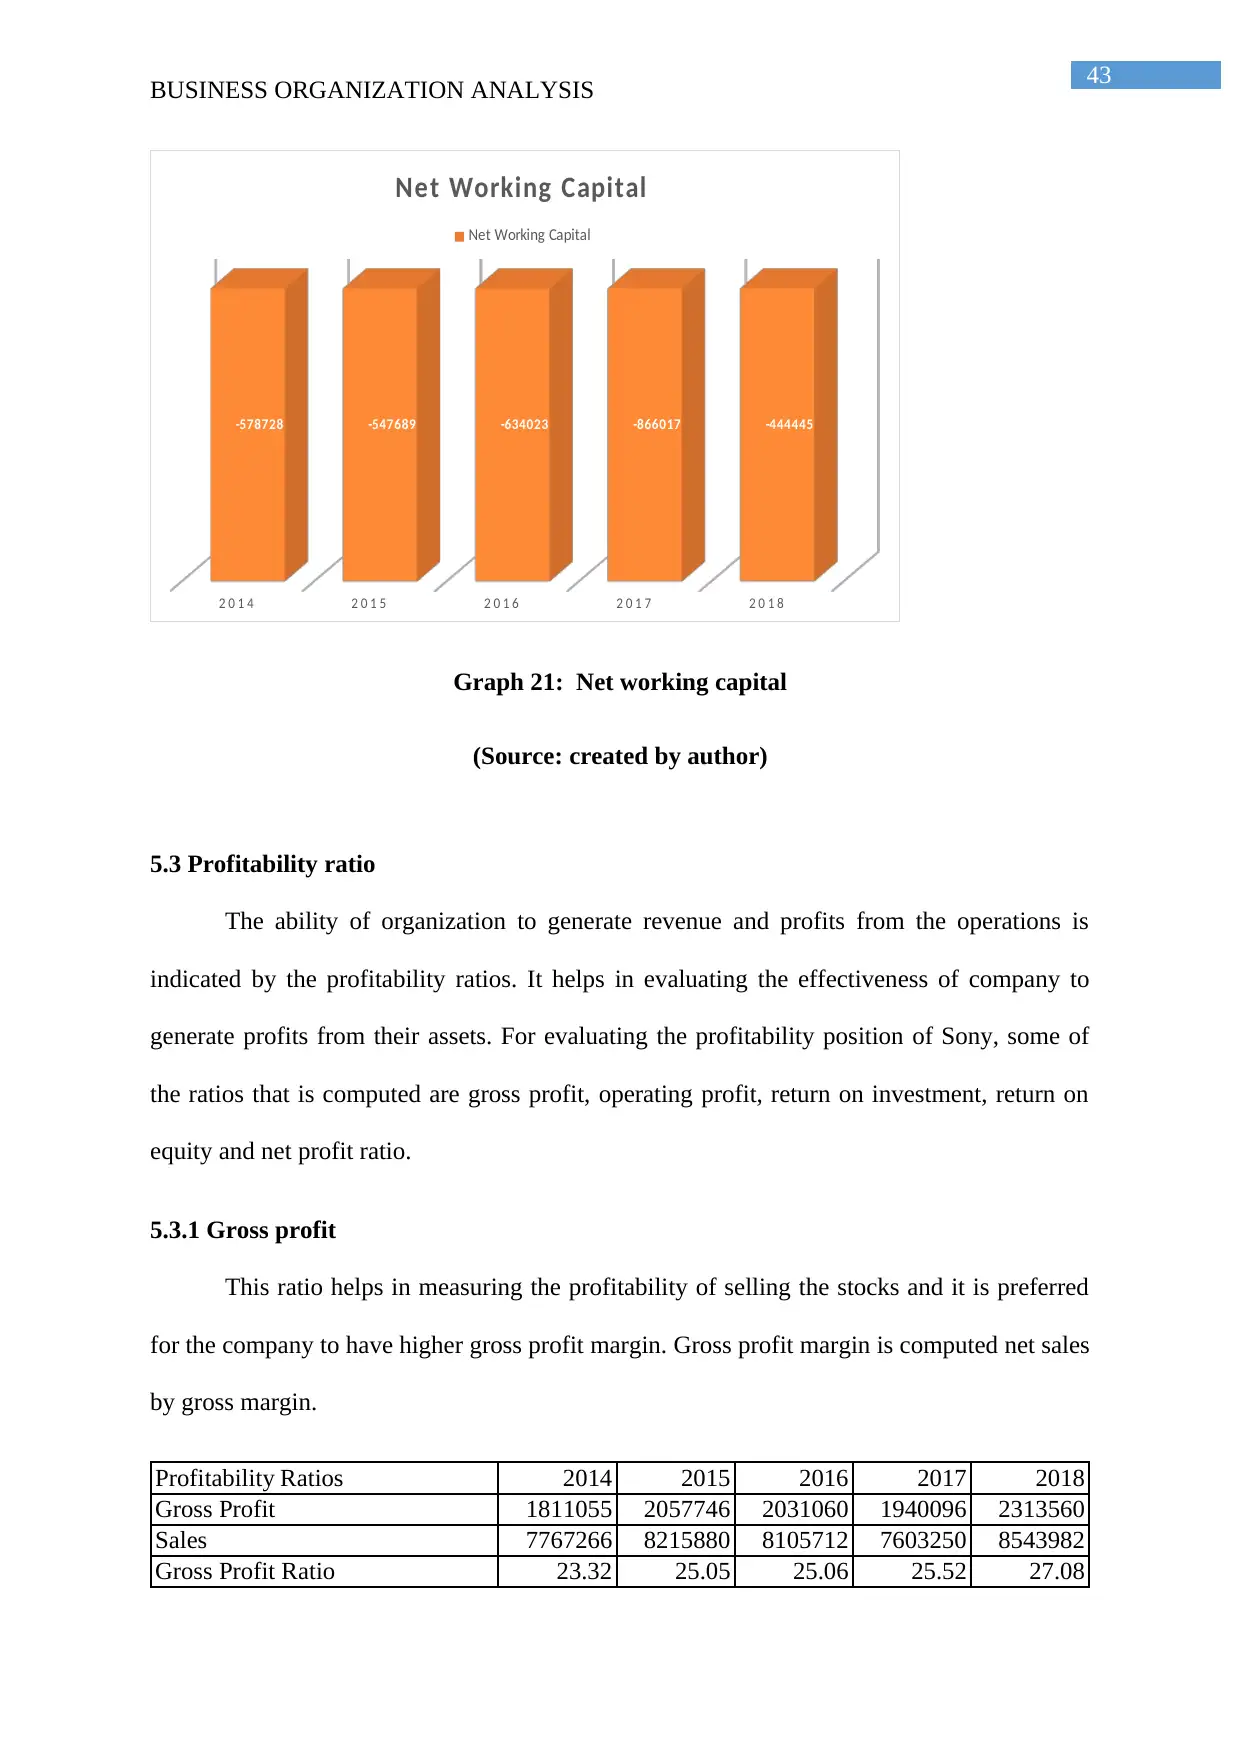
43
BUSINESS ORGANIZATION ANALYSIS
2 0 1 4 2 0 1 5 2 0 1 6 2 0 1 7 2 0 1 8
-578728 -547689 -634023 -866017 -444445
Net Working Capital
Net Working Capital
Graph 21: Net working capital
(Source: created by author)
5.3 Profitability ratio
The ability of organization to generate revenue and profits from the operations is
indicated by the profitability ratios. It helps in evaluating the effectiveness of company to
generate profits from their assets. For evaluating the profitability position of Sony, some of
the ratios that is computed are gross profit, operating profit, return on investment, return on
equity and net profit ratio.
5.3.1 Gross profit
This ratio helps in measuring the profitability of selling the stocks and it is preferred
for the company to have higher gross profit margin. Gross profit margin is computed net sales
by gross margin.
Profitability Ratios 2014 2015 2016 2017 2018
Gross Profit 1811055 2057746 2031060 1940096 2313560
Sales 7767266 8215880 8105712 7603250 8543982
Gross Profit Ratio 23.32 25.05 25.06 25.52 27.08
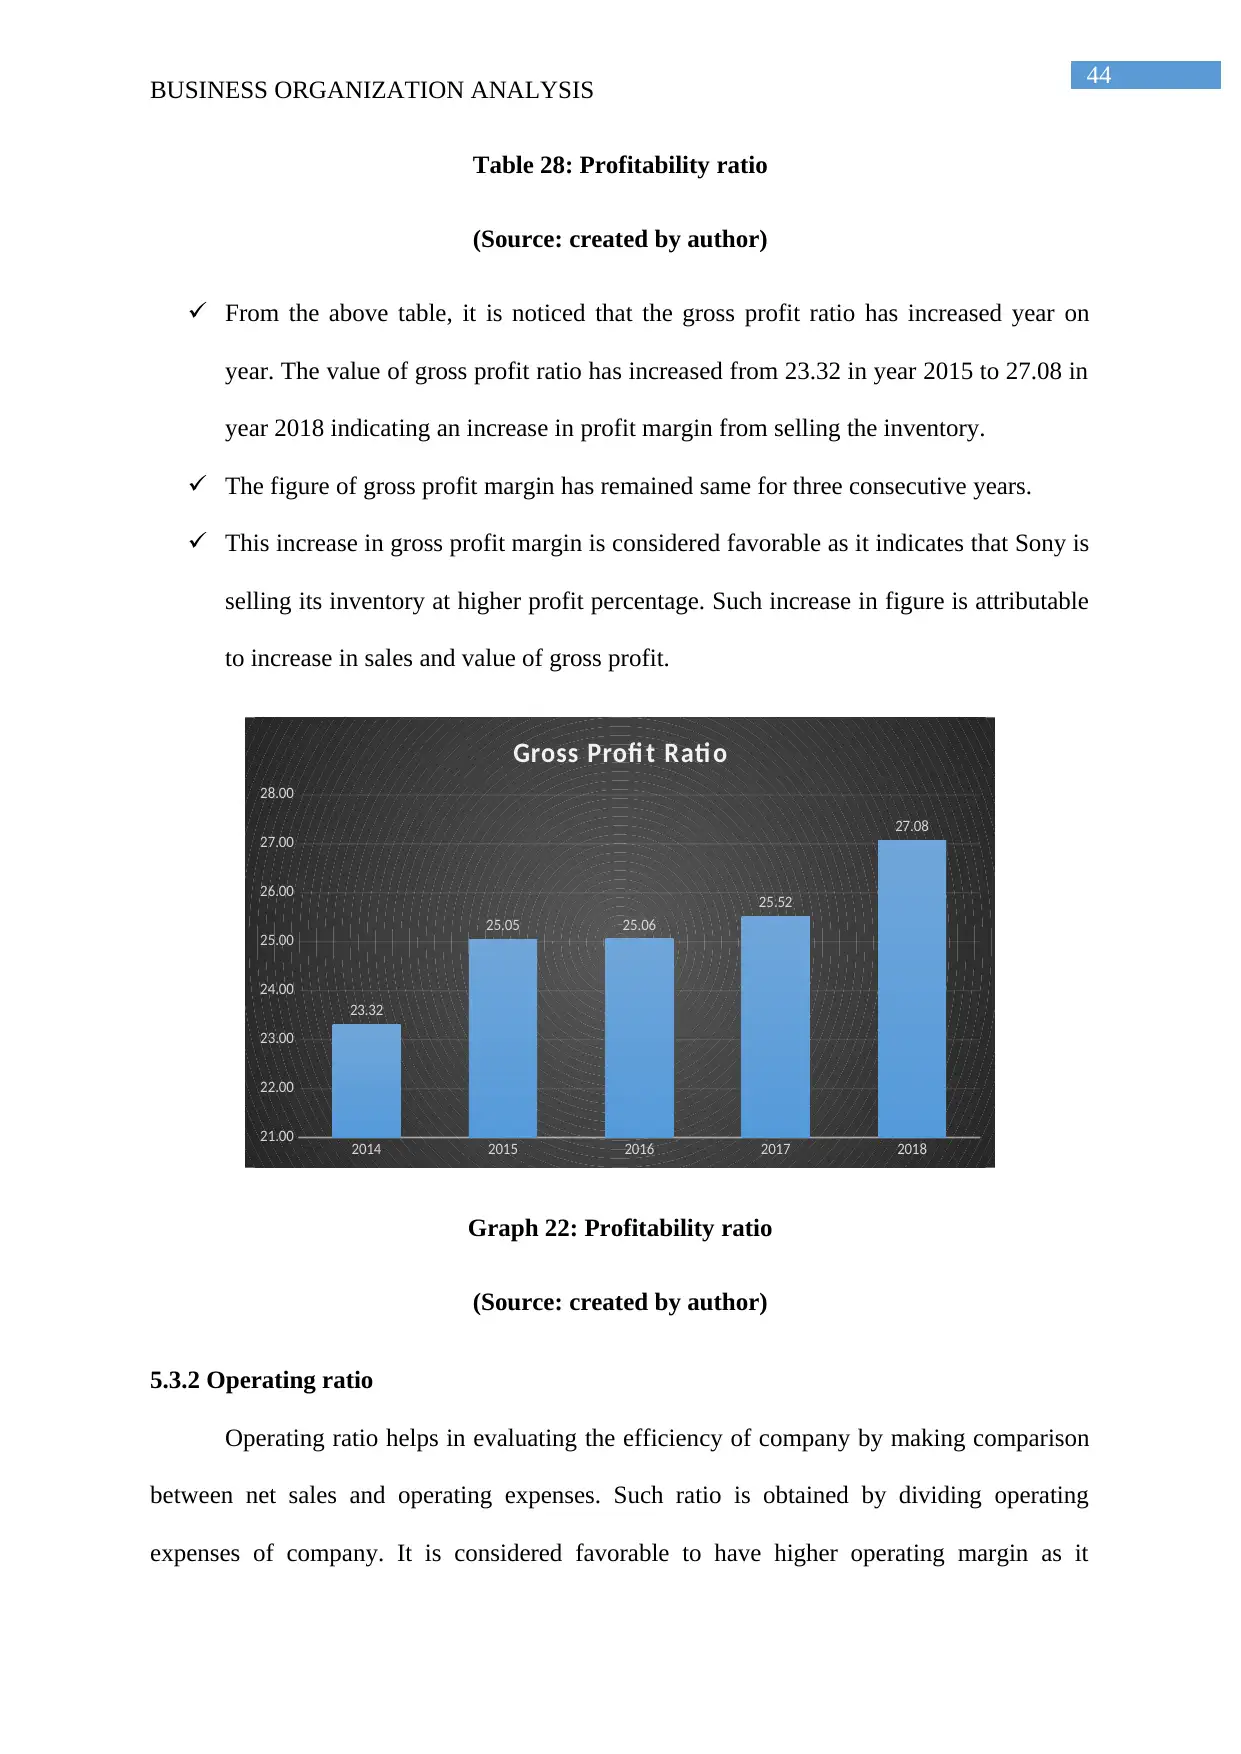
44
BUSINESS ORGANIZATION ANALYSIS
Table 28: Profitability ratio
(Source: created by author)
From the above table, it is noticed that the gross profit ratio has increased year on
year. The value of gross profit ratio has increased from 23.32 in year 2015 to 27.08 in
year 2018 indicating an increase in profit margin from selling the inventory.
The figure of gross profit margin has remained same for three consecutive years.
This increase in gross profit margin is considered favorable as it indicates that Sony is
selling its inventory at higher profit percentage. Such increase in figure is attributable
to increase in sales and value of gross profit.
2014 2015 2016 2017 2018
21.00
22.00
23.00
24.00
25.00
26.00
27.00
28.00
23.32
25.05 25.06
25.52
27.08
Gross Profi t Rati o
Graph 22: Profitability ratio
(Source: created by author)
5.3.2 Operating ratio
Operating ratio helps in evaluating the efficiency of company by making comparison
between net sales and operating expenses. Such ratio is obtained by dividing operating
expenses of company. It is considered favorable to have higher operating margin as it
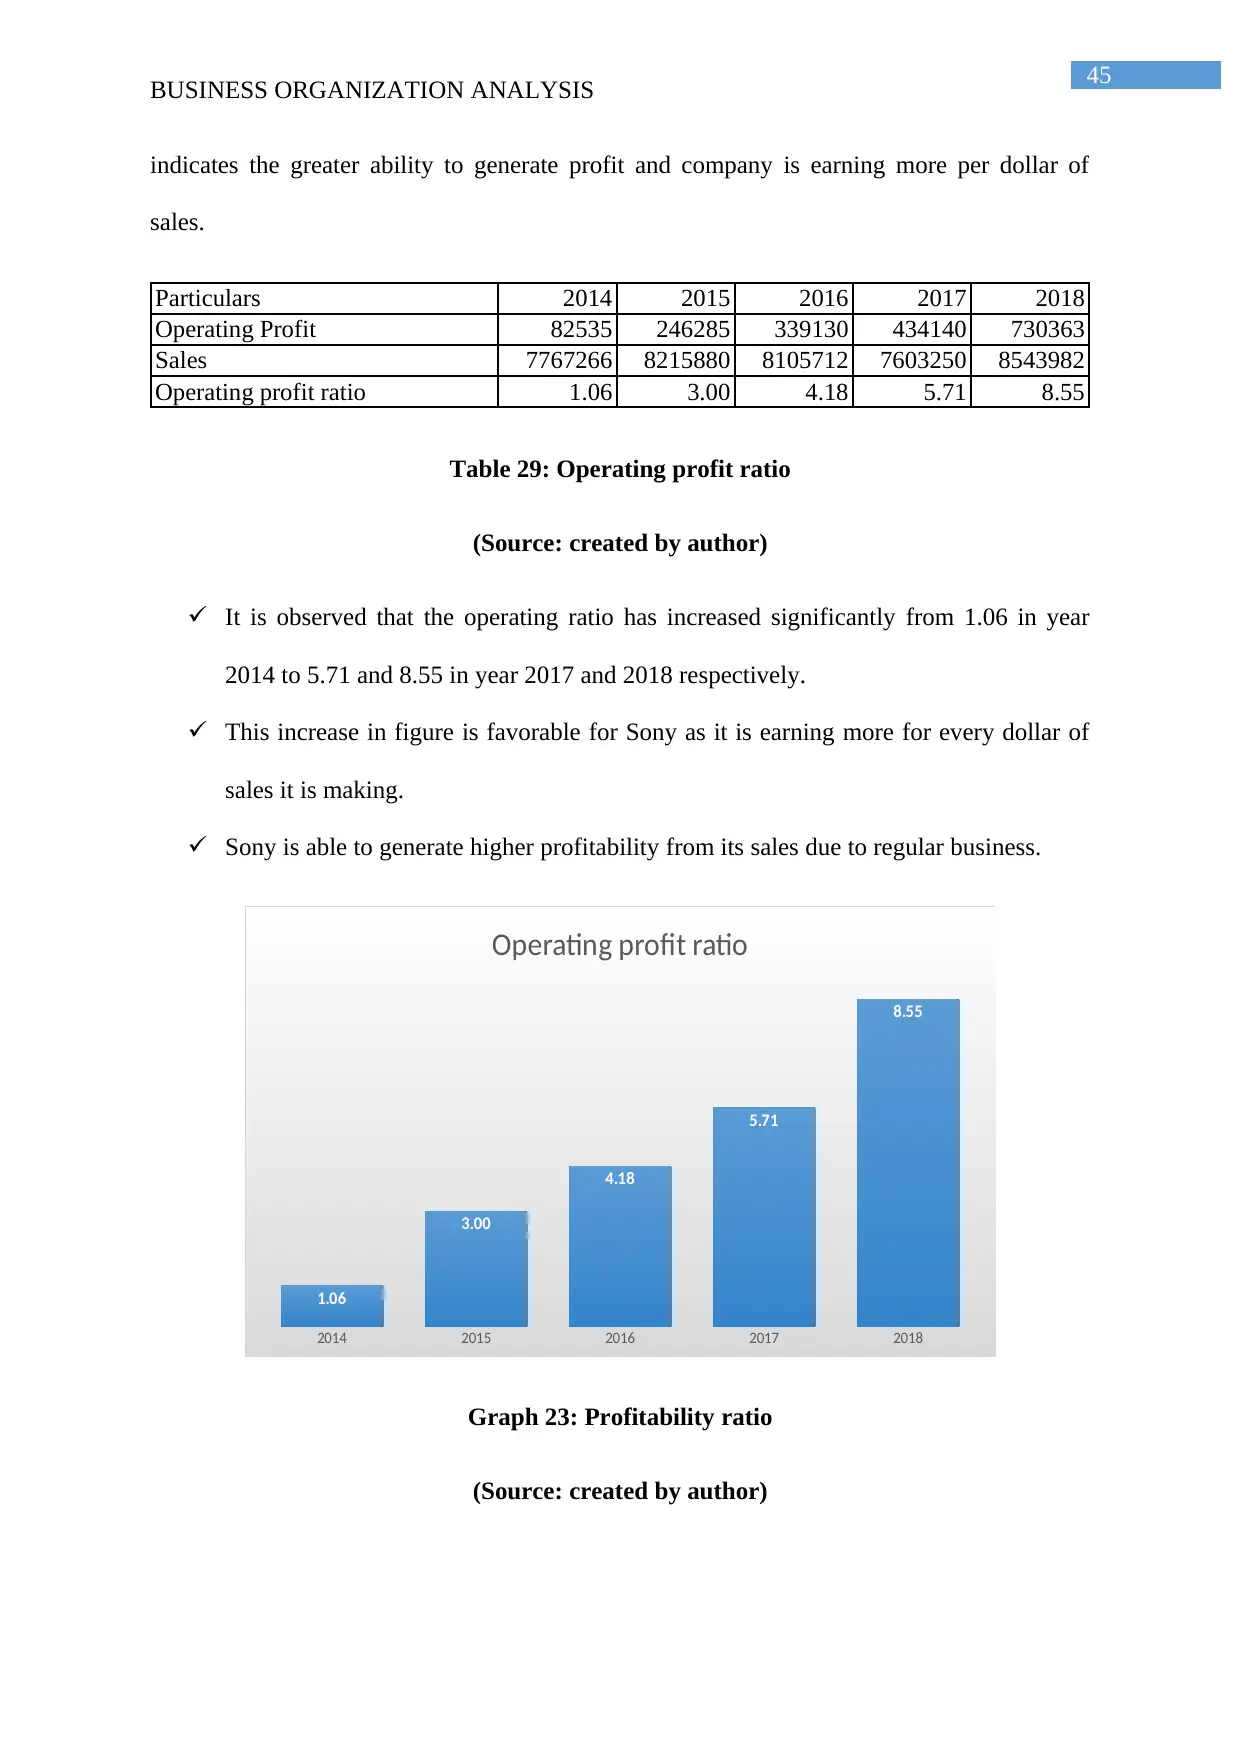
45
BUSINESS ORGANIZATION ANALYSIS
indicates the greater ability to generate profit and company is earning more per dollar of
sales.
Particulars 2014 2015 2016 2017 2018
Operating Profit 82535 246285 339130 434140 730363
Sales 7767266 8215880 8105712 7603250 8543982
Operating profit ratio 1.06 3.00 4.18 5.71 8.55
Table 29: Operating profit ratio
(Source: created by author)
It is observed that the operating ratio has increased significantly from 1.06 in year
2014 to 5.71 and 8.55 in year 2017 and 2018 respectively.
This increase in figure is favorable for Sony as it is earning more for every dollar of
sales it is making.
Sony is able to generate higher profitability from its sales due to regular business.
2014 2015 2016 2017 2018
1.06
3.00
4.18
5.71
8.55
Operating profit ratio
Graph 23: Profitability ratio
(Source: created by author)
Secure Best Marks with AI Grader
Need help grading? Try our AI Grader for instant feedback on your assignments.
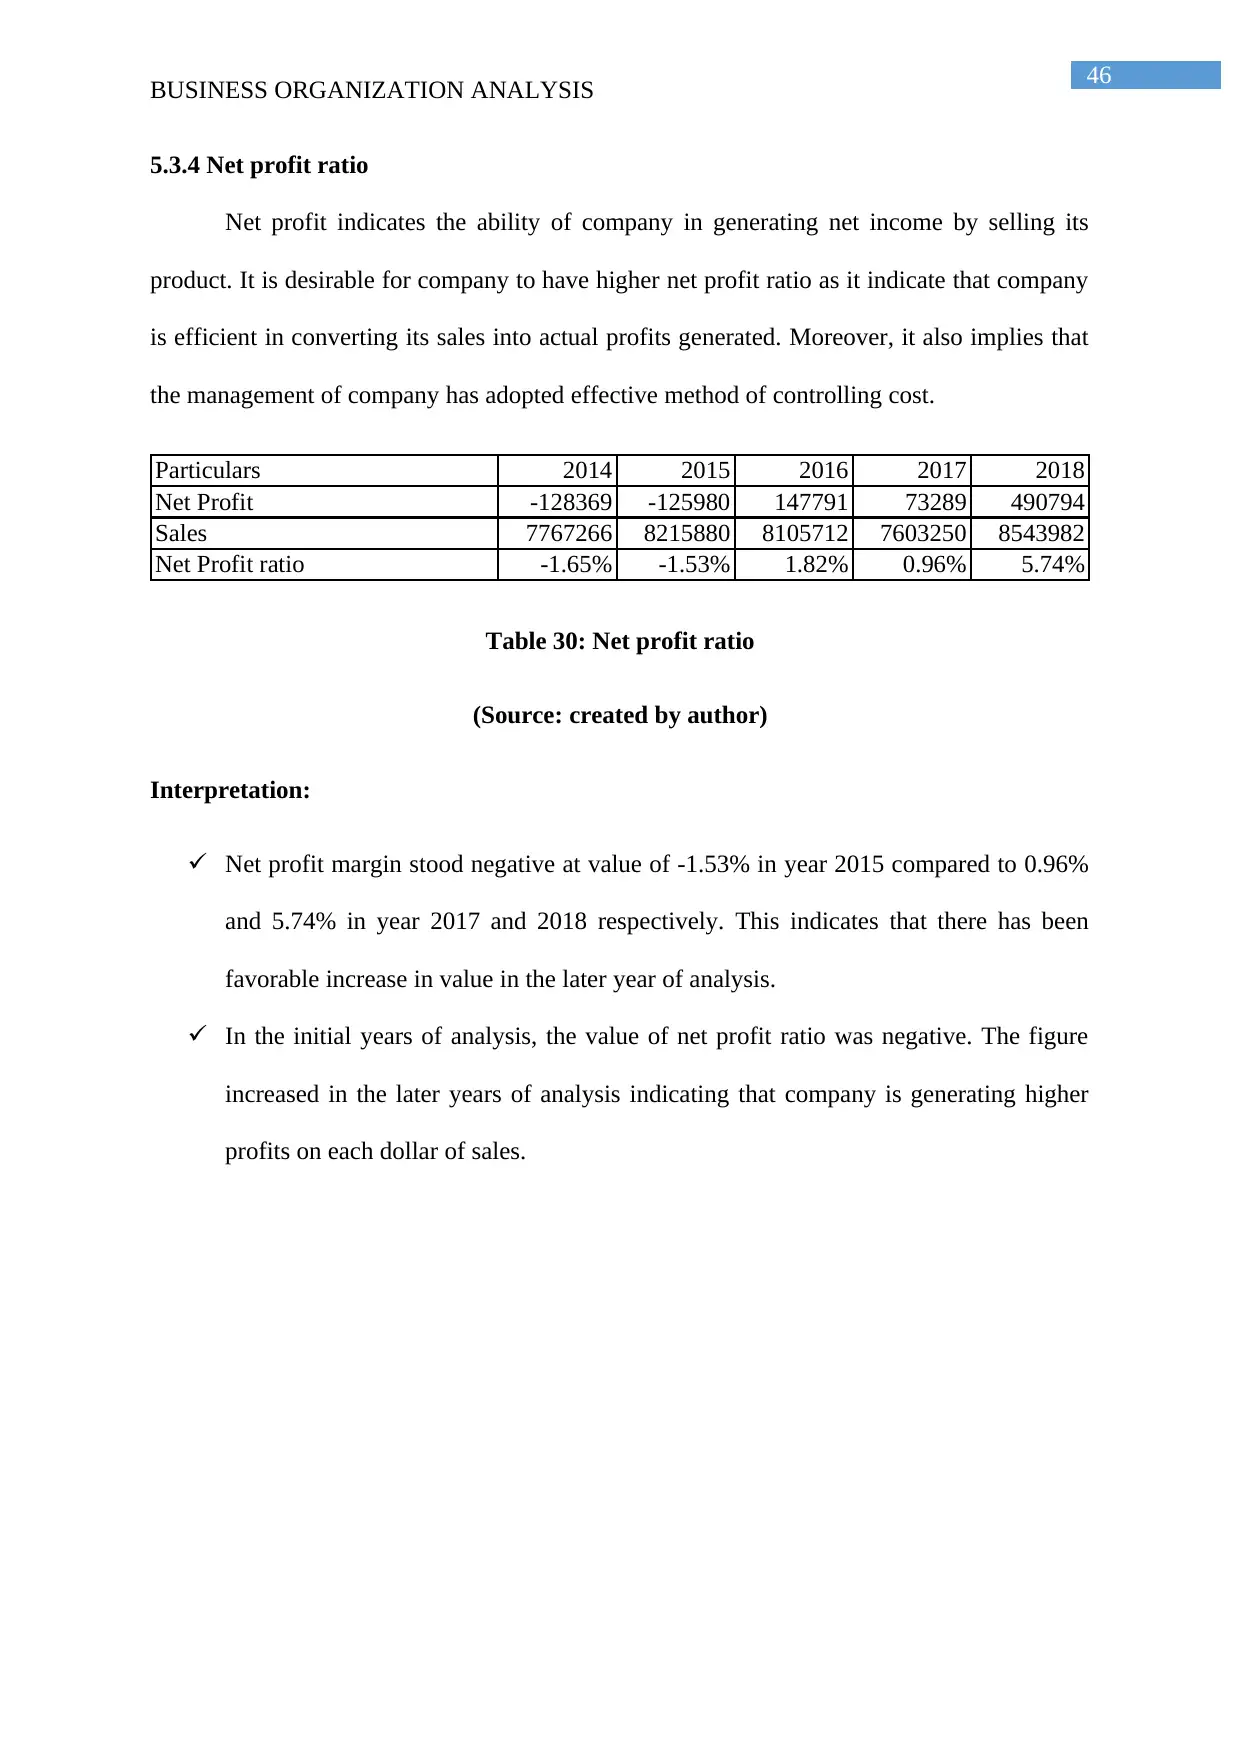
46
BUSINESS ORGANIZATION ANALYSIS
5.3.4 Net profit ratio
Net profit indicates the ability of company in generating net income by selling its
product. It is desirable for company to have higher net profit ratio as it indicate that company
is efficient in converting its sales into actual profits generated. Moreover, it also implies that
the management of company has adopted effective method of controlling cost.
Particulars 2014 2015 2016 2017 2018
Net Profit -128369 -125980 147791 73289 490794
Sales 7767266 8215880 8105712 7603250 8543982
Net Profit ratio -1.65% -1.53% 1.82% 0.96% 5.74%
Table 30: Net profit ratio
(Source: created by author)
Interpretation:
Net profit margin stood negative at value of -1.53% in year 2015 compared to 0.96%
and 5.74% in year 2017 and 2018 respectively. This indicates that there has been
favorable increase in value in the later year of analysis.
In the initial years of analysis, the value of net profit ratio was negative. The figure
increased in the later years of analysis indicating that company is generating higher
profits on each dollar of sales.
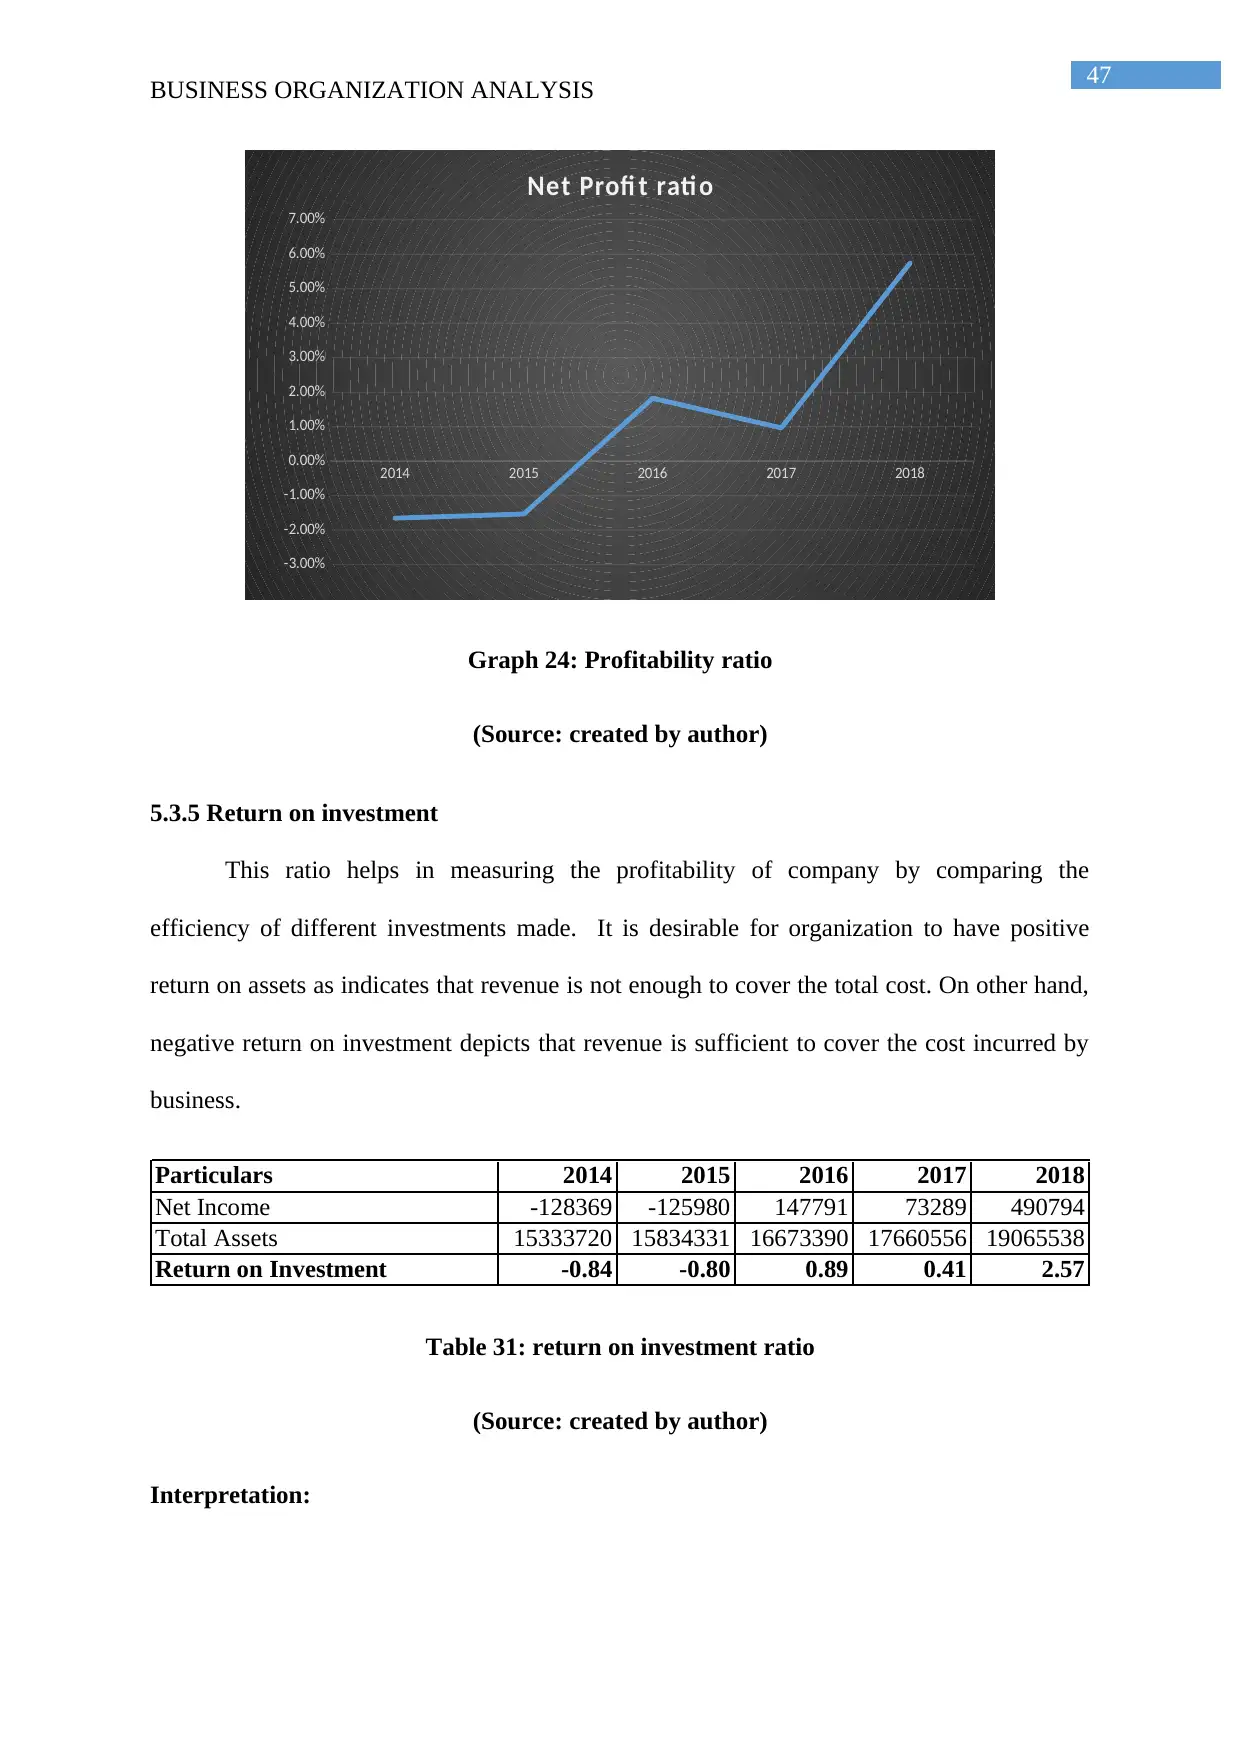
47
BUSINESS ORGANIZATION ANALYSIS
2014 2015 2016 2017 2018
-3.00%
-2.00%
-1.00%
0.00%
1.00%
2.00%
3.00%
4.00%
5.00%
6.00%
7.00%
Net Profi t rati o
Graph 24: Profitability ratio
(Source: created by author)
5.3.5 Return on investment
This ratio helps in measuring the profitability of company by comparing the
efficiency of different investments made. It is desirable for organization to have positive
return on assets as indicates that revenue is not enough to cover the total cost. On other hand,
negative return on investment depicts that revenue is sufficient to cover the cost incurred by
business.
Particulars 2014 2015 2016 2017 2018
Net Income -128369 -125980 147791 73289 490794
Total Assets 15333720 15834331 16673390 17660556 19065538
Return on Investment -0.84 -0.80 0.89 0.41 2.57
Table 31: return on investment ratio
(Source: created by author)
Interpretation:
48
BUSINESS ORGANIZATION ANALYSIS
It is observed that return on investment of Sony was negative in the initial years of
analysis and the return generated was positive in the later years of analysis.
The value of return on investment was negative at -0.80 in year 2015 compared to
0.41 and 2.57 in year 2017 and 2018 respectively.
Negative return on investment was attributable to net loss generated by business in the
initial years. The value increased because of increase in net income and amount of
total assets.
2014 2015 2016 2017 2018
-1.50
-1.00
-0.50
0.00
0.50
1.00
1.50
2.00
2.50
3.00
Return on Investment
Graph 25: Return on investment
(Source: created by author)
5.3.5 Return on equity
This ratio helps in measuring the profitability of company by evaluating the ability of
firms to generate profits from the investment made in shareholder equity. Return on equity is
obtained by dividing net income generated from sales of goods by the equity of shareholders.
It is desirable for firm to have higher return on equity indicating that shareholder money is
efficiently managed for generating profits.
Paraphrase This Document
Need a fresh take? Get an instant paraphrase of this document with our AI Paraphraser
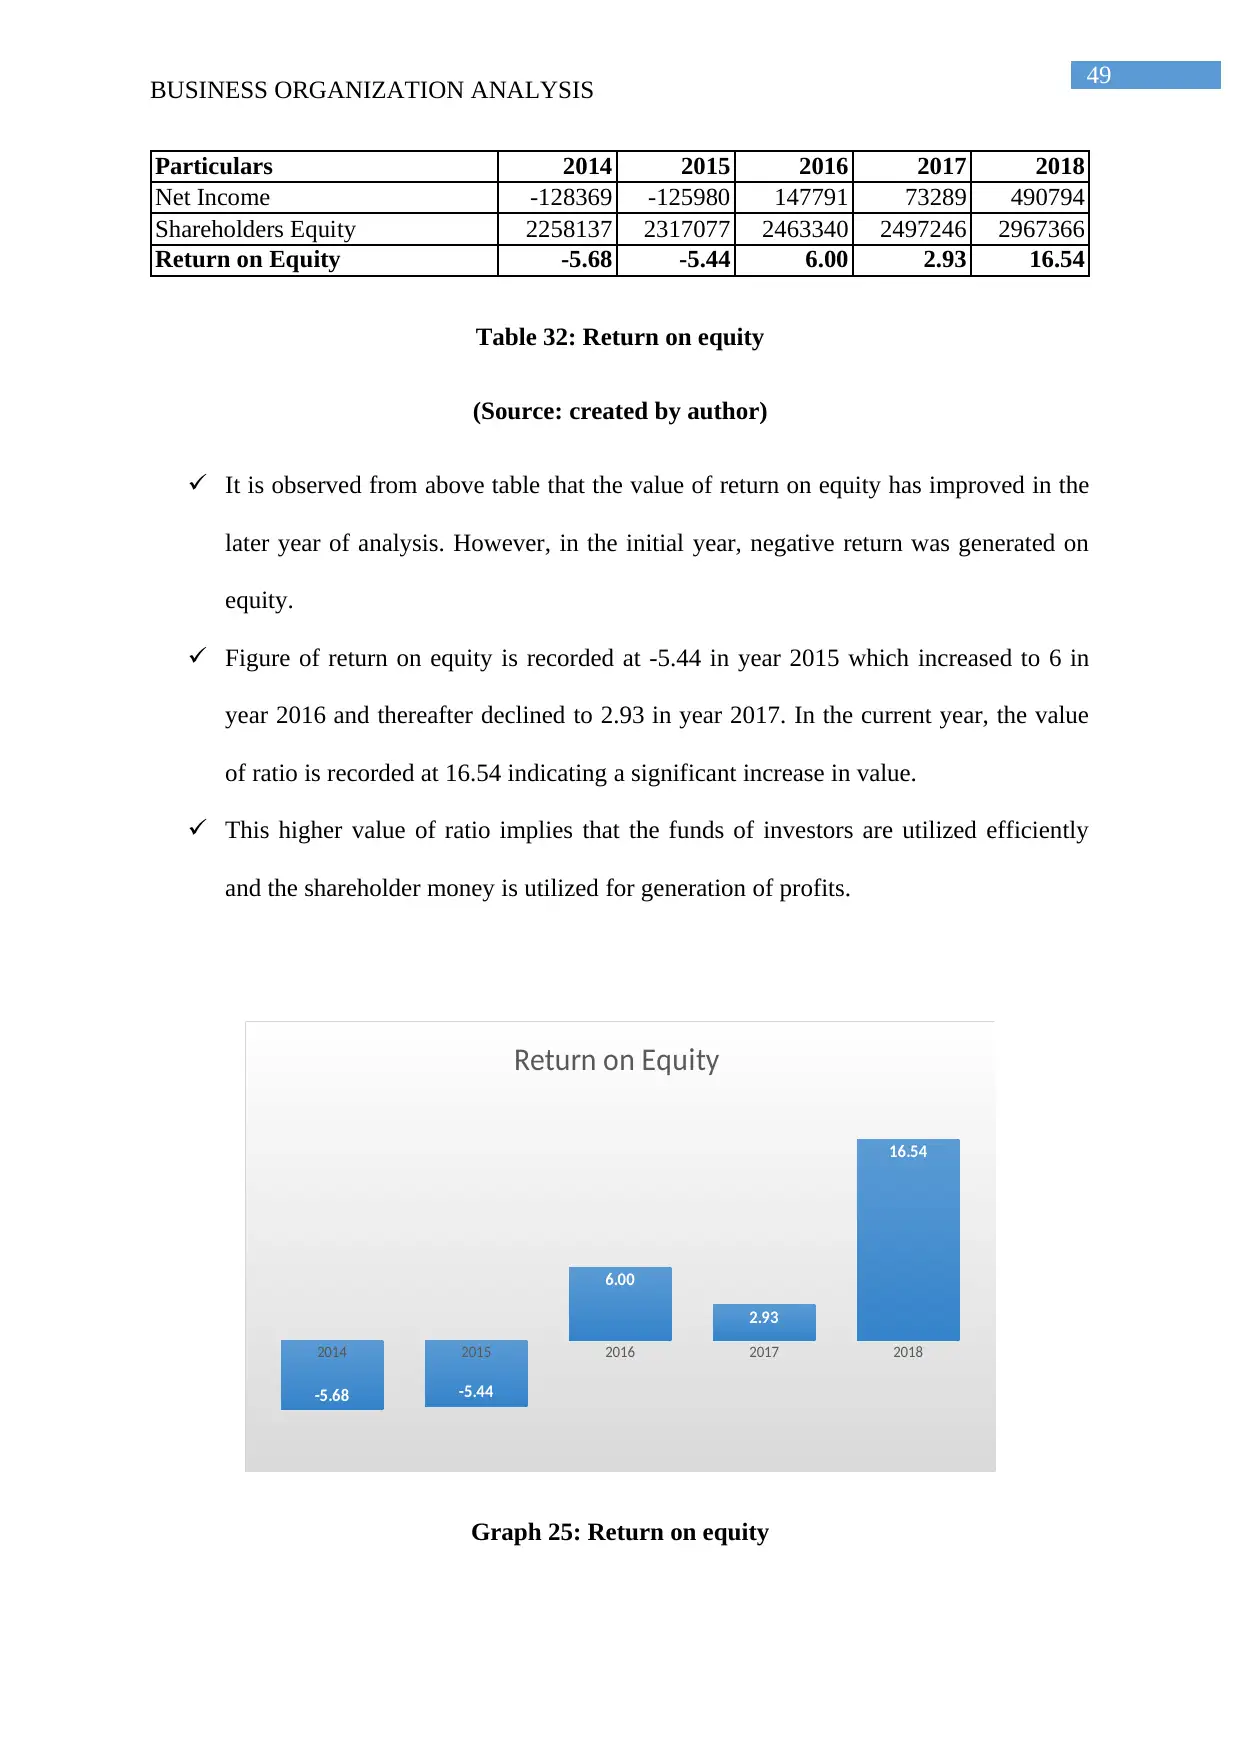
49
BUSINESS ORGANIZATION ANALYSIS
Particulars 2014 2015 2016 2017 2018
Net Income -128369 -125980 147791 73289 490794
Shareholders Equity 2258137 2317077 2463340 2497246 2967366
Return on Equity -5.68 -5.44 6.00 2.93 16.54
Table 32: Return on equity
(Source: created by author)
It is observed from above table that the value of return on equity has improved in the
later year of analysis. However, in the initial year, negative return was generated on
equity.
Figure of return on equity is recorded at -5.44 in year 2015 which increased to 6 in
year 2016 and thereafter declined to 2.93 in year 2017. In the current year, the value
of ratio is recorded at 16.54 indicating a significant increase in value.
This higher value of ratio implies that the funds of investors are utilized efficiently
and the shareholder money is utilized for generation of profits.
2014 2015 2016 2017 2018
-5.68 -5.44
6.00
2.93
16.54
Return on Equity
Graph 25: Return on equity
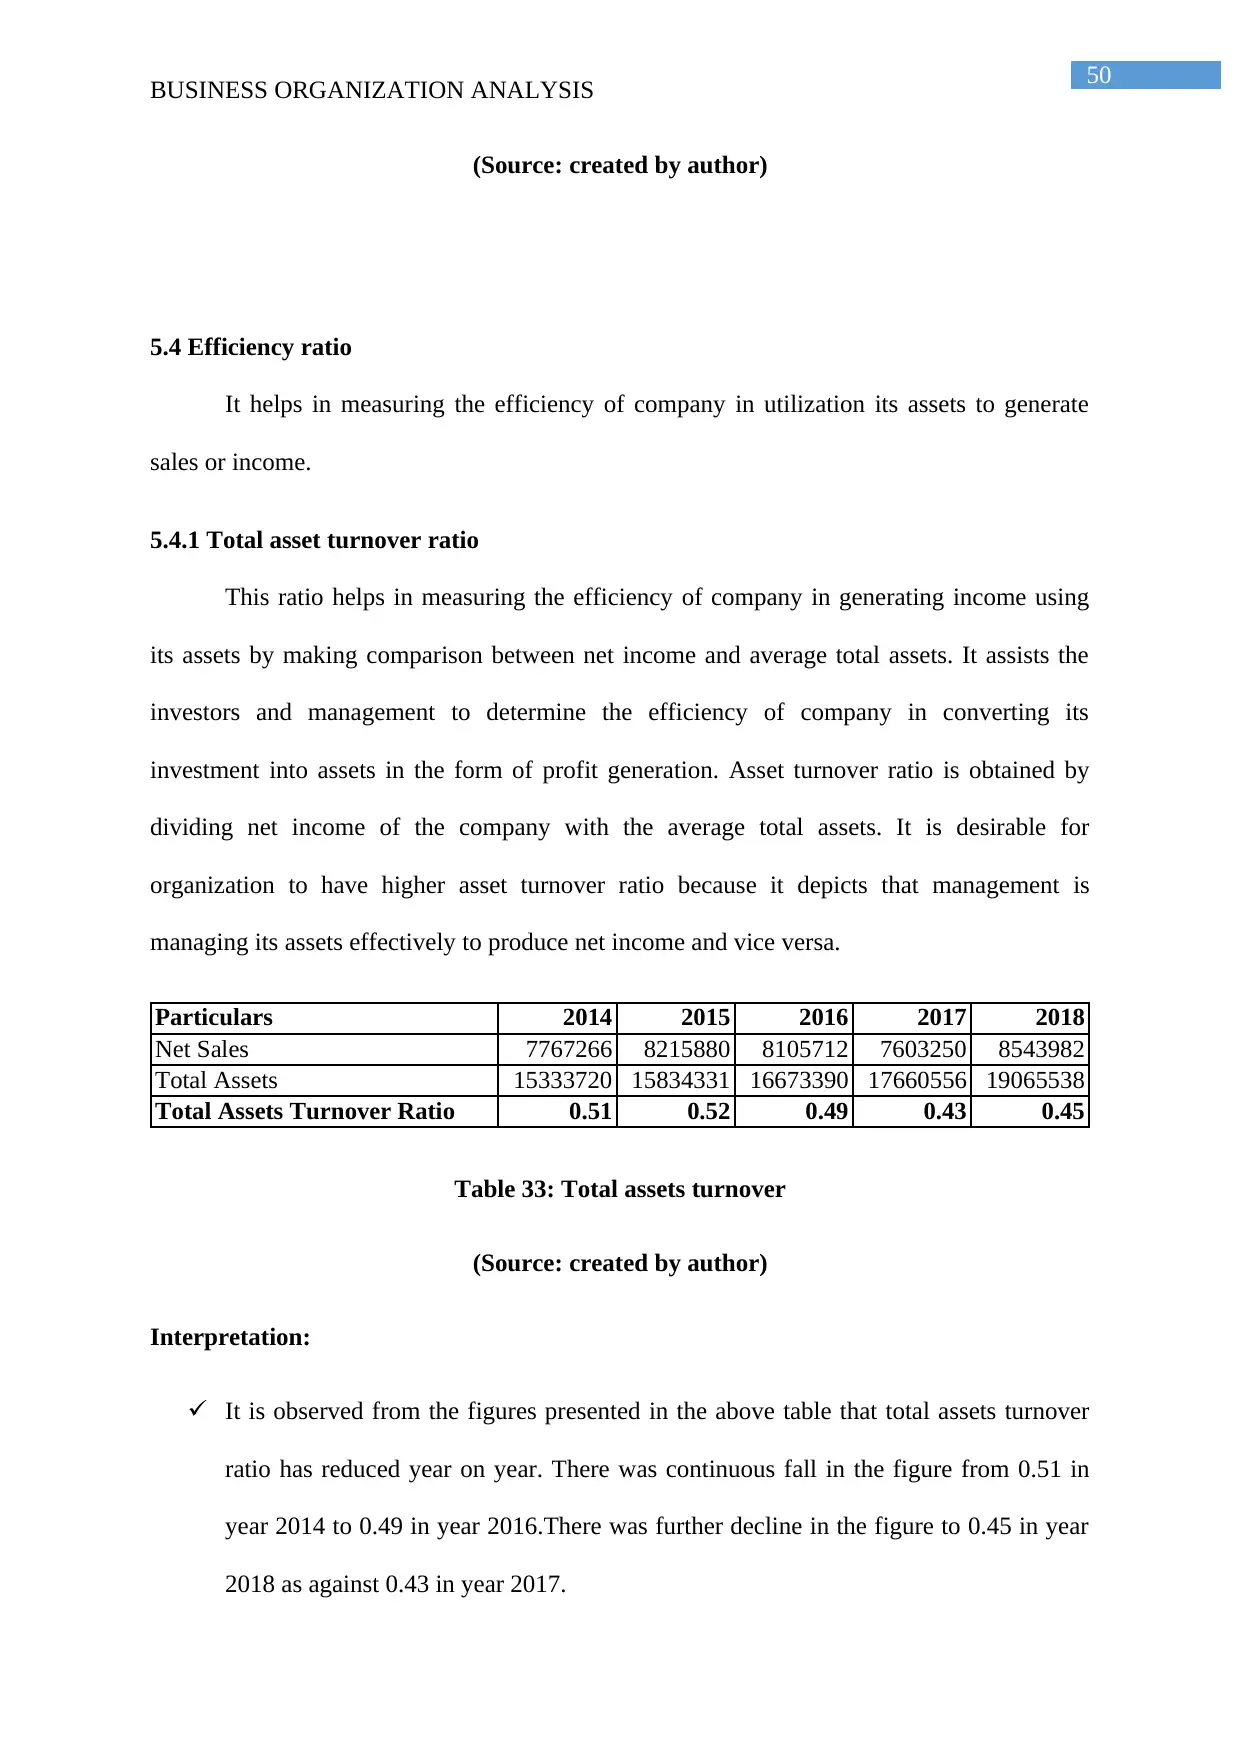
50
BUSINESS ORGANIZATION ANALYSIS
(Source: created by author)
5.4 Efficiency ratio
It helps in measuring the efficiency of company in utilization its assets to generate
sales or income.
5.4.1 Total asset turnover ratio
This ratio helps in measuring the efficiency of company in generating income using
its assets by making comparison between net income and average total assets. It assists the
investors and management to determine the efficiency of company in converting its
investment into assets in the form of profit generation. Asset turnover ratio is obtained by
dividing net income of the company with the average total assets. It is desirable for
organization to have higher asset turnover ratio because it depicts that management is
managing its assets effectively to produce net income and vice versa.
Particulars 2014 2015 2016 2017 2018
Net Sales 7767266 8215880 8105712 7603250 8543982
Total Assets 15333720 15834331 16673390 17660556 19065538
Total Assets Turnover Ratio 0.51 0.52 0.49 0.43 0.45
Table 33: Total assets turnover
(Source: created by author)
Interpretation:
It is observed from the figures presented in the above table that total assets turnover
ratio has reduced year on year. There was continuous fall in the figure from 0.51 in
year 2014 to 0.49 in year 2016.There was further decline in the figure to 0.45 in year
2018 as against 0.43 in year 2017.
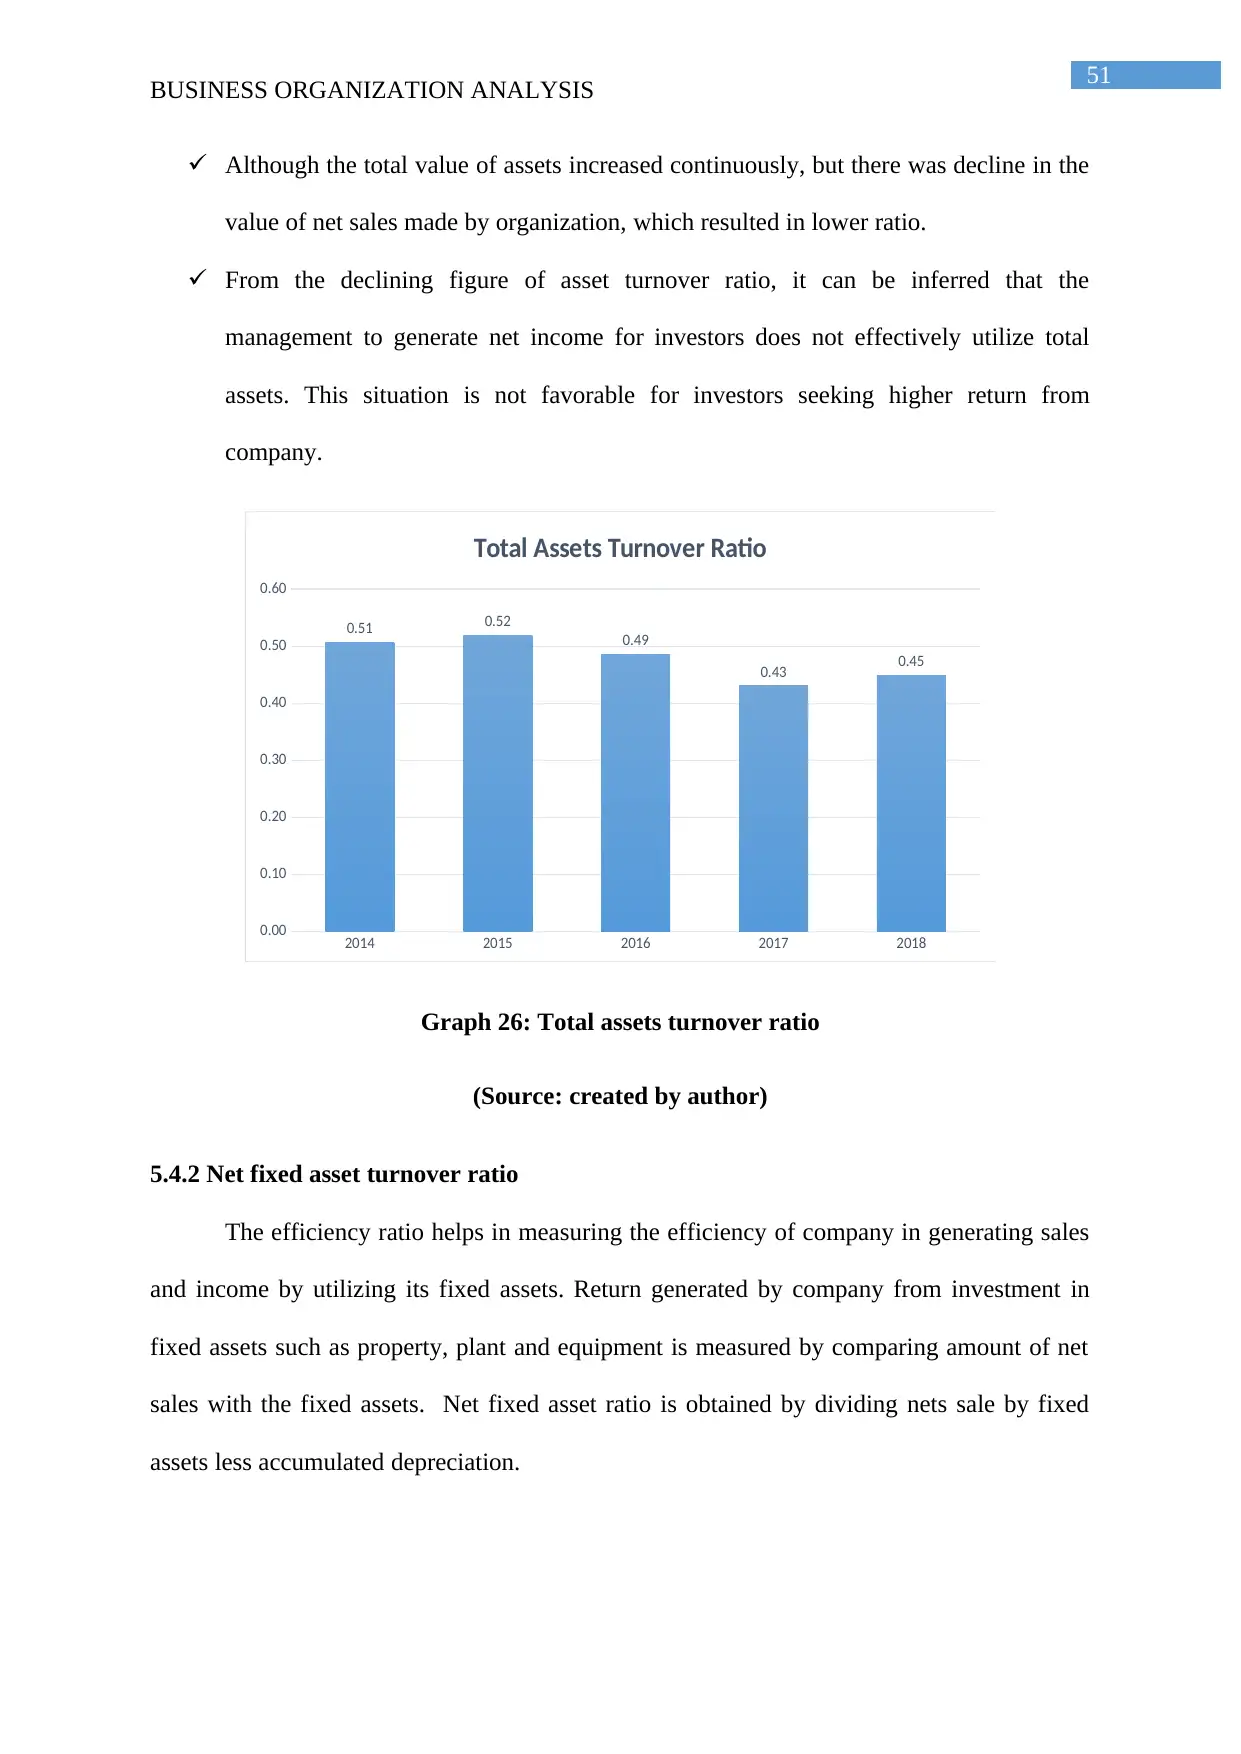
51
BUSINESS ORGANIZATION ANALYSIS
Although the total value of assets increased continuously, but there was decline in the
value of net sales made by organization, which resulted in lower ratio.
From the declining figure of asset turnover ratio, it can be inferred that the
management to generate net income for investors does not effectively utilize total
assets. This situation is not favorable for investors seeking higher return from
company.
2014 2015 2016 2017 2018
0.00
0.10
0.20
0.30
0.40
0.50
0.60
0.51 0.52
0.49
0.43 0.45
Total Assets Turnover Ratio
Graph 26: Total assets turnover ratio
(Source: created by author)
5.4.2 Net fixed asset turnover ratio
The efficiency ratio helps in measuring the efficiency of company in generating sales
and income by utilizing its fixed assets. Return generated by company from investment in
fixed assets such as property, plant and equipment is measured by comparing amount of net
sales with the fixed assets. Net fixed asset ratio is obtained by dividing nets sale by fixed
assets less accumulated depreciation.
Secure Best Marks with AI Grader
Need help grading? Try our AI Grader for instant feedback on your assignments.
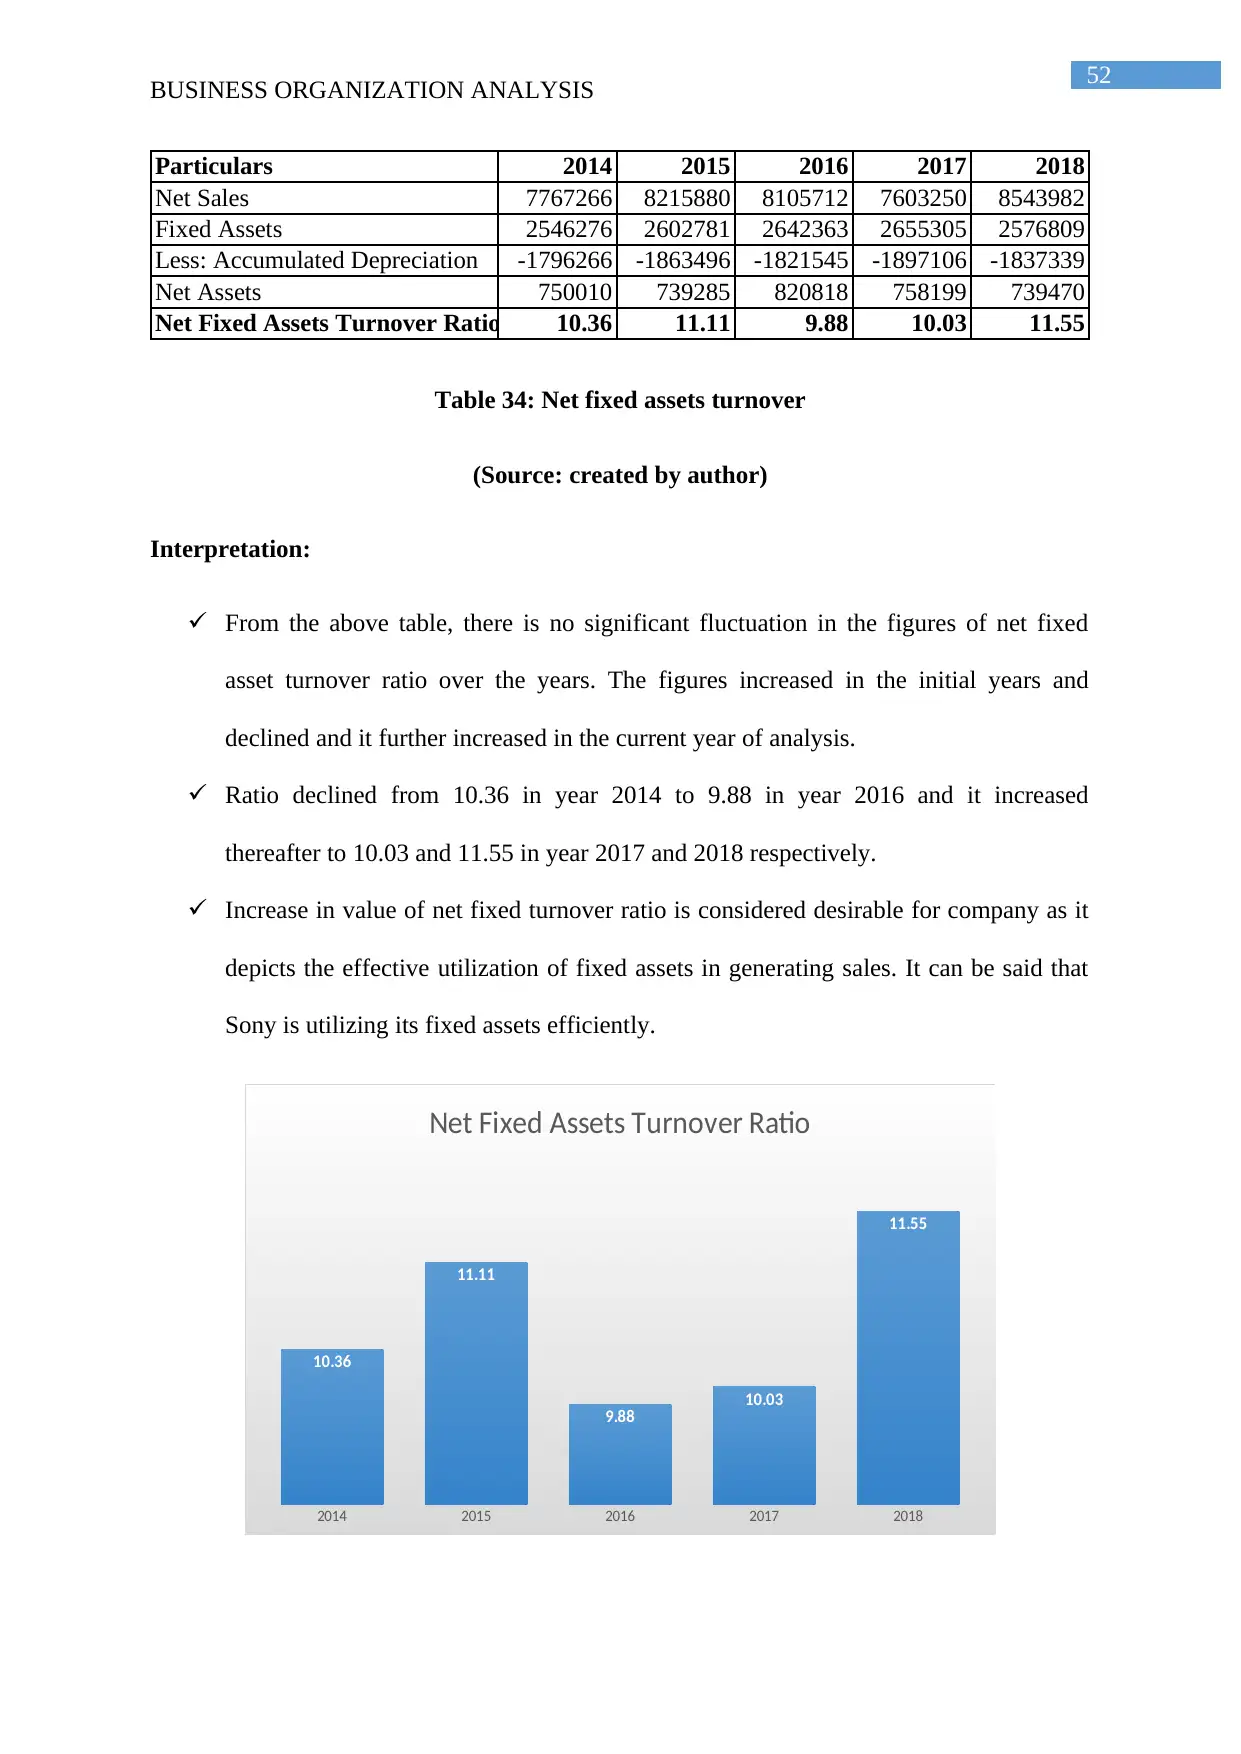
52
BUSINESS ORGANIZATION ANALYSIS
Particulars 2014 2015 2016 2017 2018
Net Sales 7767266 8215880 8105712 7603250 8543982
Fixed Assets 2546276 2602781 2642363 2655305 2576809
Less: Accumulated Depreciation -1796266 -1863496 -1821545 -1897106 -1837339
Net Assets 750010 739285 820818 758199 739470
Net Fixed Assets Turnover Ratio 10.36 11.11 9.88 10.03 11.55
Table 34: Net fixed assets turnover
(Source: created by author)
Interpretation:
From the above table, there is no significant fluctuation in the figures of net fixed
asset turnover ratio over the years. The figures increased in the initial years and
declined and it further increased in the current year of analysis.
Ratio declined from 10.36 in year 2014 to 9.88 in year 2016 and it increased
thereafter to 10.03 and 11.55 in year 2017 and 2018 respectively.
Increase in value of net fixed turnover ratio is considered desirable for company as it
depicts the effective utilization of fixed assets in generating sales. It can be said that
Sony is utilizing its fixed assets efficiently.
2014 2015 2016 2017 2018
10.36
11.11
9.88 10.03
11.55
Net Fixed Assets Turnover Ratio
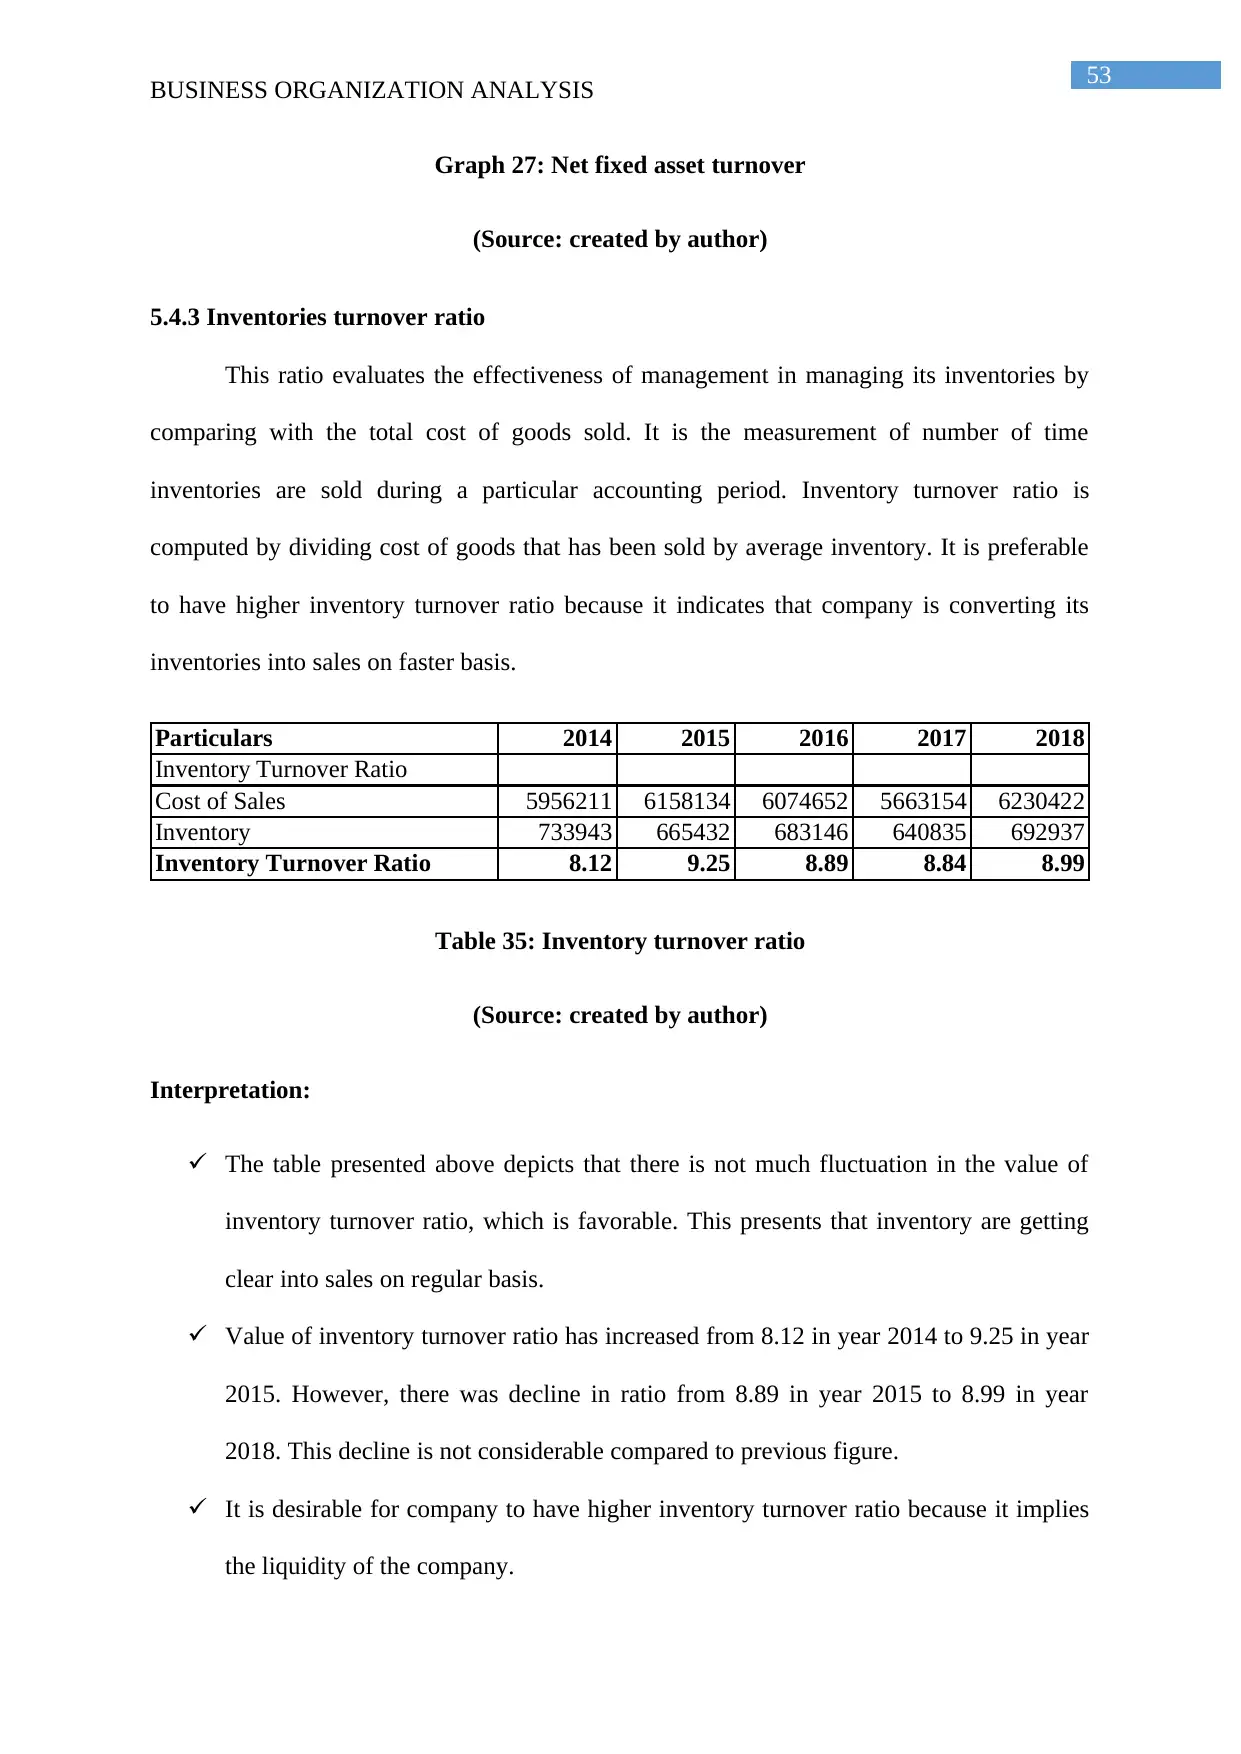
53
BUSINESS ORGANIZATION ANALYSIS
Graph 27: Net fixed asset turnover
(Source: created by author)
5.4.3 Inventories turnover ratio
This ratio evaluates the effectiveness of management in managing its inventories by
comparing with the total cost of goods sold. It is the measurement of number of time
inventories are sold during a particular accounting period. Inventory turnover ratio is
computed by dividing cost of goods that has been sold by average inventory. It is preferable
to have higher inventory turnover ratio because it indicates that company is converting its
inventories into sales on faster basis.
Particulars 2014 2015 2016 2017 2018
Inventory Turnover Ratio
Cost of Sales 5956211 6158134 6074652 5663154 6230422
Inventory 733943 665432 683146 640835 692937
Inventory Turnover Ratio 8.12 9.25 8.89 8.84 8.99
Table 35: Inventory turnover ratio
(Source: created by author)
Interpretation:
The table presented above depicts that there is not much fluctuation in the value of
inventory turnover ratio, which is favorable. This presents that inventory are getting
clear into sales on regular basis.
Value of inventory turnover ratio has increased from 8.12 in year 2014 to 9.25 in year
2015. However, there was decline in ratio from 8.89 in year 2015 to 8.99 in year
2018. This decline is not considerable compared to previous figure.
It is desirable for company to have higher inventory turnover ratio because it implies
the liquidity of the company.
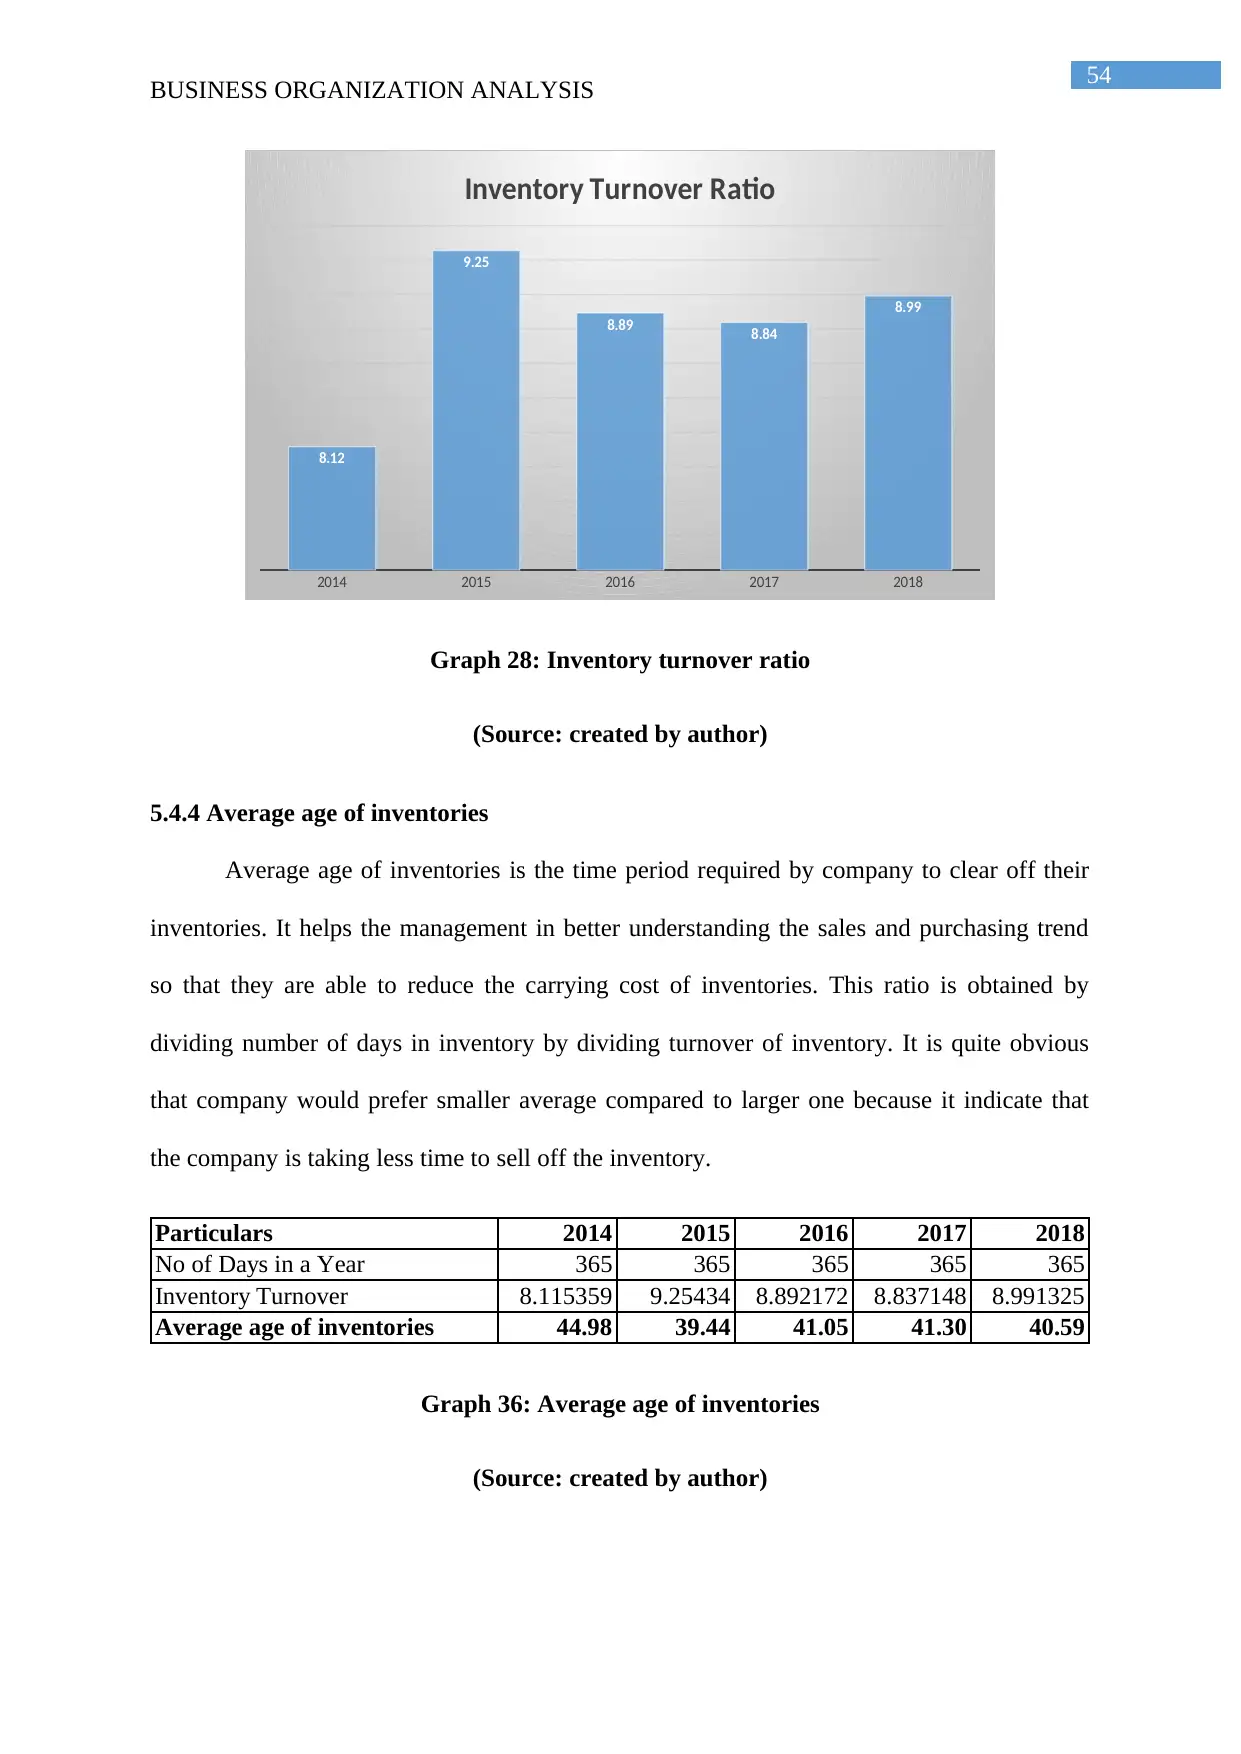
54
BUSINESS ORGANIZATION ANALYSIS
2014 2015 2016 2017 2018
8.12
9.25
8.89 8.84
8.99
Inventory Turnover Ratio
Graph 28: Inventory turnover ratio
(Source: created by author)
5.4.4 Average age of inventories
Average age of inventories is the time period required by company to clear off their
inventories. It helps the management in better understanding the sales and purchasing trend
so that they are able to reduce the carrying cost of inventories. This ratio is obtained by
dividing number of days in inventory by dividing turnover of inventory. It is quite obvious
that company would prefer smaller average compared to larger one because it indicate that
the company is taking less time to sell off the inventory.
Particulars 2014 2015 2016 2017 2018
No of Days in a Year 365 365 365 365 365
Inventory Turnover 8.115359 9.25434 8.892172 8.837148 8.991325
Average age of inventories 44.98 39.44 41.05 41.30 40.59
Graph 36: Average age of inventories
(Source: created by author)
Paraphrase This Document
Need a fresh take? Get an instant paraphrase of this document with our AI Paraphraser
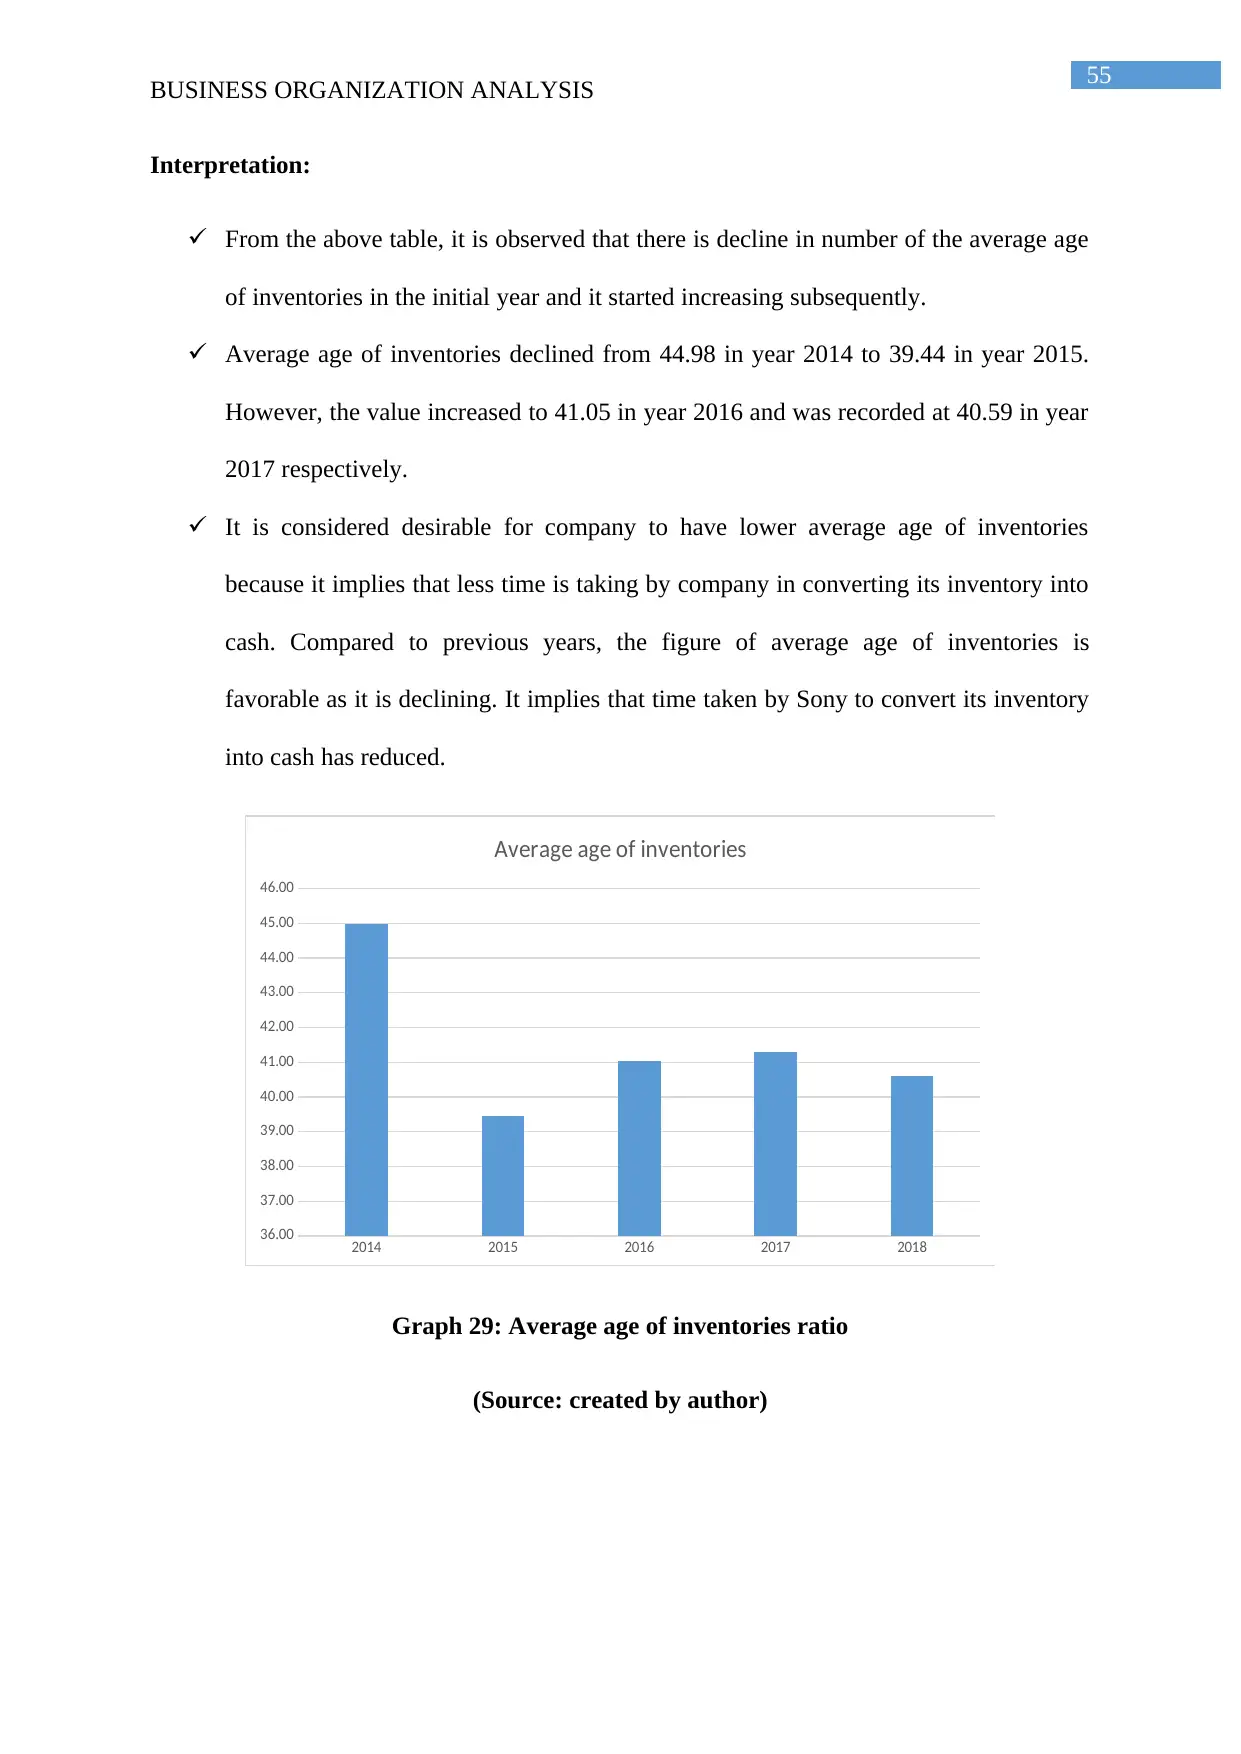
55
BUSINESS ORGANIZATION ANALYSIS
Interpretation:
From the above table, it is observed that there is decline in number of the average age
of inventories in the initial year and it started increasing subsequently.
Average age of inventories declined from 44.98 in year 2014 to 39.44 in year 2015.
However, the value increased to 41.05 in year 2016 and was recorded at 40.59 in year
2017 respectively.
It is considered desirable for company to have lower average age of inventories
because it implies that less time is taking by company in converting its inventory into
cash. Compared to previous years, the figure of average age of inventories is
favorable as it is declining. It implies that time taken by Sony to convert its inventory
into cash has reduced.
2014 2015 2016 2017 2018
36.00
37.00
38.00
39.00
40.00
41.00
42.00
43.00
44.00
45.00
46.00
Average age of inventories
Graph 29: Average age of inventories ratio
(Source: created by author)
56
BUSINESS ORGANIZATION ANALYSIS
5.4.5 Debtor turnover ratio
It is an efficiency ratio that helps in measuring the number of times that business
would take to convert its debtor and accounts receivable into cash during particular period of
time. The efficiency of company in collecting the receivable from credit sales is indicated
from debtor turnover ratio. It is obtained by dividing total amount of net credit sales by
average accounts receivables. It is desirable to have higher ratio compared to lower ratio
because it indicates that receivables are collected more frequently.
Particulars 2014 2015 2016 2017 2018
Sales 7767266 8215880 8105712 7603250 8543982
Average Debtors 871040 899902 853592 953811 1012779
Debtors Turnover Ratio 8.92 9.13 9.50 7.97 8.44
Table 37: Debtor turnover ratio
(Source: created by author)
Interpretation:
From the table, it is observed that the value of ratio increased in the initial years of
analysis and it declined thereafter. Total number of times of collecting the sales has
increased in the current year.
Ratio has increased from 8.92 in year 2014 as against 9.50 in year 2016 and it
declined thereafter to 7.97 and 8.44 in year 2017 and 2018 respectively.
This fall in ratio is not desirable for company as it indicates that the number of times
credit sales are collected has reduced which implies that cash is locked in credit sales
made.
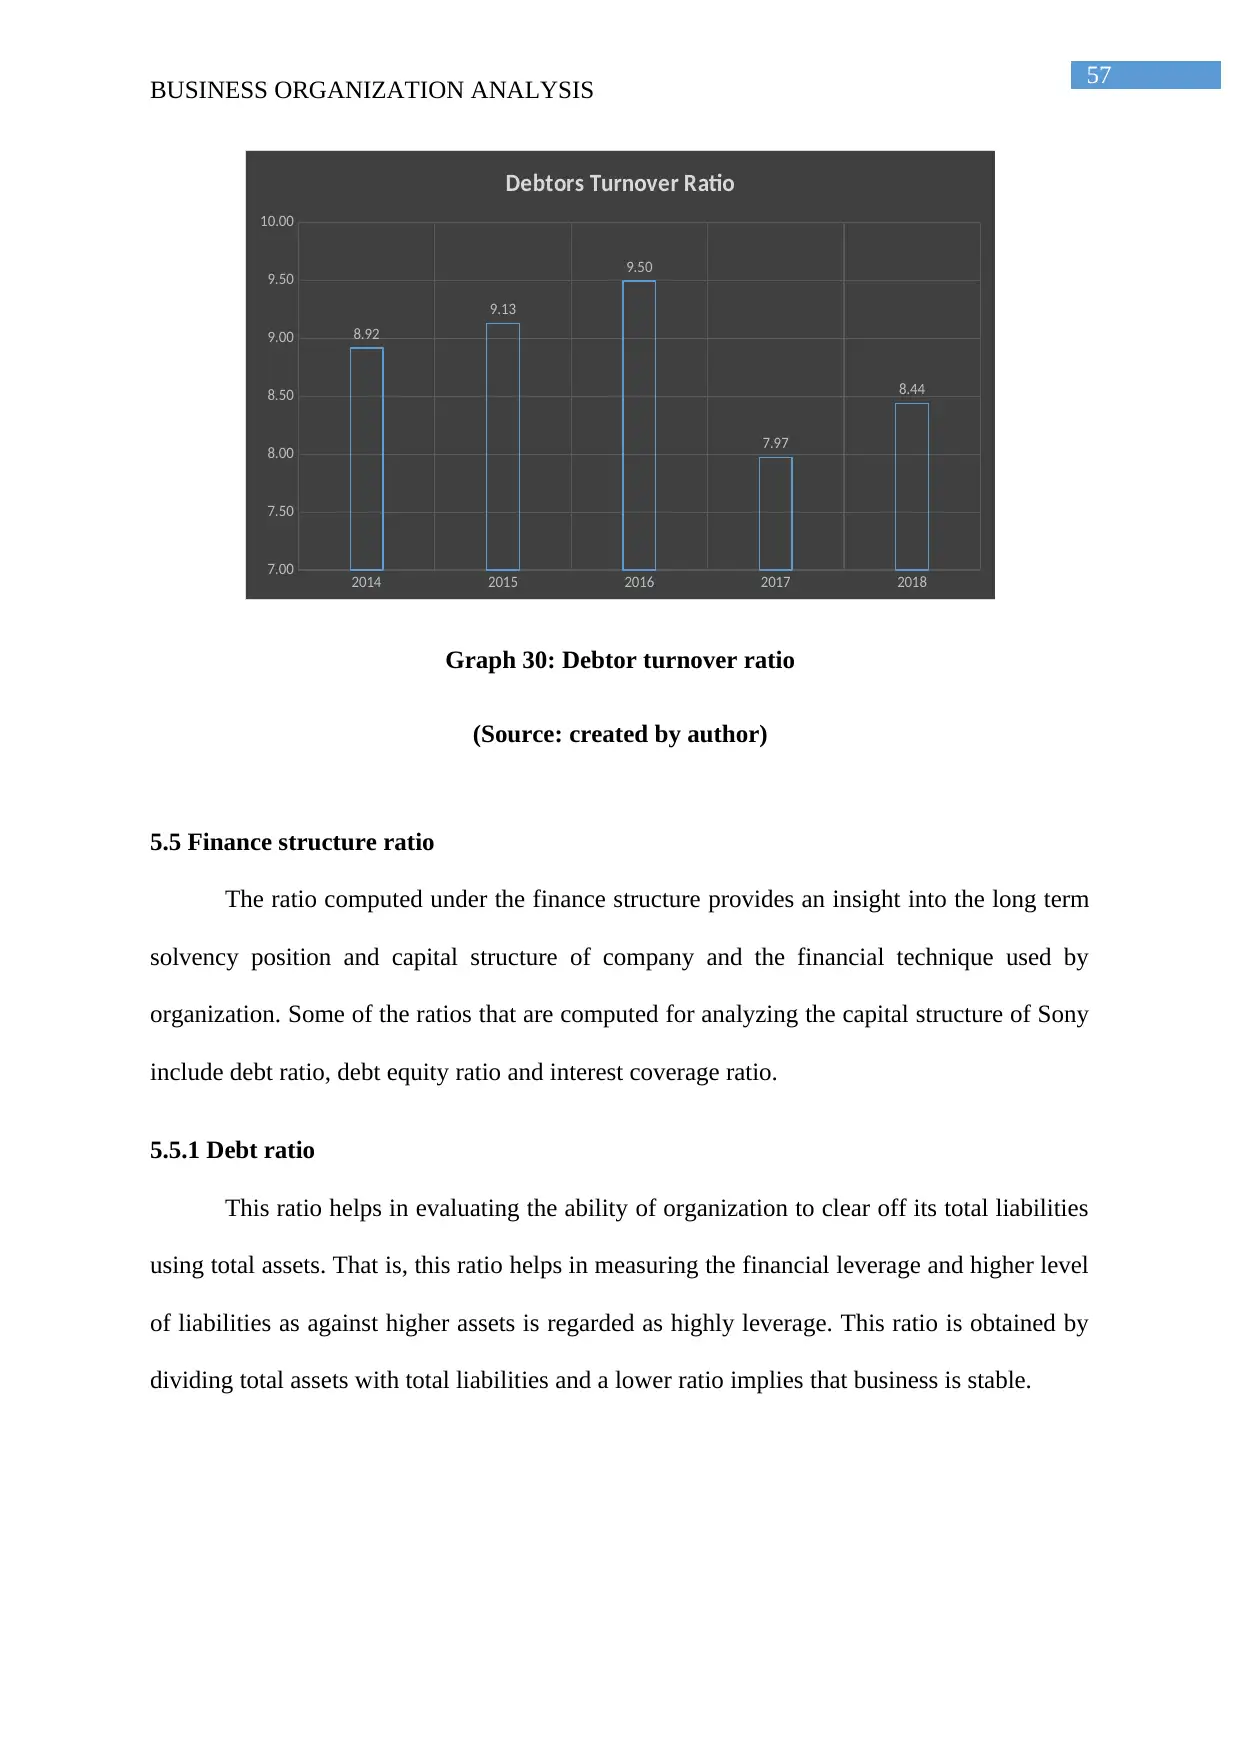
57
BUSINESS ORGANIZATION ANALYSIS
2014 2015 2016 2017 2018
7.00
7.50
8.00
8.50
9.00
9.50
10.00
8.92
9.13
9.50
7.97
8.44
Debtors Turnover Ratio
Graph 30: Debtor turnover ratio
(Source: created by author)
5.5 Finance structure ratio
The ratio computed under the finance structure provides an insight into the long term
solvency position and capital structure of company and the financial technique used by
organization. Some of the ratios that are computed for analyzing the capital structure of Sony
include debt ratio, debt equity ratio and interest coverage ratio.
5.5.1 Debt ratio
This ratio helps in evaluating the ability of organization to clear off its total liabilities
using total assets. That is, this ratio helps in measuring the financial leverage and higher level
of liabilities as against higher assets is regarded as highly leverage. This ratio is obtained by
dividing total assets with total liabilities and a lower ratio implies that business is stable.
Secure Best Marks with AI Grader
Need help grading? Try our AI Grader for instant feedback on your assignments.
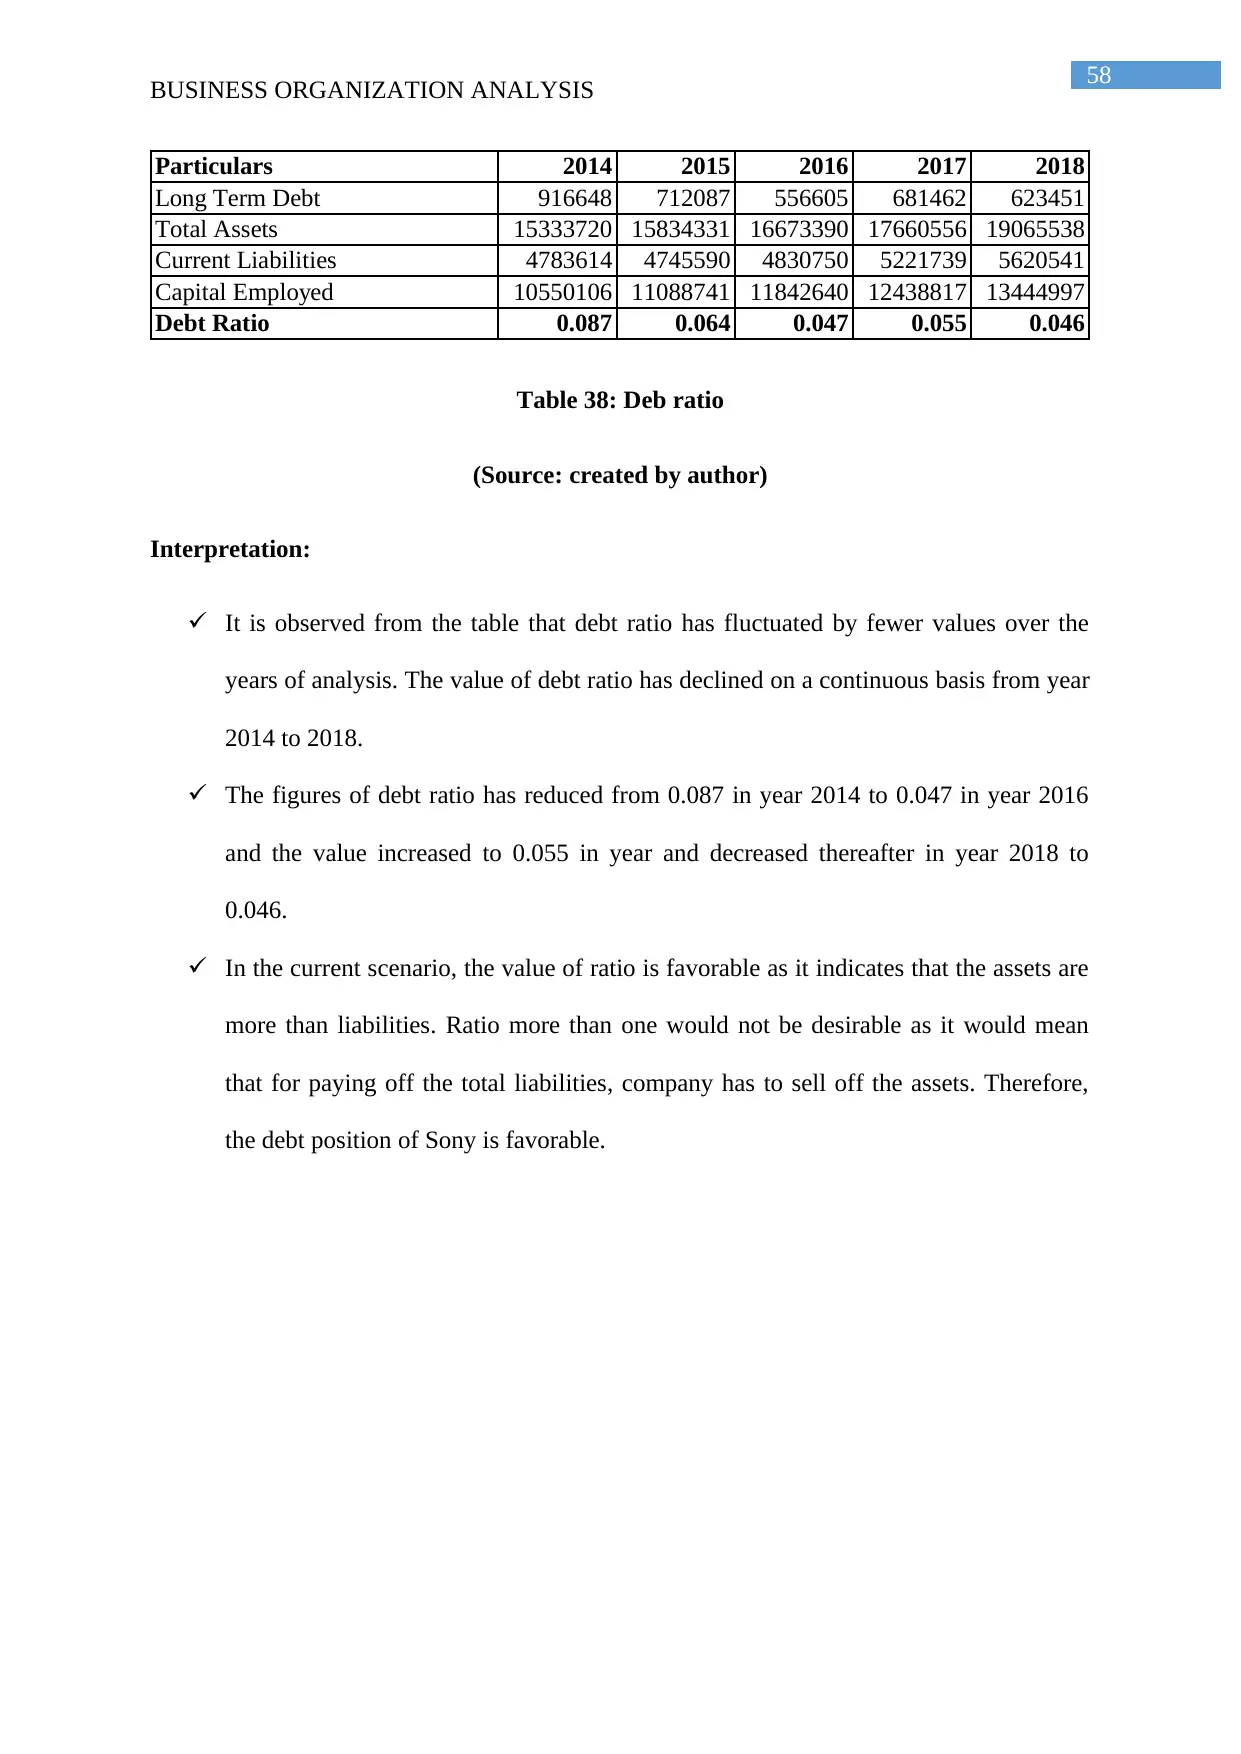
58
BUSINESS ORGANIZATION ANALYSIS
Particulars 2014 2015 2016 2017 2018
Long Term Debt 916648 712087 556605 681462 623451
Total Assets 15333720 15834331 16673390 17660556 19065538
Current Liabilities 4783614 4745590 4830750 5221739 5620541
Capital Employed 10550106 11088741 11842640 12438817 13444997
Debt Ratio 0.087 0.064 0.047 0.055 0.046
Table 38: Deb ratio
(Source: created by author)
Interpretation:
It is observed from the table that debt ratio has fluctuated by fewer values over the
years of analysis. The value of debt ratio has declined on a continuous basis from year
2014 to 2018.
The figures of debt ratio has reduced from 0.087 in year 2014 to 0.047 in year 2016
and the value increased to 0.055 in year and decreased thereafter in year 2018 to
0.046.
In the current scenario, the value of ratio is favorable as it indicates that the assets are
more than liabilities. Ratio more than one would not be desirable as it would mean
that for paying off the total liabilities, company has to sell off the assets. Therefore,
the debt position of Sony is favorable.
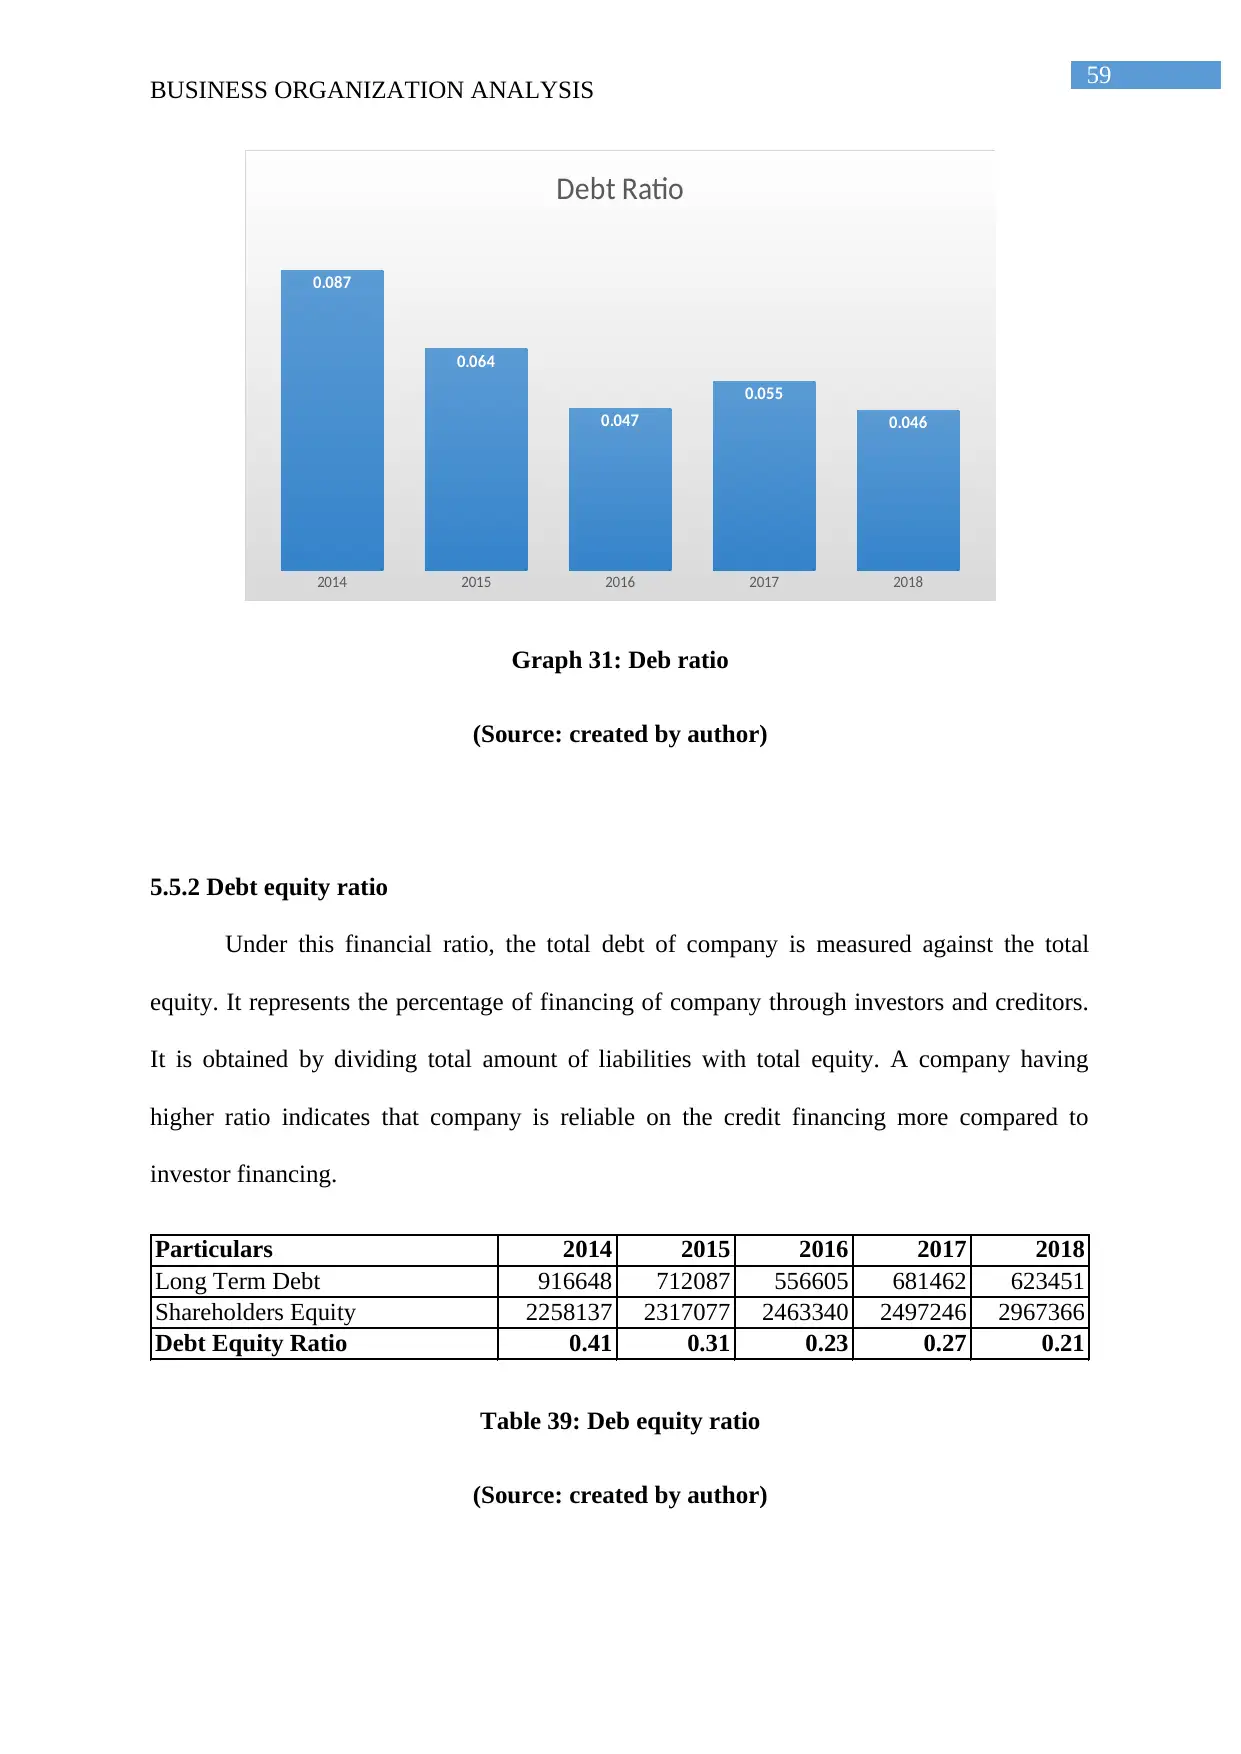
59
BUSINESS ORGANIZATION ANALYSIS
2014 2015 2016 2017 2018
0.087
0.064
0.047
0.055
0.046
Debt Ratio
Graph 31: Deb ratio
(Source: created by author)
5.5.2 Debt equity ratio
Under this financial ratio, the total debt of company is measured against the total
equity. It represents the percentage of financing of company through investors and creditors.
It is obtained by dividing total amount of liabilities with total equity. A company having
higher ratio indicates that company is reliable on the credit financing more compared to
investor financing.
Particulars 2014 2015 2016 2017 2018
Long Term Debt 916648 712087 556605 681462 623451
Shareholders Equity 2258137 2317077 2463340 2497246 2967366
Debt Equity Ratio 0.41 0.31 0.23 0.27 0.21
Table 39: Deb equity ratio
(Source: created by author)
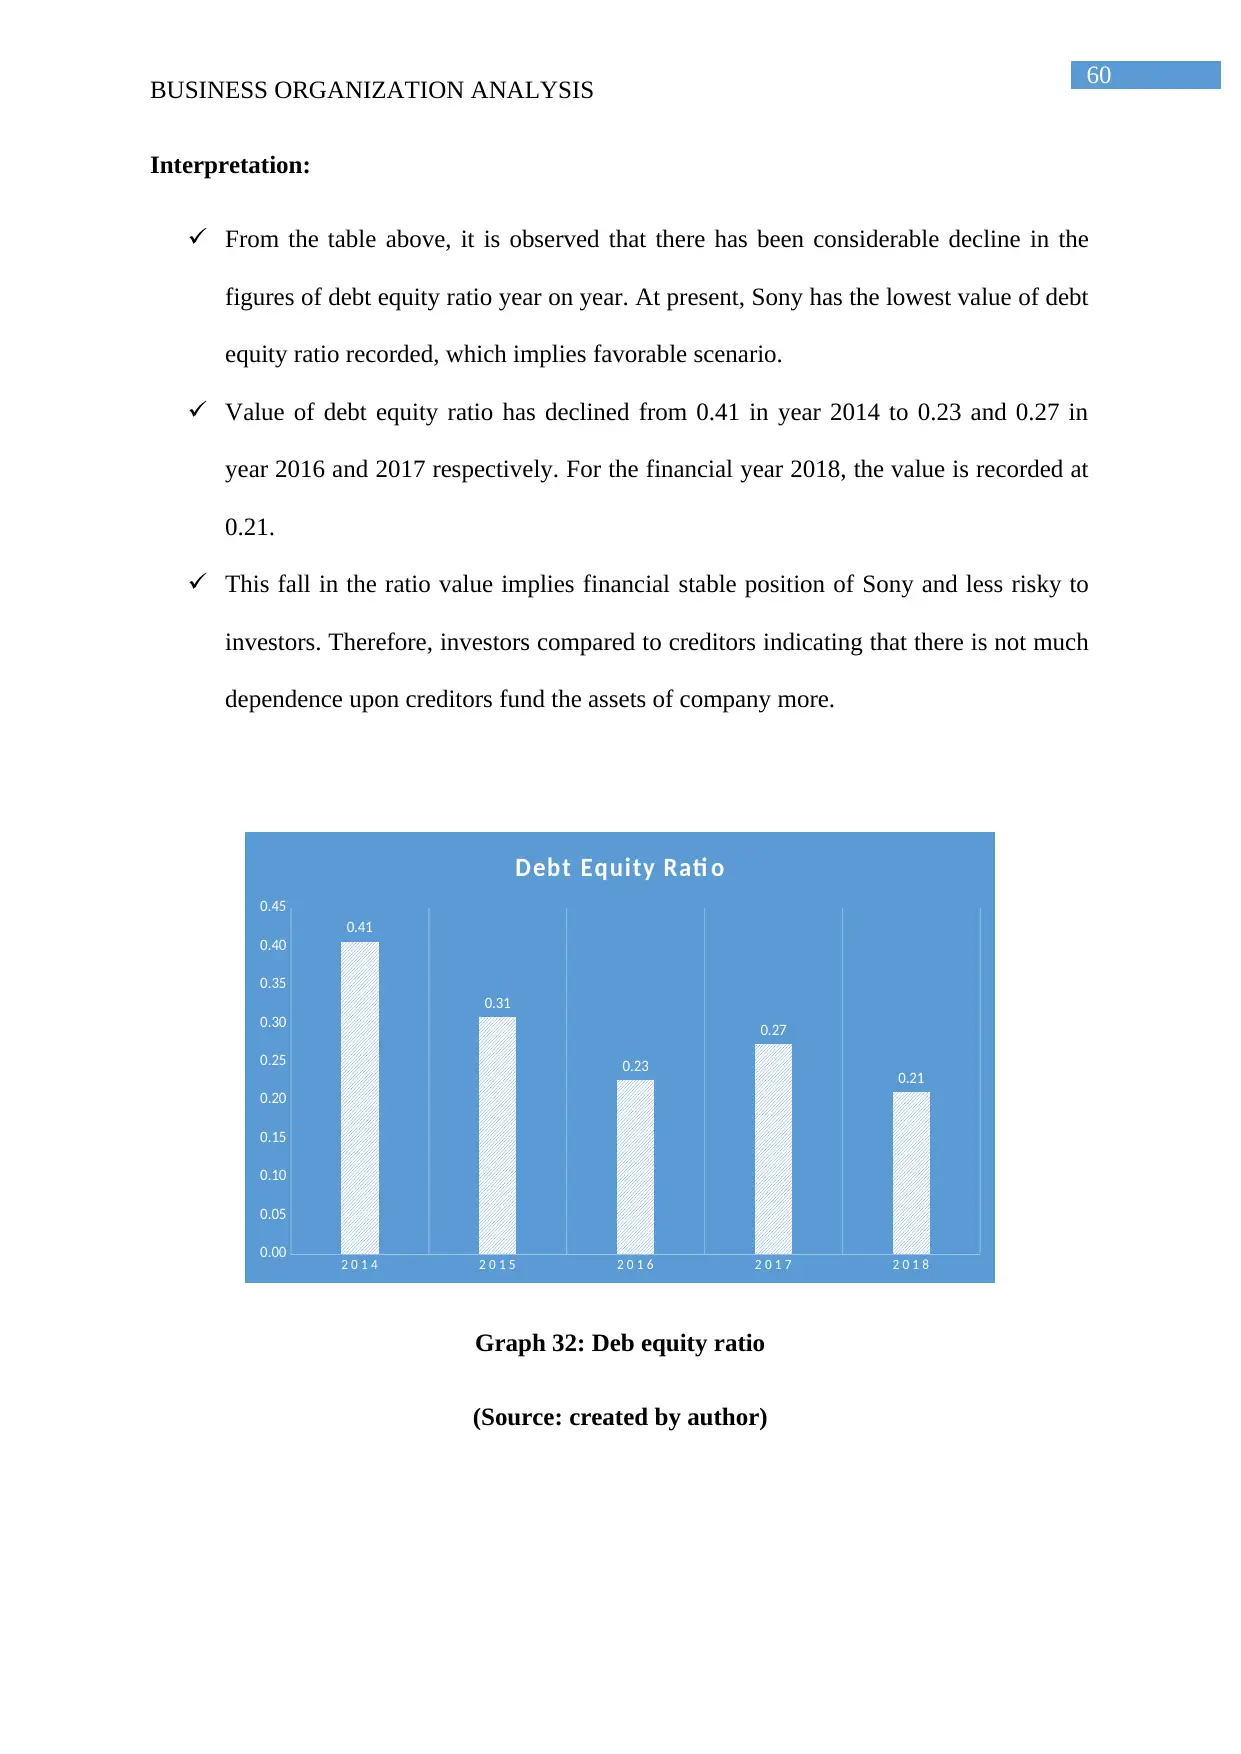
60
BUSINESS ORGANIZATION ANALYSIS
Interpretation:
From the table above, it is observed that there has been considerable decline in the
figures of debt equity ratio year on year. At present, Sony has the lowest value of debt
equity ratio recorded, which implies favorable scenario.
Value of debt equity ratio has declined from 0.41 in year 2014 to 0.23 and 0.27 in
year 2016 and 2017 respectively. For the financial year 2018, the value is recorded at
0.21.
This fall in the ratio value implies financial stable position of Sony and less risky to
investors. Therefore, investors compared to creditors indicating that there is not much
dependence upon creditors fund the assets of company more.
2 0 1 4 2 0 1 5 2 0 1 6 2 0 1 7 2 0 1 8
0.00
0.05
0.10
0.15
0.20
0.25
0.30
0.35
0.40
0.45
0.41
0.31
0.23
0.27
0.21
Debt Equity Rati o
Graph 32: Deb equity ratio
(Source: created by author)
Paraphrase This Document
Need a fresh take? Get an instant paraphrase of this document with our AI Paraphraser
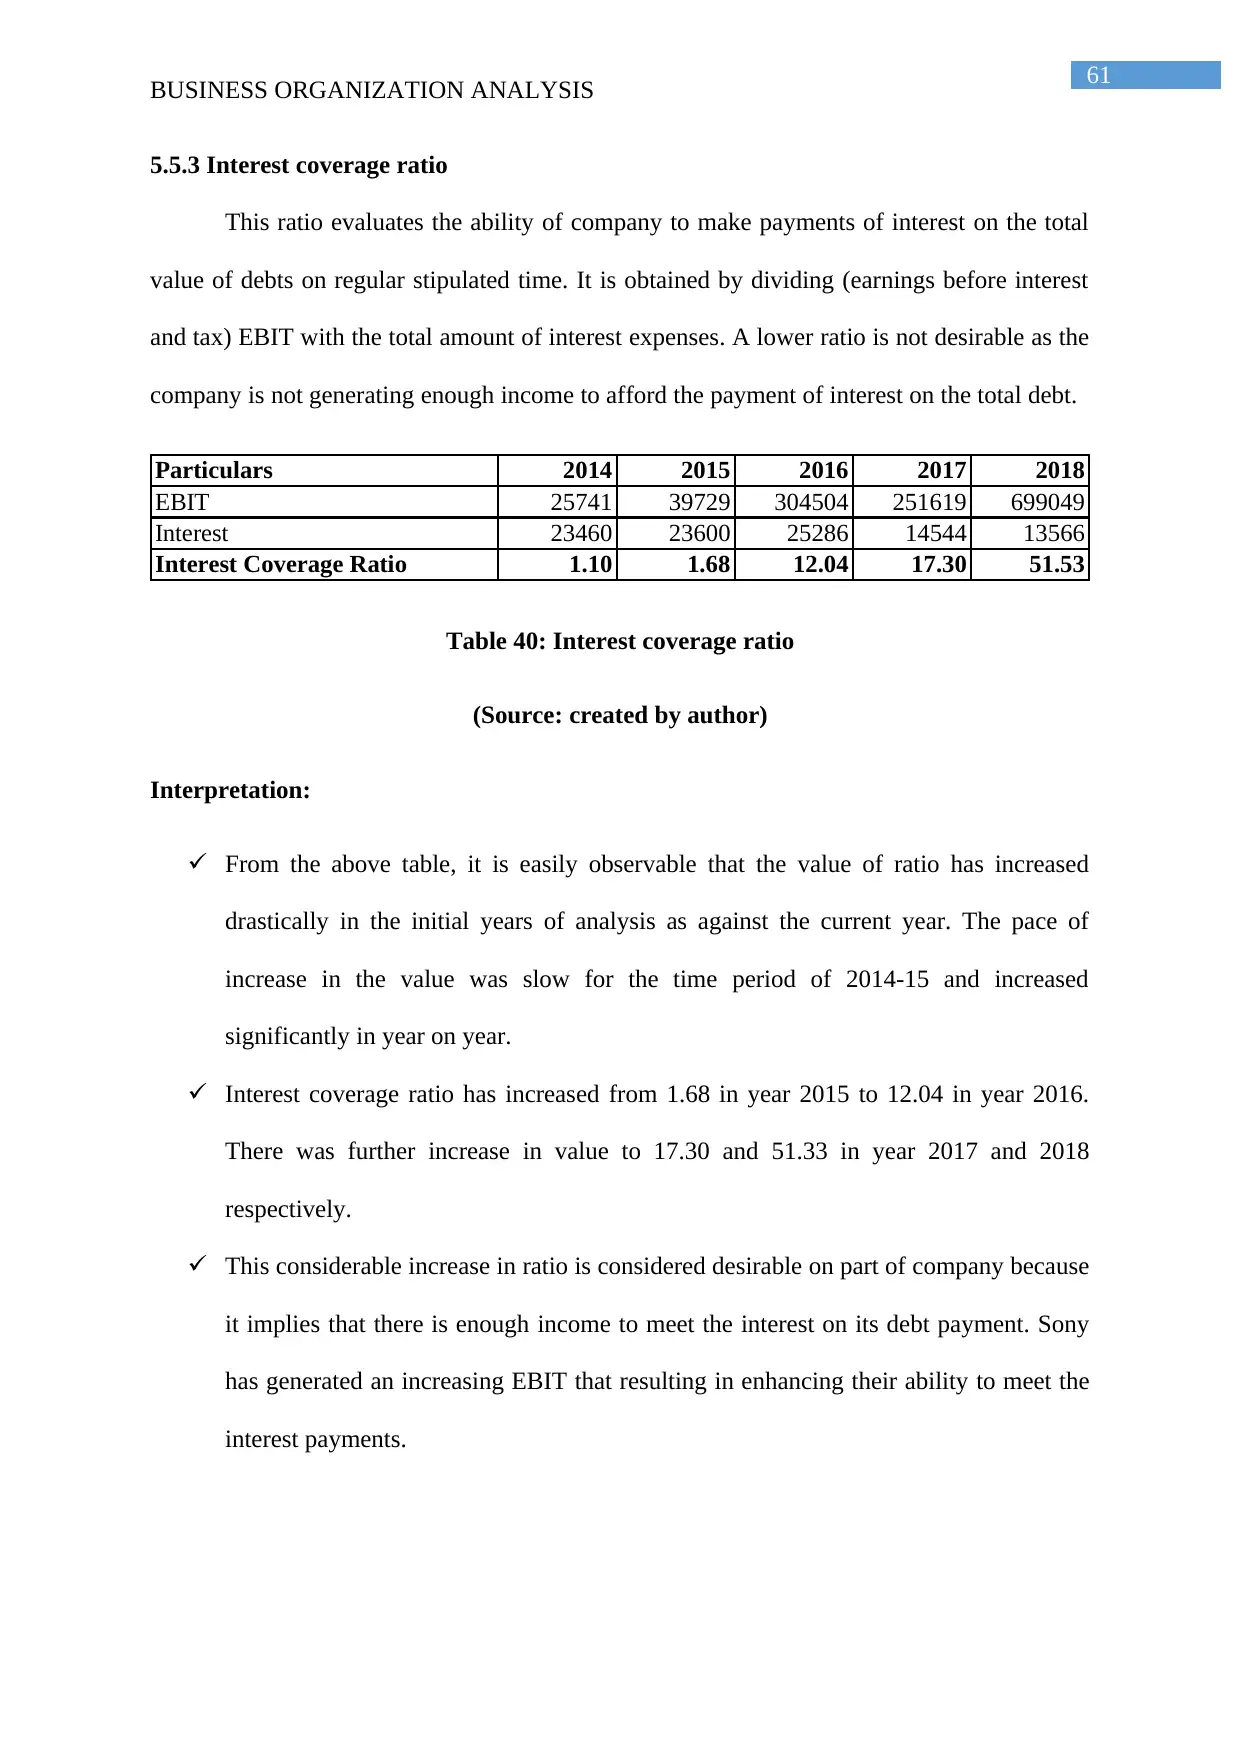
61
BUSINESS ORGANIZATION ANALYSIS
5.5.3 Interest coverage ratio
This ratio evaluates the ability of company to make payments of interest on the total
value of debts on regular stipulated time. It is obtained by dividing (earnings before interest
and tax) EBIT with the total amount of interest expenses. A lower ratio is not desirable as the
company is not generating enough income to afford the payment of interest on the total debt.
Particulars 2014 2015 2016 2017 2018
EBIT 25741 39729 304504 251619 699049
Interest 23460 23600 25286 14544 13566
Interest Coverage Ratio 1.10 1.68 12.04 17.30 51.53
Table 40: Interest coverage ratio
(Source: created by author)
Interpretation:
From the above table, it is easily observable that the value of ratio has increased
drastically in the initial years of analysis as against the current year. The pace of
increase in the value was slow for the time period of 2014-15 and increased
significantly in year on year.
Interest coverage ratio has increased from 1.68 in year 2015 to 12.04 in year 2016.
There was further increase in value to 17.30 and 51.33 in year 2017 and 2018
respectively.
This considerable increase in ratio is considered desirable on part of company because
it implies that there is enough income to meet the interest on its debt payment. Sony
has generated an increasing EBIT that resulting in enhancing their ability to meet the
interest payments.
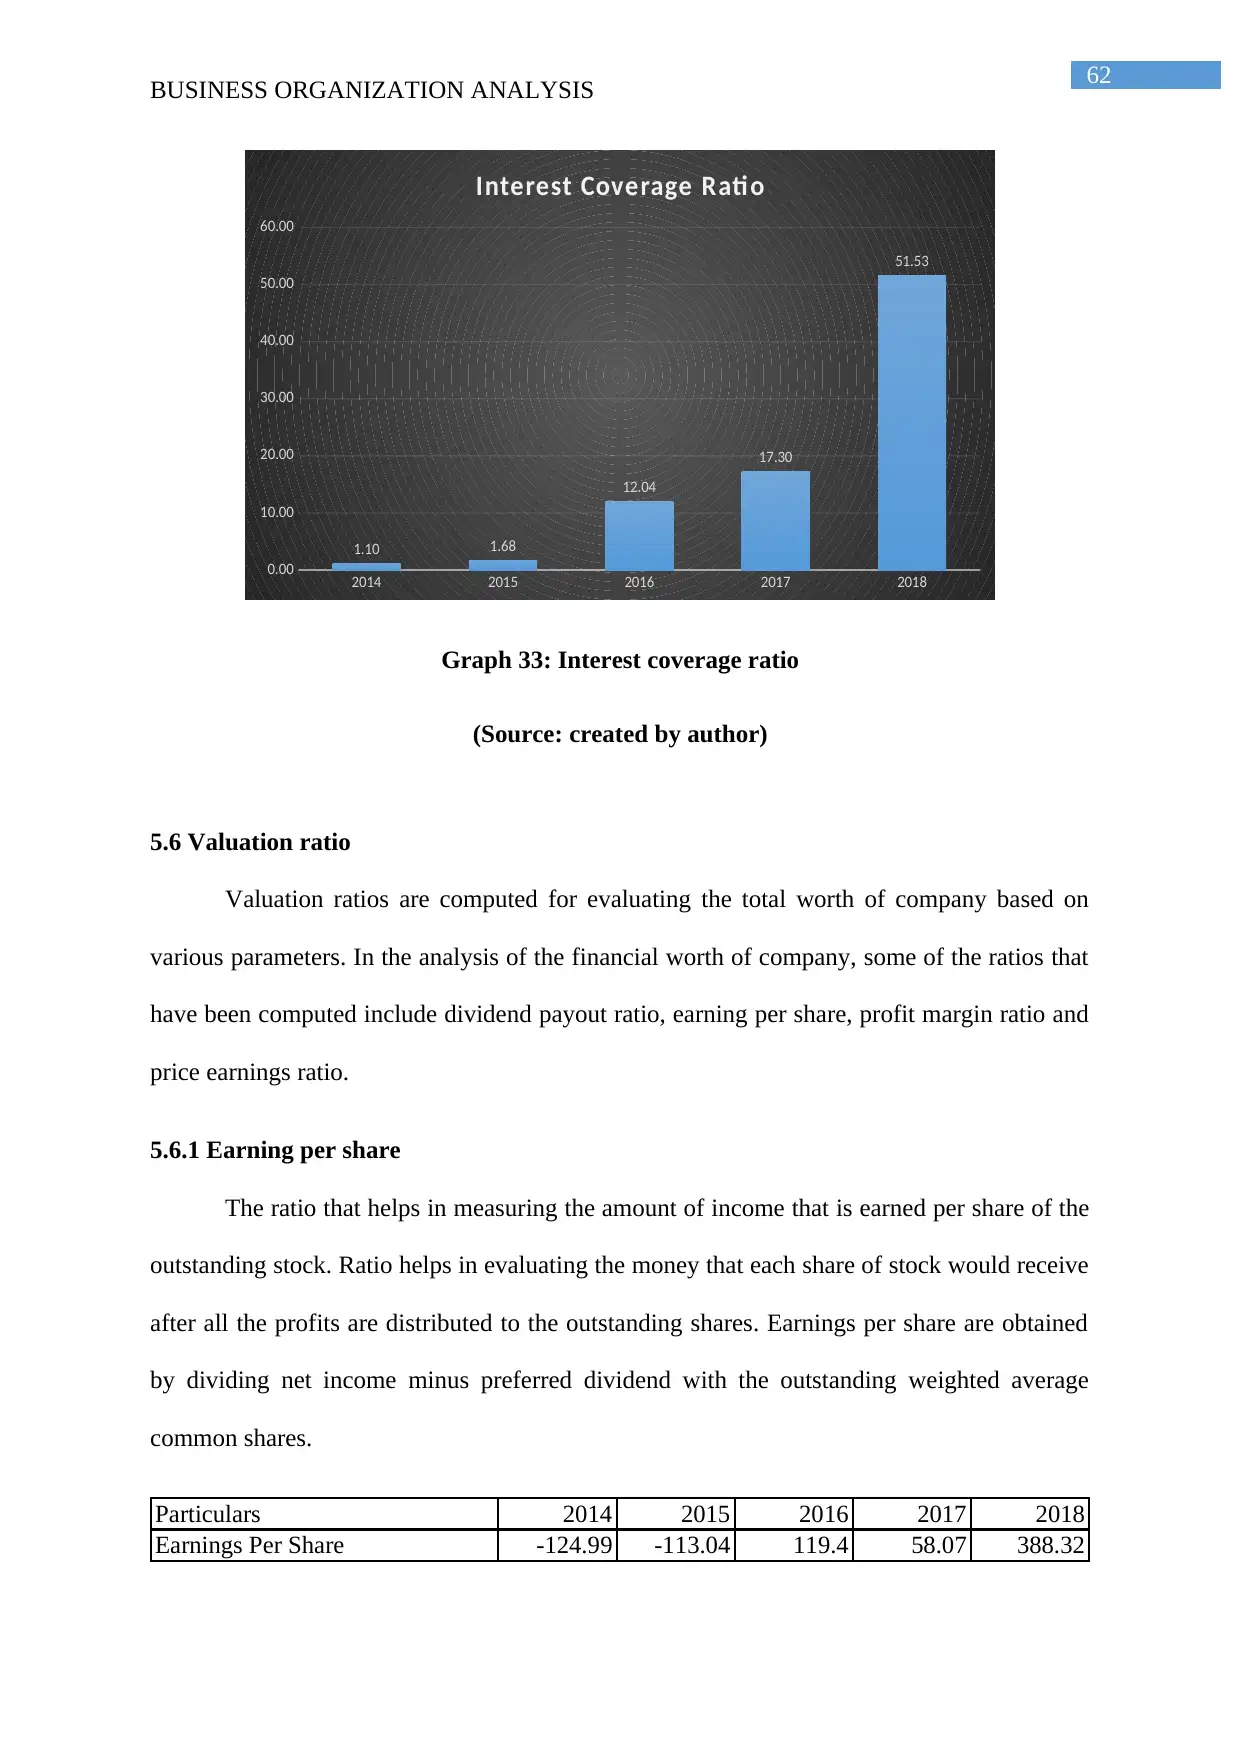
62
BUSINESS ORGANIZATION ANALYSIS
2014 2015 2016 2017 2018
0.00
10.00
20.00
30.00
40.00
50.00
60.00
1.10 1.68
12.04
17.30
51.53
Interest Coverage Rati o
Graph 33: Interest coverage ratio
(Source: created by author)
5.6 Valuation ratio
Valuation ratios are computed for evaluating the total worth of company based on
various parameters. In the analysis of the financial worth of company, some of the ratios that
have been computed include dividend payout ratio, earning per share, profit margin ratio and
price earnings ratio.
5.6.1 Earning per share
The ratio that helps in measuring the amount of income that is earned per share of the
outstanding stock. Ratio helps in evaluating the money that each share of stock would receive
after all the profits are distributed to the outstanding shares. Earnings per share are obtained
by dividing net income minus preferred dividend with the outstanding weighted average
common shares.
Particulars 2014 2015 2016 2017 2018
Earnings Per Share -124.99 -113.04 119.4 58.07 388.32
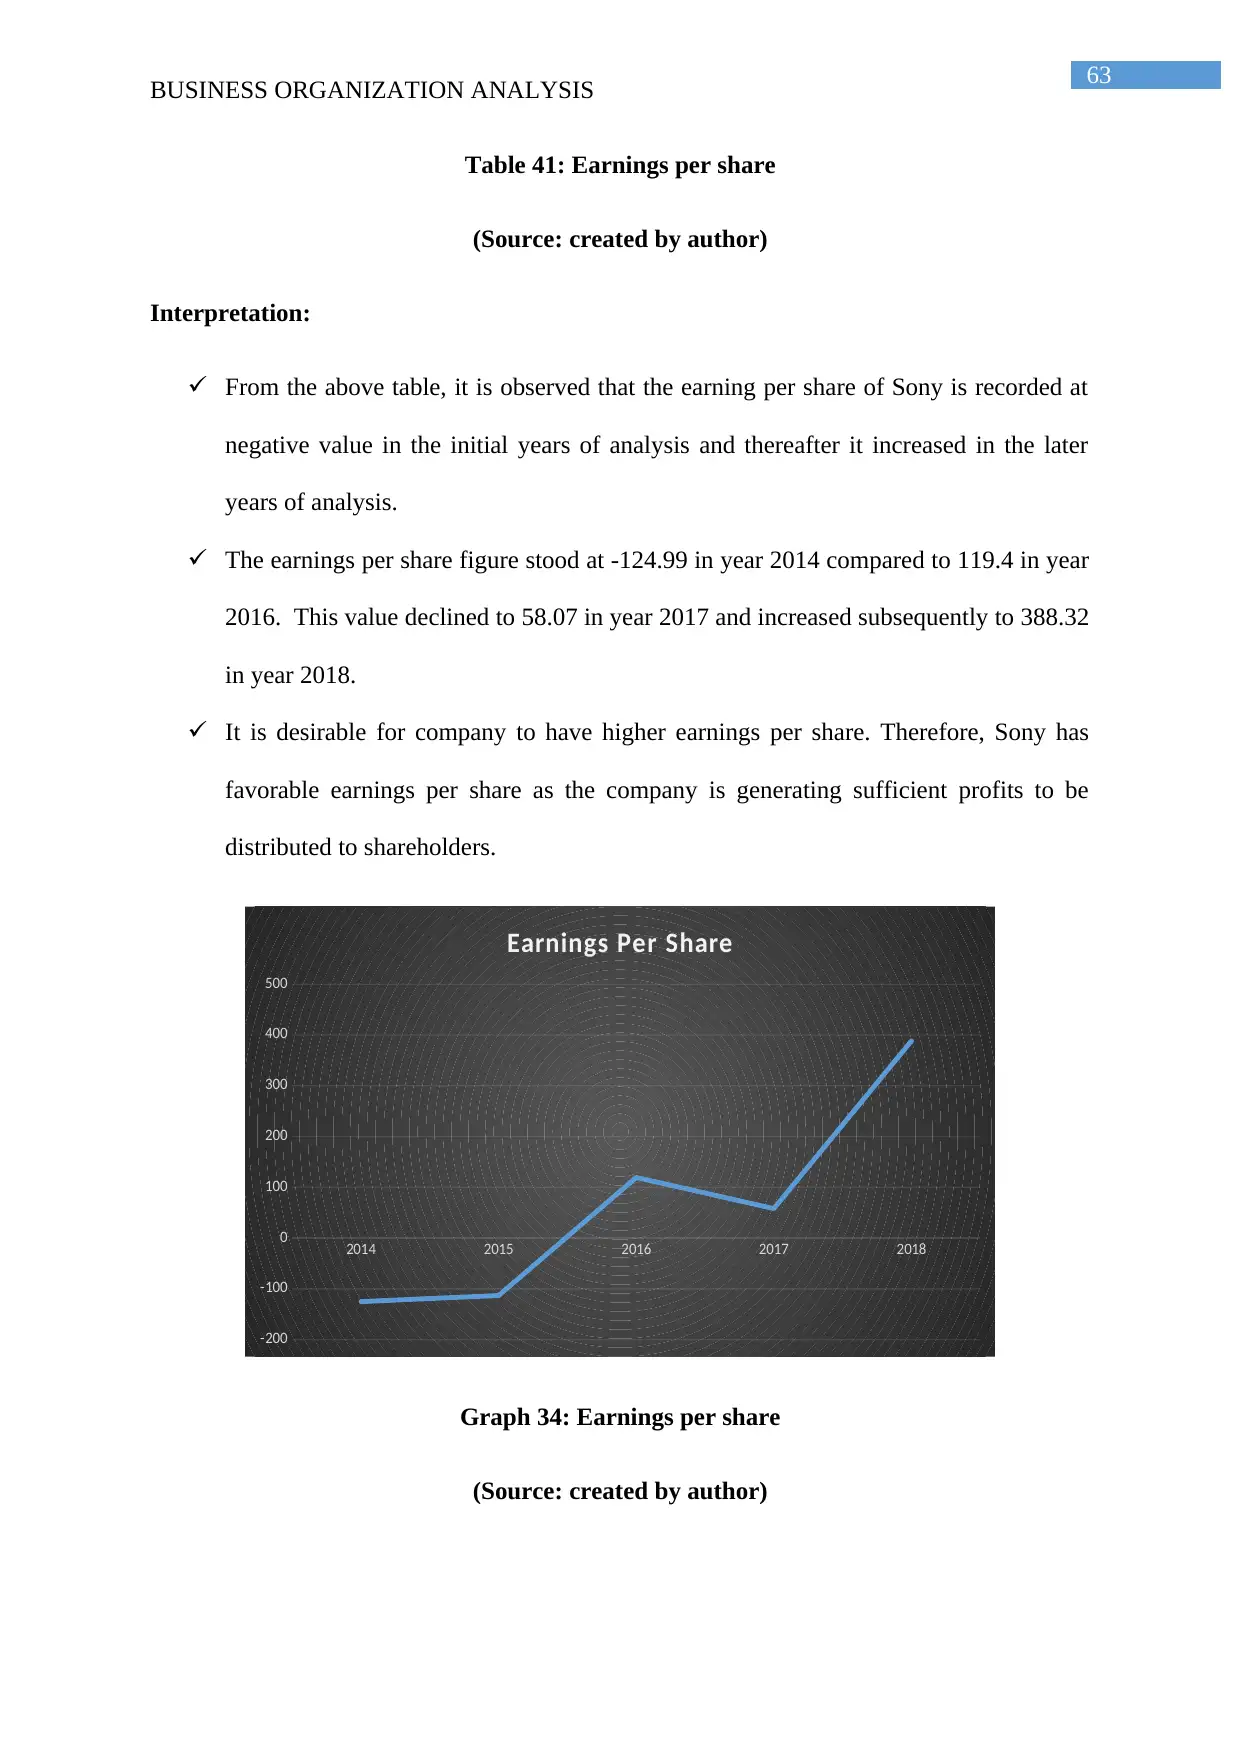
63
BUSINESS ORGANIZATION ANALYSIS
Table 41: Earnings per share
(Source: created by author)
Interpretation:
From the above table, it is observed that the earning per share of Sony is recorded at
negative value in the initial years of analysis and thereafter it increased in the later
years of analysis.
The earnings per share figure stood at -124.99 in year 2014 compared to 119.4 in year
2016. This value declined to 58.07 in year 2017 and increased subsequently to 388.32
in year 2018.
It is desirable for company to have higher earnings per share. Therefore, Sony has
favorable earnings per share as the company is generating sufficient profits to be
distributed to shareholders.
2014 2015 2016 2017 2018
-200
-100
0
100
200
300
400
500
Earnings Per Share
Graph 34: Earnings per share
(Source: created by author)
Secure Best Marks with AI Grader
Need help grading? Try our AI Grader for instant feedback on your assignments.
64
BUSINESS ORGANIZATION ANALYSIS
5.6.2 Dividend payout ratio
It is the ratio that evaluates percentage of net income that is distributed to the
shareholders of organization by way of dividend. This helps in segregating the portion of
profits, which the shareholder receives, and portion which is used in the operations of funds.
Particulars 2014 2015 2016 2017 2018
Dividend Payout Ratio 24.93 0 19.82 19.1 27.17
Table 42: Dividend payout ratio
(Source: created by author)
Interpretation:
It is observed from the table that in the initial years of analysis, the payout ratio
declined significantly and it increased thereafter.
The value of dividend payout ratio is recorded at 24.93 in year 2014 compared to
19.82 in year 2016 and subsequently to 19.1 in year 2017. In the financial year 2018,
the ratio stood at 27.17 indicating favorable situation compared to prior years. No
dividend was paid also noteworthy mention in year 2015.
An increase in dividend payout ratio is desirable for company as it implies that
investors are provided with return on investment in the form of increasing dividend
payment.
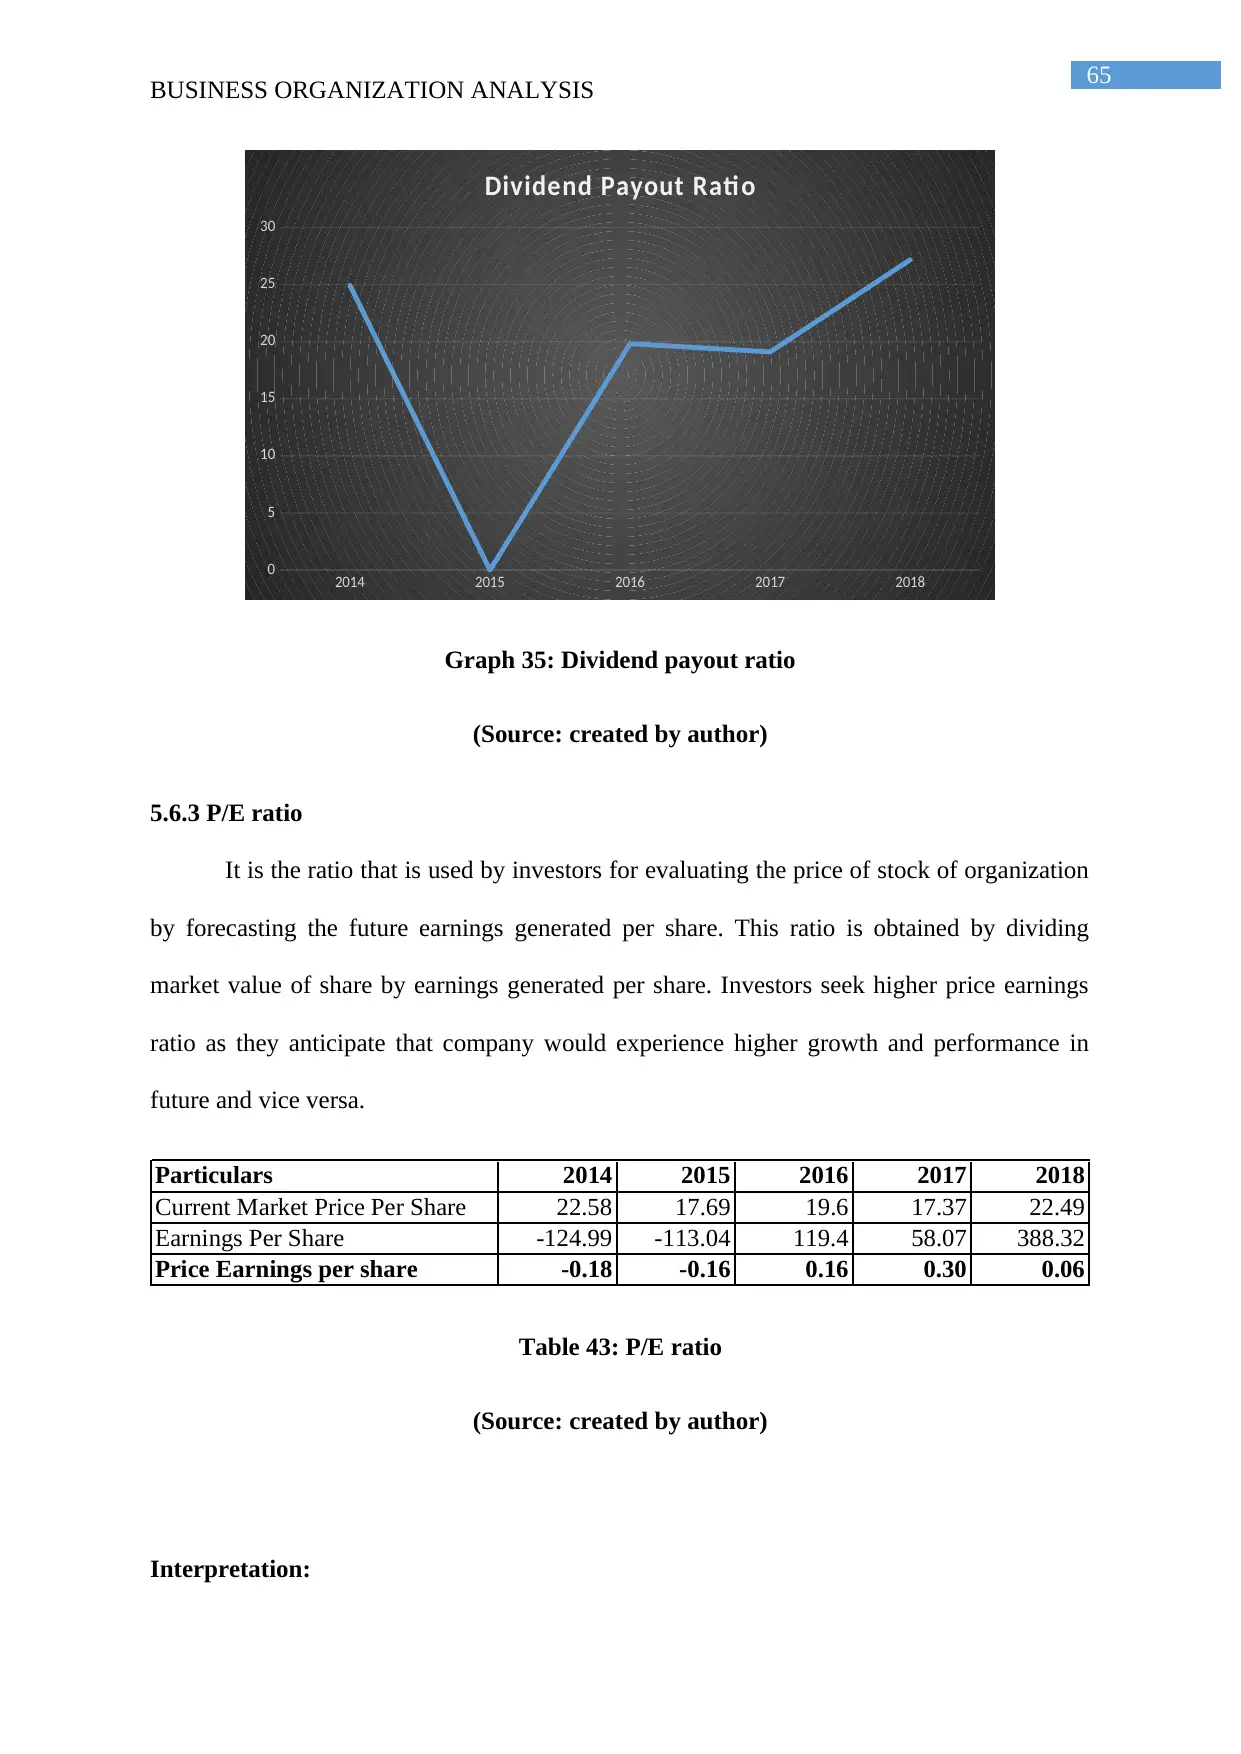
65
BUSINESS ORGANIZATION ANALYSIS
2014 2015 2016 2017 2018
0
5
10
15
20
25
30
Dividend Payout Ratio
Graph 35: Dividend payout ratio
(Source: created by author)
5.6.3 P/E ratio
It is the ratio that is used by investors for evaluating the price of stock of organization
by forecasting the future earnings generated per share. This ratio is obtained by dividing
market value of share by earnings generated per share. Investors seek higher price earnings
ratio as they anticipate that company would experience higher growth and performance in
future and vice versa.
Particulars 2014 2015 2016 2017 2018
Current Market Price Per Share 22.58 17.69 19.6 17.37 22.49
Earnings Per Share -124.99 -113.04 119.4 58.07 388.32
Price Earnings per share -0.18 -0.16 0.16 0.30 0.06
Table 43: P/E ratio
(Source: created by author)
Interpretation:
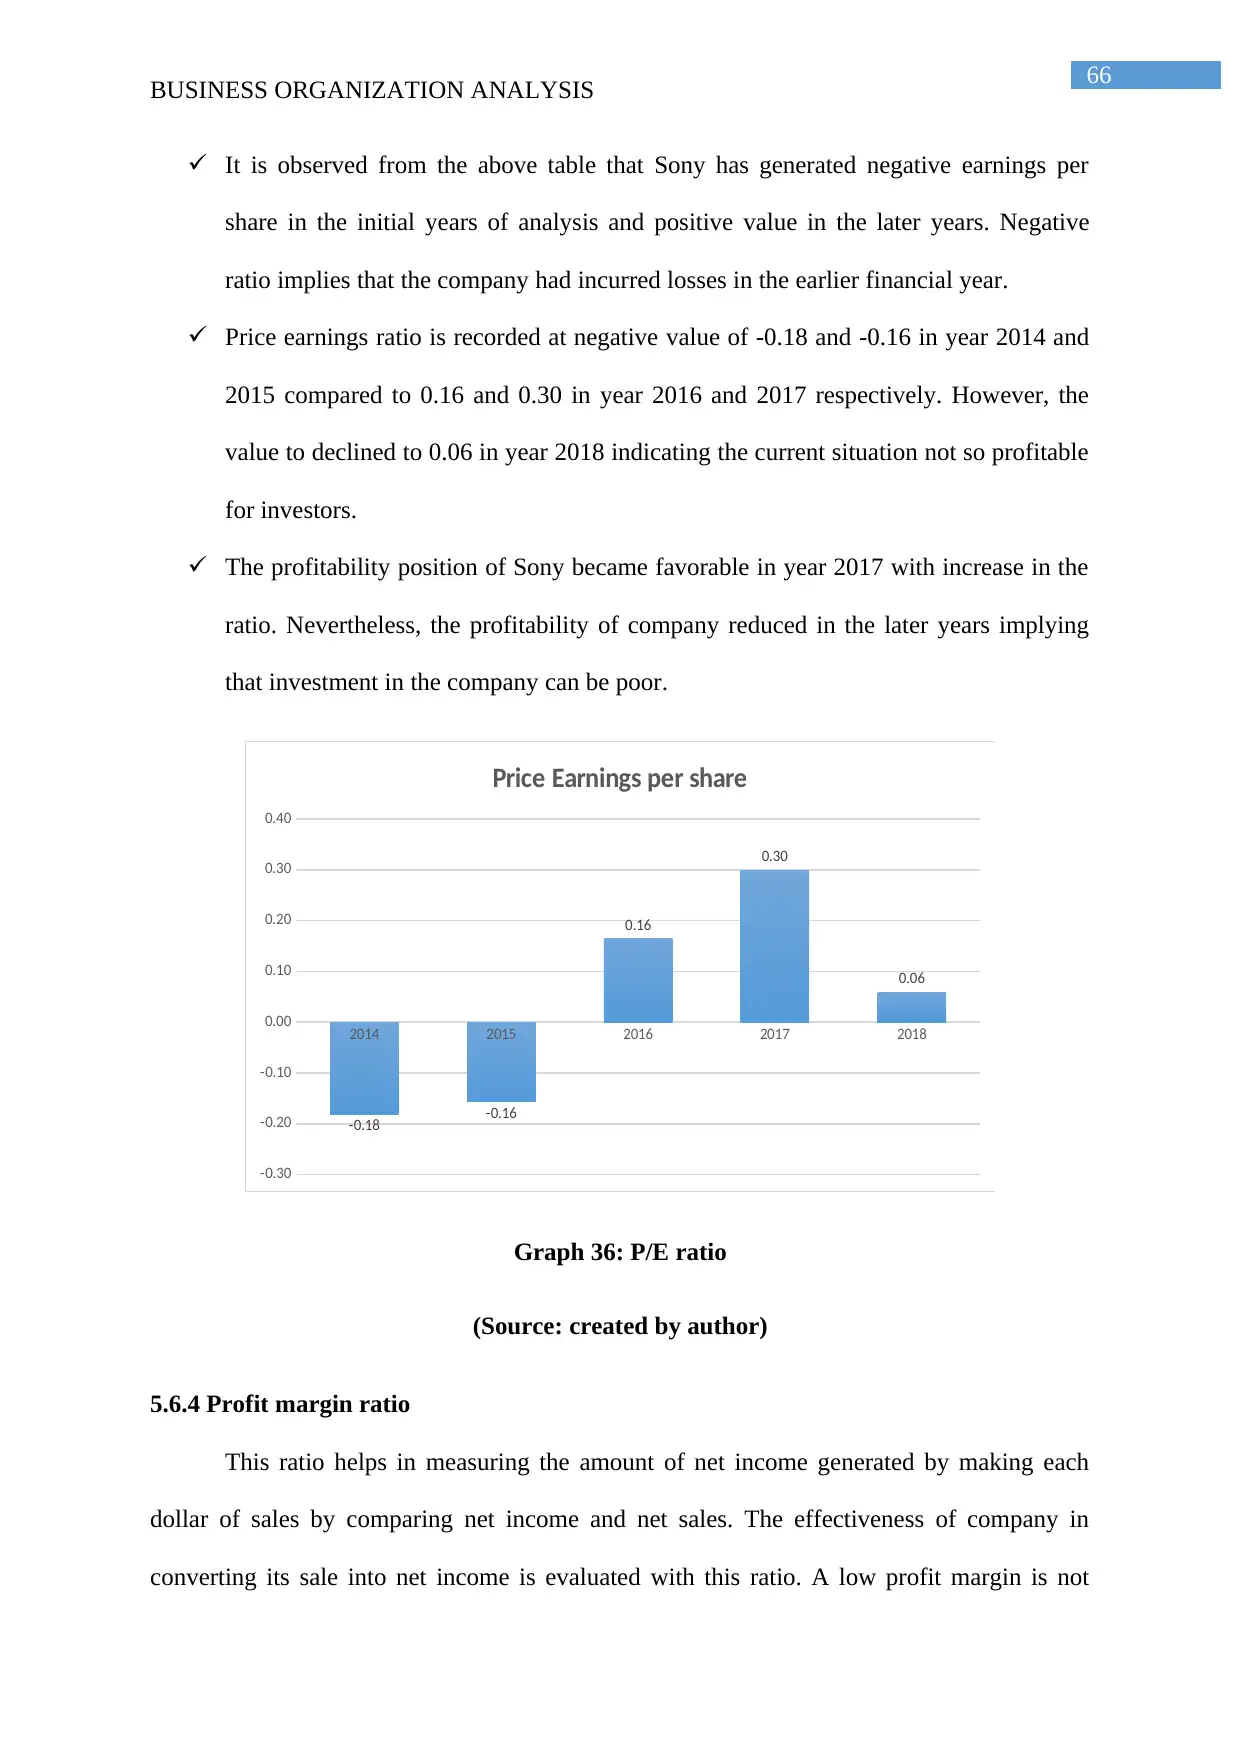
66
BUSINESS ORGANIZATION ANALYSIS
It is observed from the above table that Sony has generated negative earnings per
share in the initial years of analysis and positive value in the later years. Negative
ratio implies that the company had incurred losses in the earlier financial year.
Price earnings ratio is recorded at negative value of -0.18 and -0.16 in year 2014 and
2015 compared to 0.16 and 0.30 in year 2016 and 2017 respectively. However, the
value to declined to 0.06 in year 2018 indicating the current situation not so profitable
for investors.
The profitability position of Sony became favorable in year 2017 with increase in the
ratio. Nevertheless, the profitability of company reduced in the later years implying
that investment in the company can be poor.
2014 2015 2016 2017 2018
-0.30
-0.20
-0.10
0.00
0.10
0.20
0.30
0.40
-0.18 -0.16
0.16
0.30
0.06
Price Earnings per share
Graph 36: P/E ratio
(Source: created by author)
5.6.4 Profit margin ratio
This ratio helps in measuring the amount of net income generated by making each
dollar of sales by comparing net income and net sales. The effectiveness of company in
converting its sale into net income is evaluated with this ratio. A low profit margin is not
Paraphrase This Document
Need a fresh take? Get an instant paraphrase of this document with our AI Paraphraser
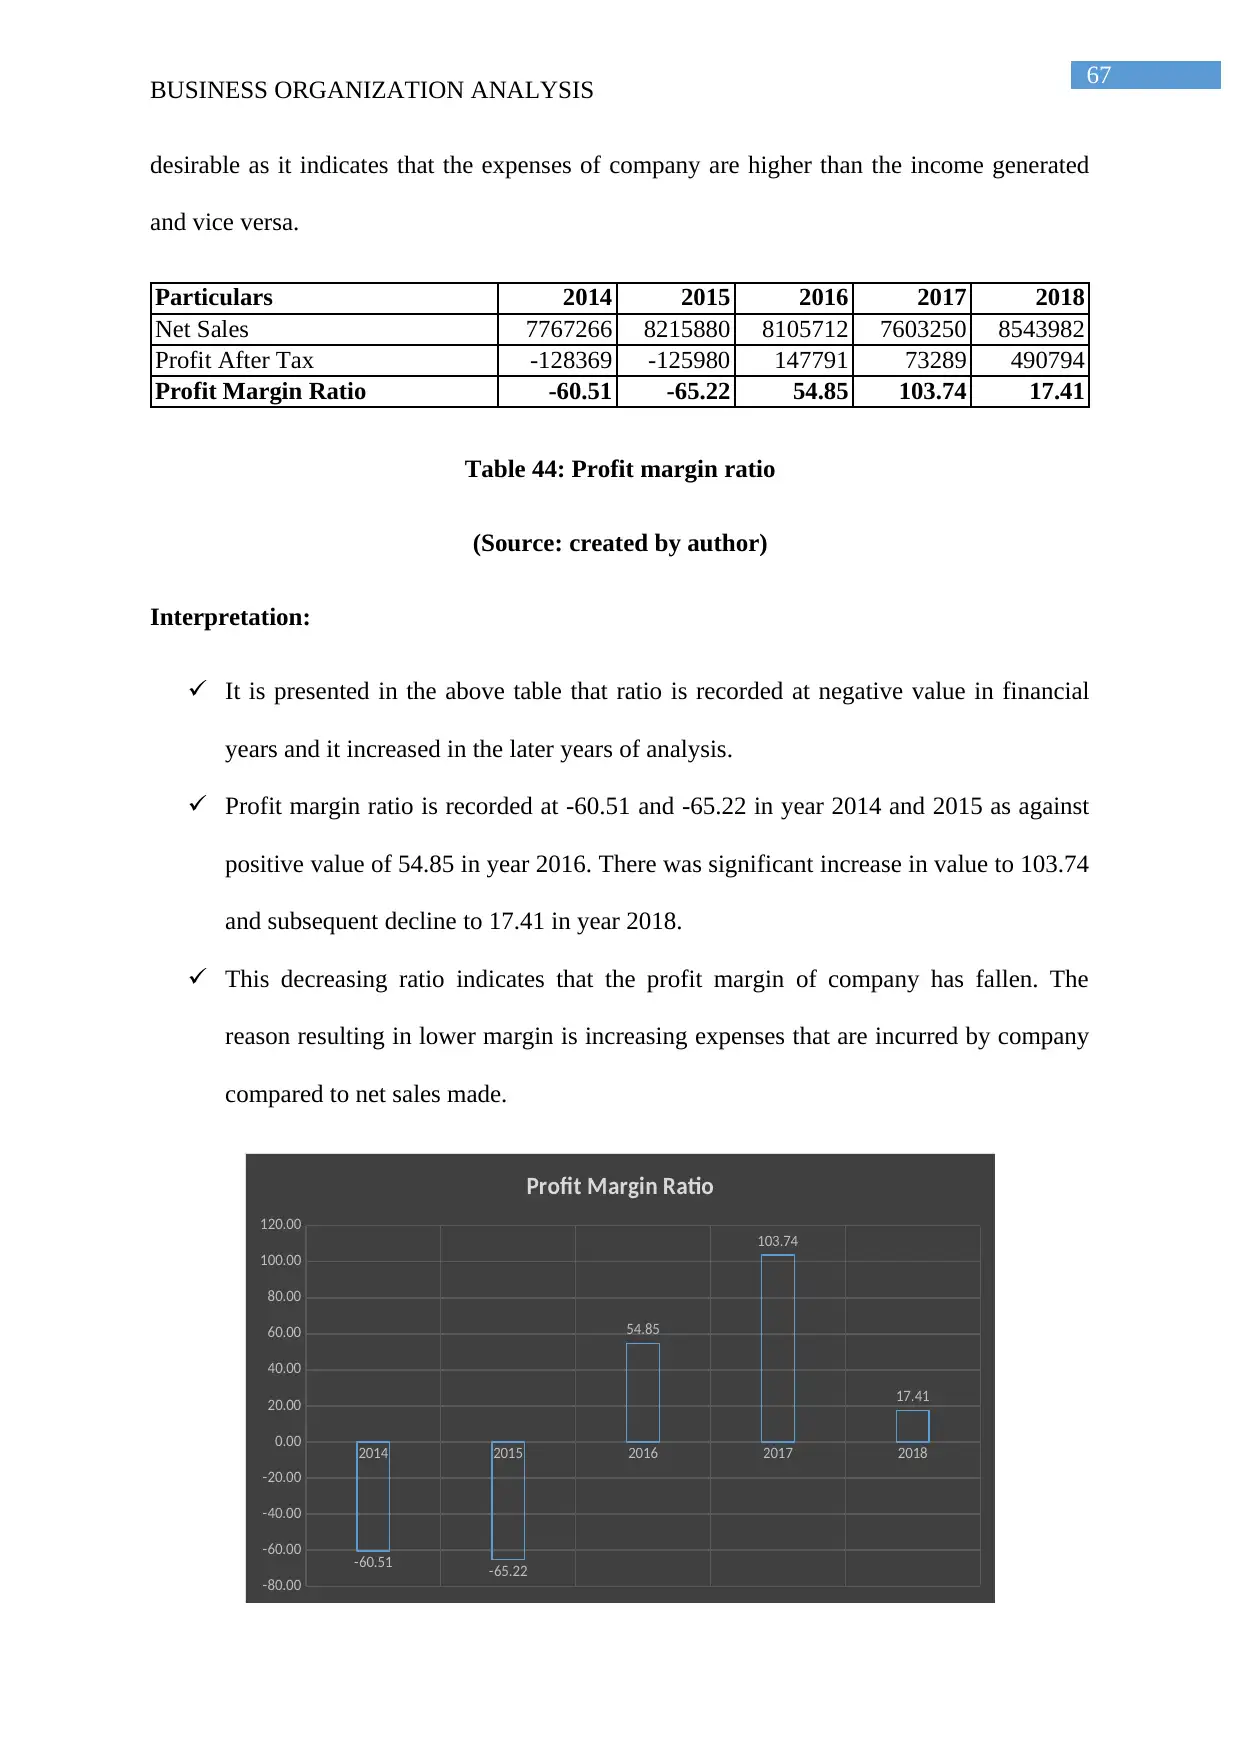
67
BUSINESS ORGANIZATION ANALYSIS
desirable as it indicates that the expenses of company are higher than the income generated
and vice versa.
Particulars 2014 2015 2016 2017 2018
Net Sales 7767266 8215880 8105712 7603250 8543982
Profit After Tax -128369 -125980 147791 73289 490794
Profit Margin Ratio -60.51 -65.22 54.85 103.74 17.41
Table 44: Profit margin ratio
(Source: created by author)
Interpretation:
It is presented in the above table that ratio is recorded at negative value in financial
years and it increased in the later years of analysis.
Profit margin ratio is recorded at -60.51 and -65.22 in year 2014 and 2015 as against
positive value of 54.85 in year 2016. There was significant increase in value to 103.74
and subsequent decline to 17.41 in year 2018.
This decreasing ratio indicates that the profit margin of company has fallen. The
reason resulting in lower margin is increasing expenses that are incurred by company
compared to net sales made.
2014 2015 2016 2017 2018
-80.00
-60.00
-40.00
-20.00
0.00
20.00
40.00
60.00
80.00
100.00
120.00
-60.51 -65.22
54.85
103.74
17.41
Profit Margin Ratio
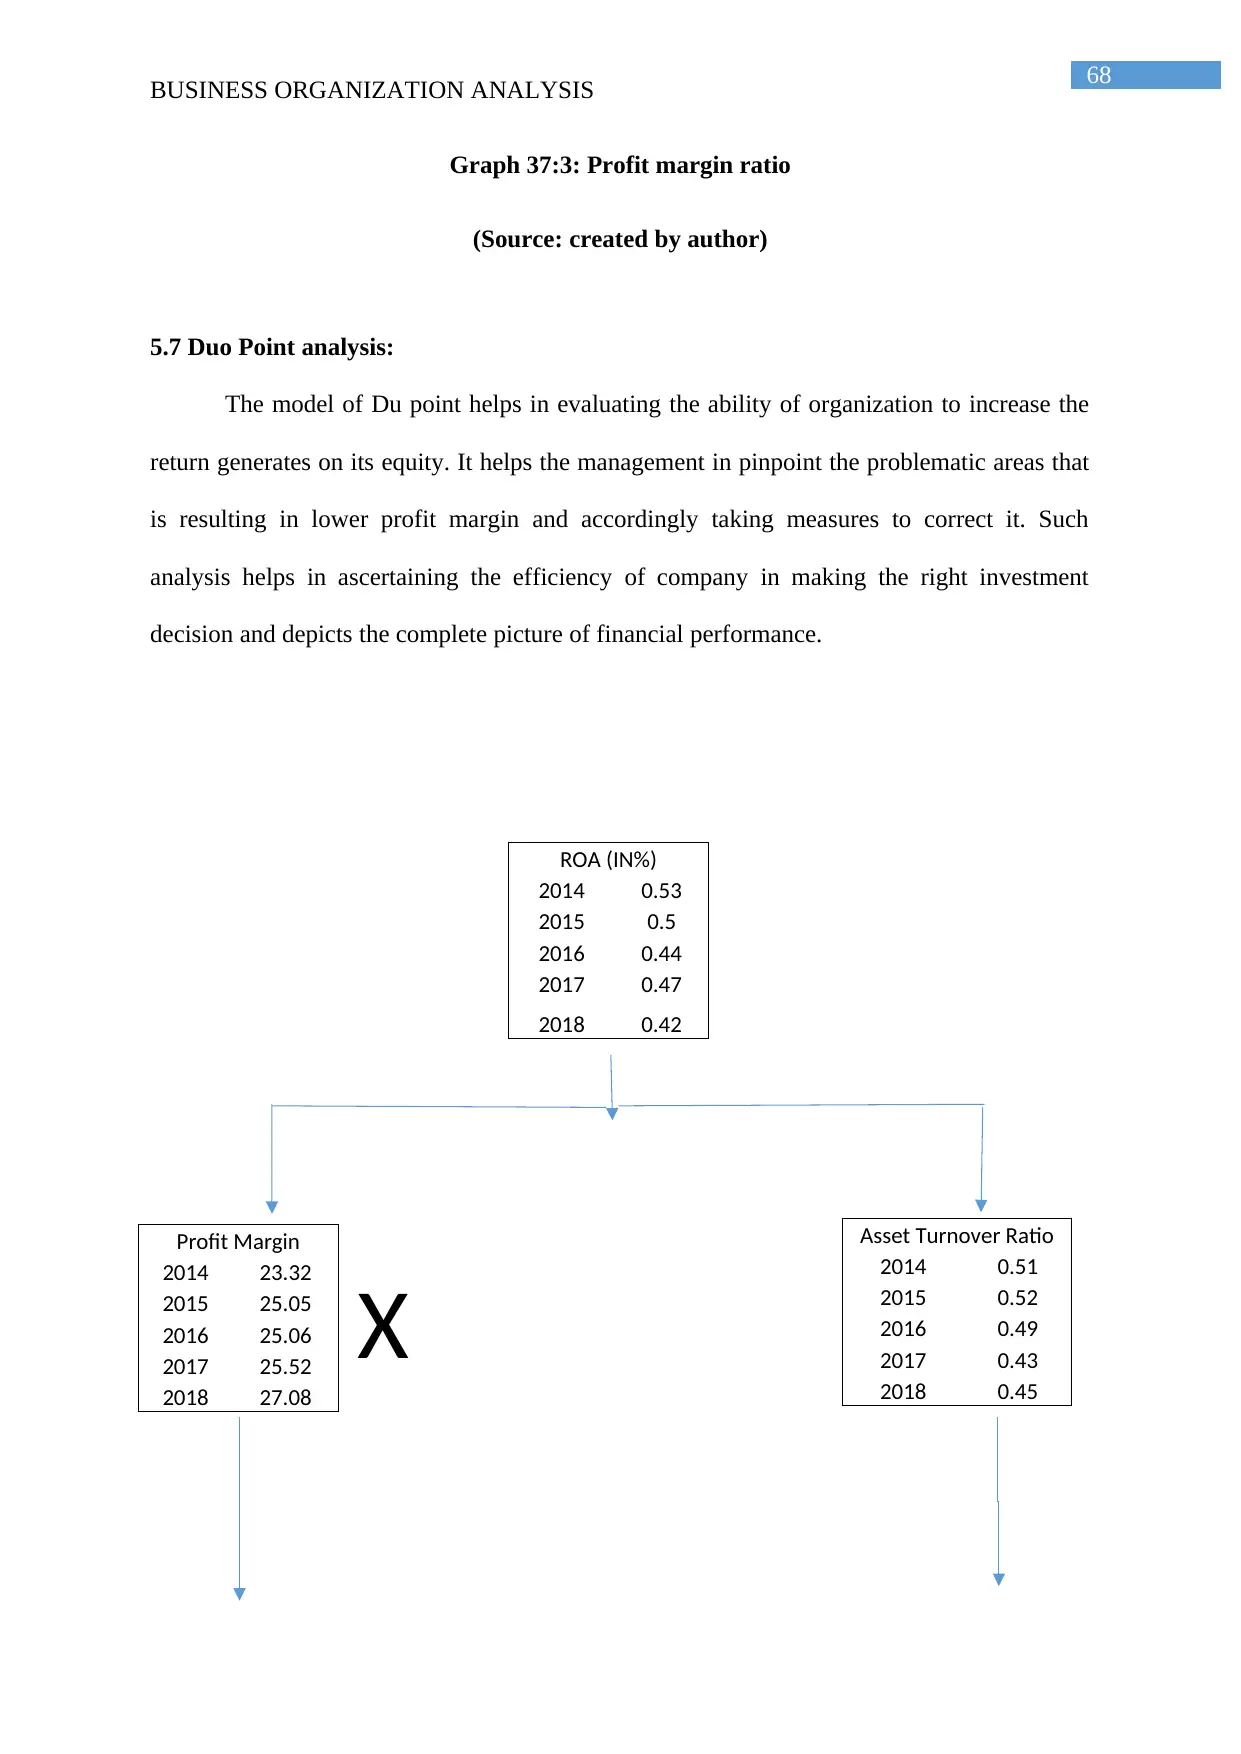
68
BUSINESS ORGANIZATION ANALYSIS
Graph 37:3: Profit margin ratio
(Source: created by author)
5.7 Duo Point analysis:
The model of Du point helps in evaluating the ability of organization to increase the
return generates on its equity. It helps the management in pinpoint the problematic areas that
is resulting in lower profit margin and accordingly taking measures to correct it. Such
analysis helps in ascertaining the efficiency of company in making the right investment
decision and depicts the complete picture of financial performance.
ROA (IN%)
2014 0.53
2015 0.5
2016 0.44
2017 0.47
2018 0.42
X
Asset Turnover Ratio
2014 0.51
2015 0.52
2016 0.49
2017 0.43
2018 0.45
Profit Margin
2014 23.32
2015 25.05
2016 25.06
2017 25.52
2018 27.08
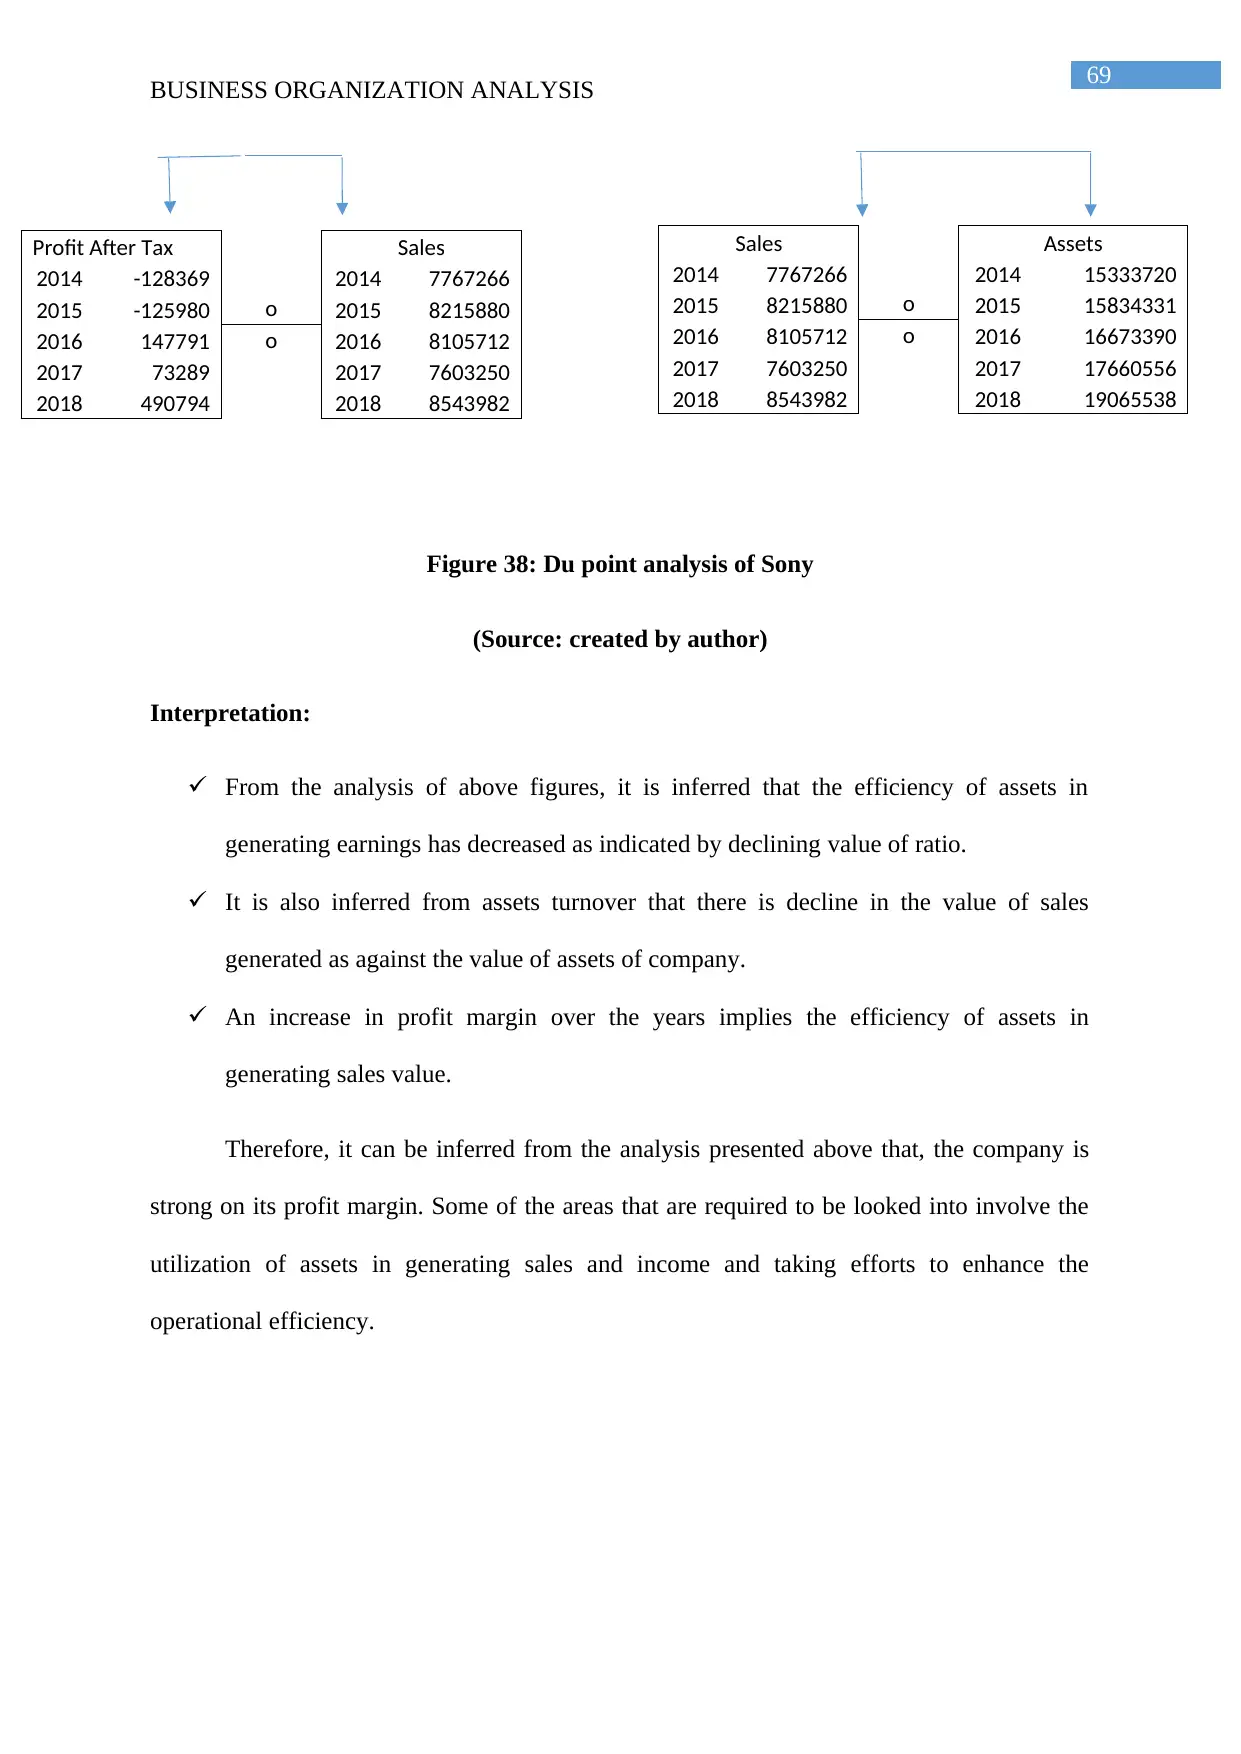
69
BUSINESS ORGANIZATION ANALYSIS
Figure 38: Du point analysis of Sony
(Source: created by author)
Interpretation:
From the analysis of above figures, it is inferred that the efficiency of assets in
generating earnings has decreased as indicated by declining value of ratio.
It is also inferred from assets turnover that there is decline in the value of sales
generated as against the value of assets of company.
An increase in profit margin over the years implies the efficiency of assets in
generating sales value.
Therefore, it can be inferred from the analysis presented above that, the company is
strong on its profit margin. Some of the areas that are required to be looked into involve the
utilization of assets in generating sales and income and taking efforts to enhance the
operational efficiency.
Profit After Tax Sales
2014 -128369 2014 7767266
2015 -125980 o 2015 8215880
2016 147791 o 2016 8105712
2017 73289 2017 7603250
2018 490794 2018 8543982
Sales Assets
2014 7767266 2014 15333720
2015 8215880 o 2015 15834331
2016 8105712 o 2016 16673390
2017 7603250 2017 17660556
2018 8543982 2018 19065538
Secure Best Marks with AI Grader
Need help grading? Try our AI Grader for instant feedback on your assignments.
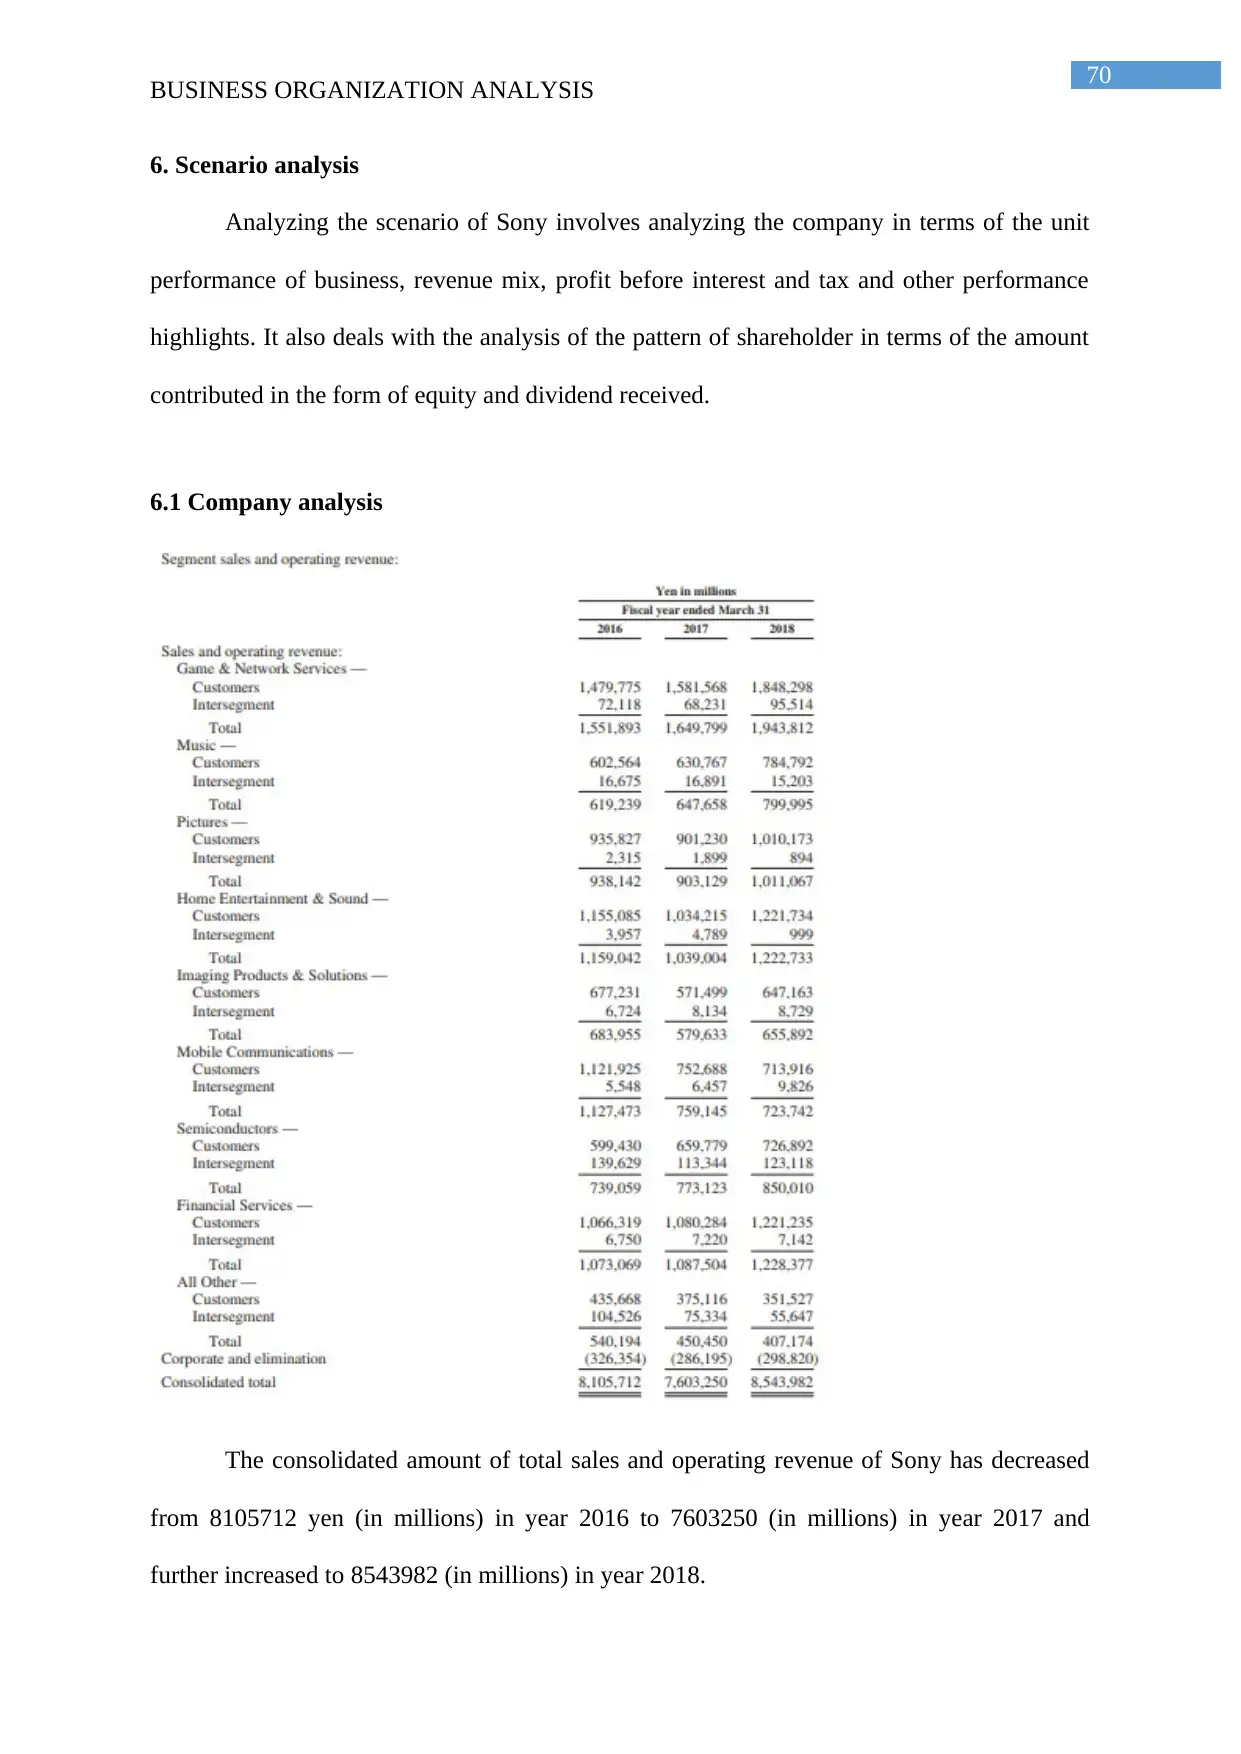
70
BUSINESS ORGANIZATION ANALYSIS
6. Scenario analysis
Analyzing the scenario of Sony involves analyzing the company in terms of the unit
performance of business, revenue mix, profit before interest and tax and other performance
highlights. It also deals with the analysis of the pattern of shareholder in terms of the amount
contributed in the form of equity and dividend received.
6.1 Company analysis
The consolidated amount of total sales and operating revenue of Sony has decreased
from 8105712 yen (in millions) in year 2016 to 7603250 (in millions) in year 2017 and
further increased to 8543982 (in millions) in year 2018.
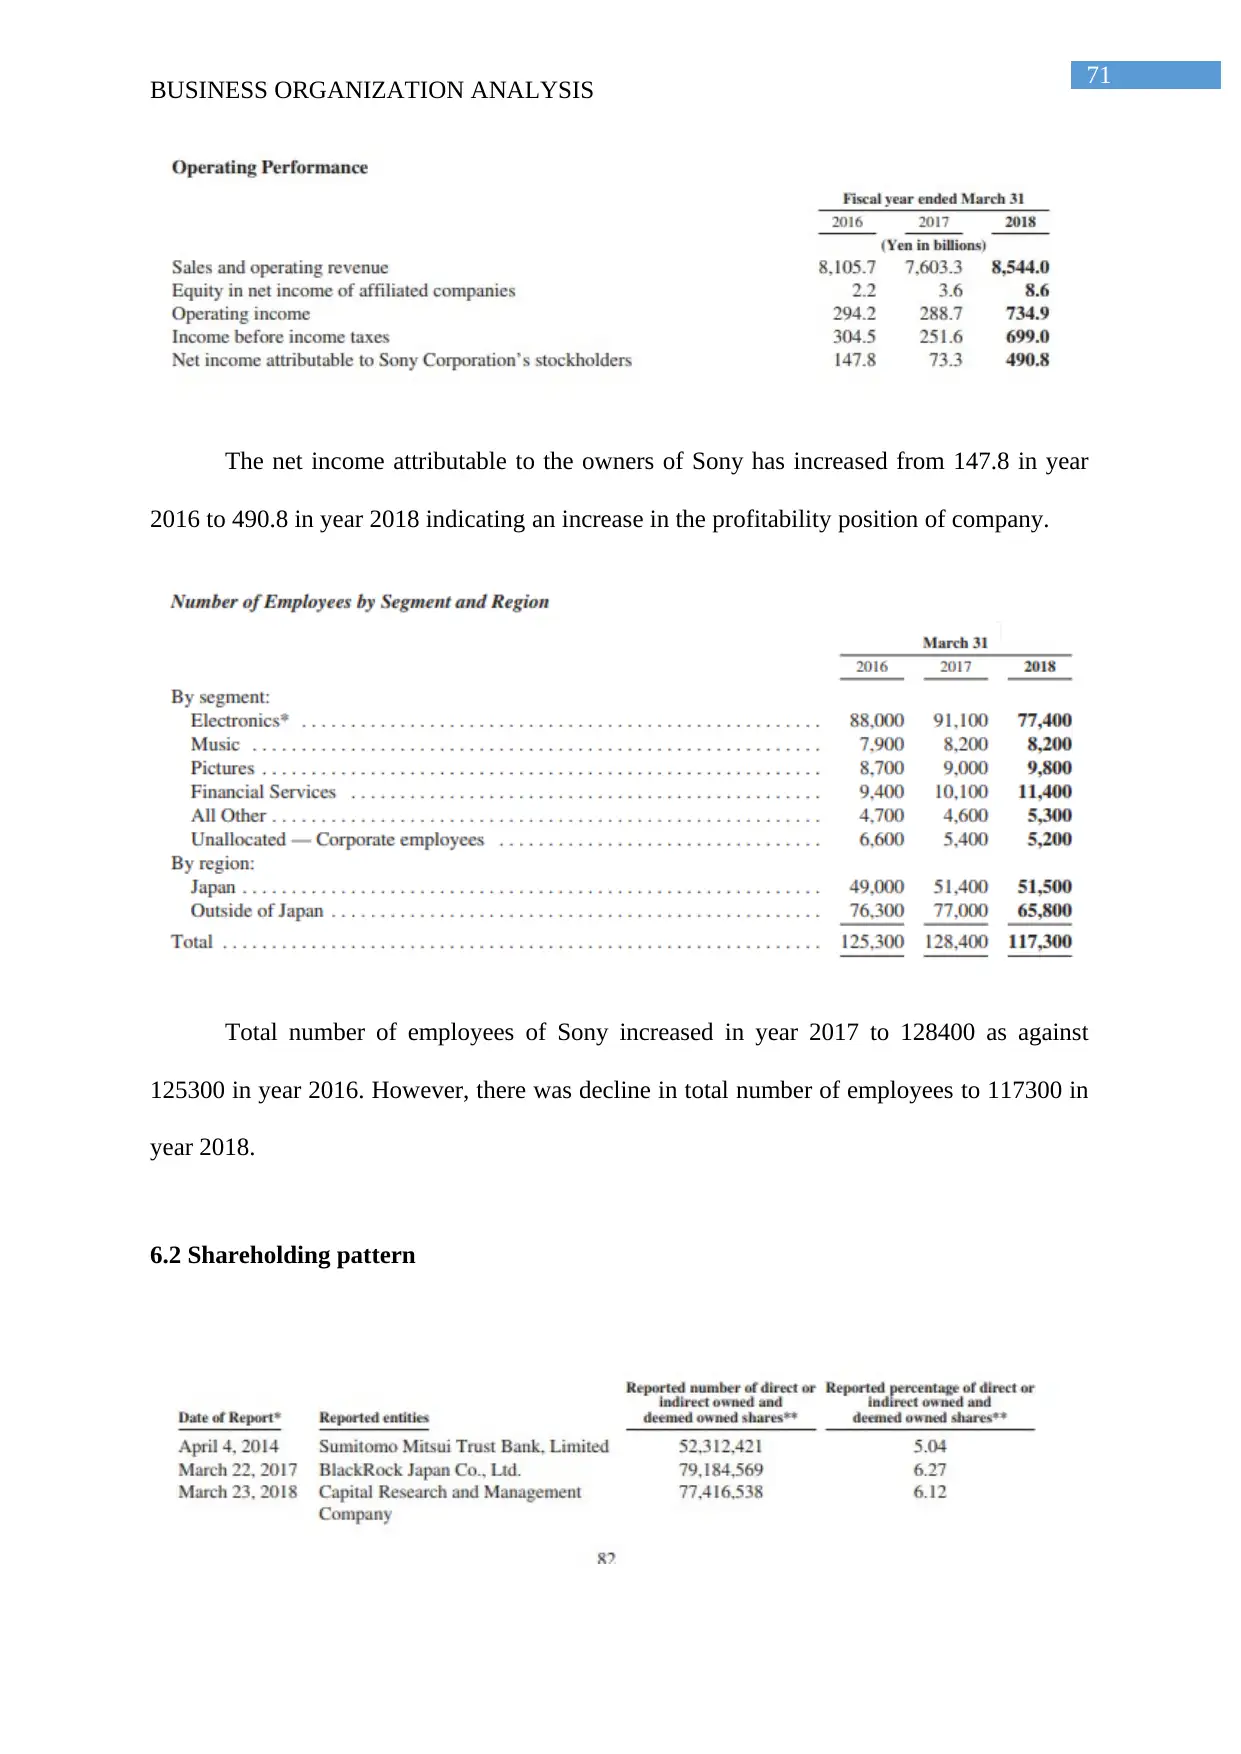
71
BUSINESS ORGANIZATION ANALYSIS
The net income attributable to the owners of Sony has increased from 147.8 in year
2016 to 490.8 in year 2018 indicating an increase in the profitability position of company.
Total number of employees of Sony increased in year 2017 to 128400 as against
125300 in year 2016. However, there was decline in total number of employees to 117300 in
year 2018.
6.2 Shareholding pattern
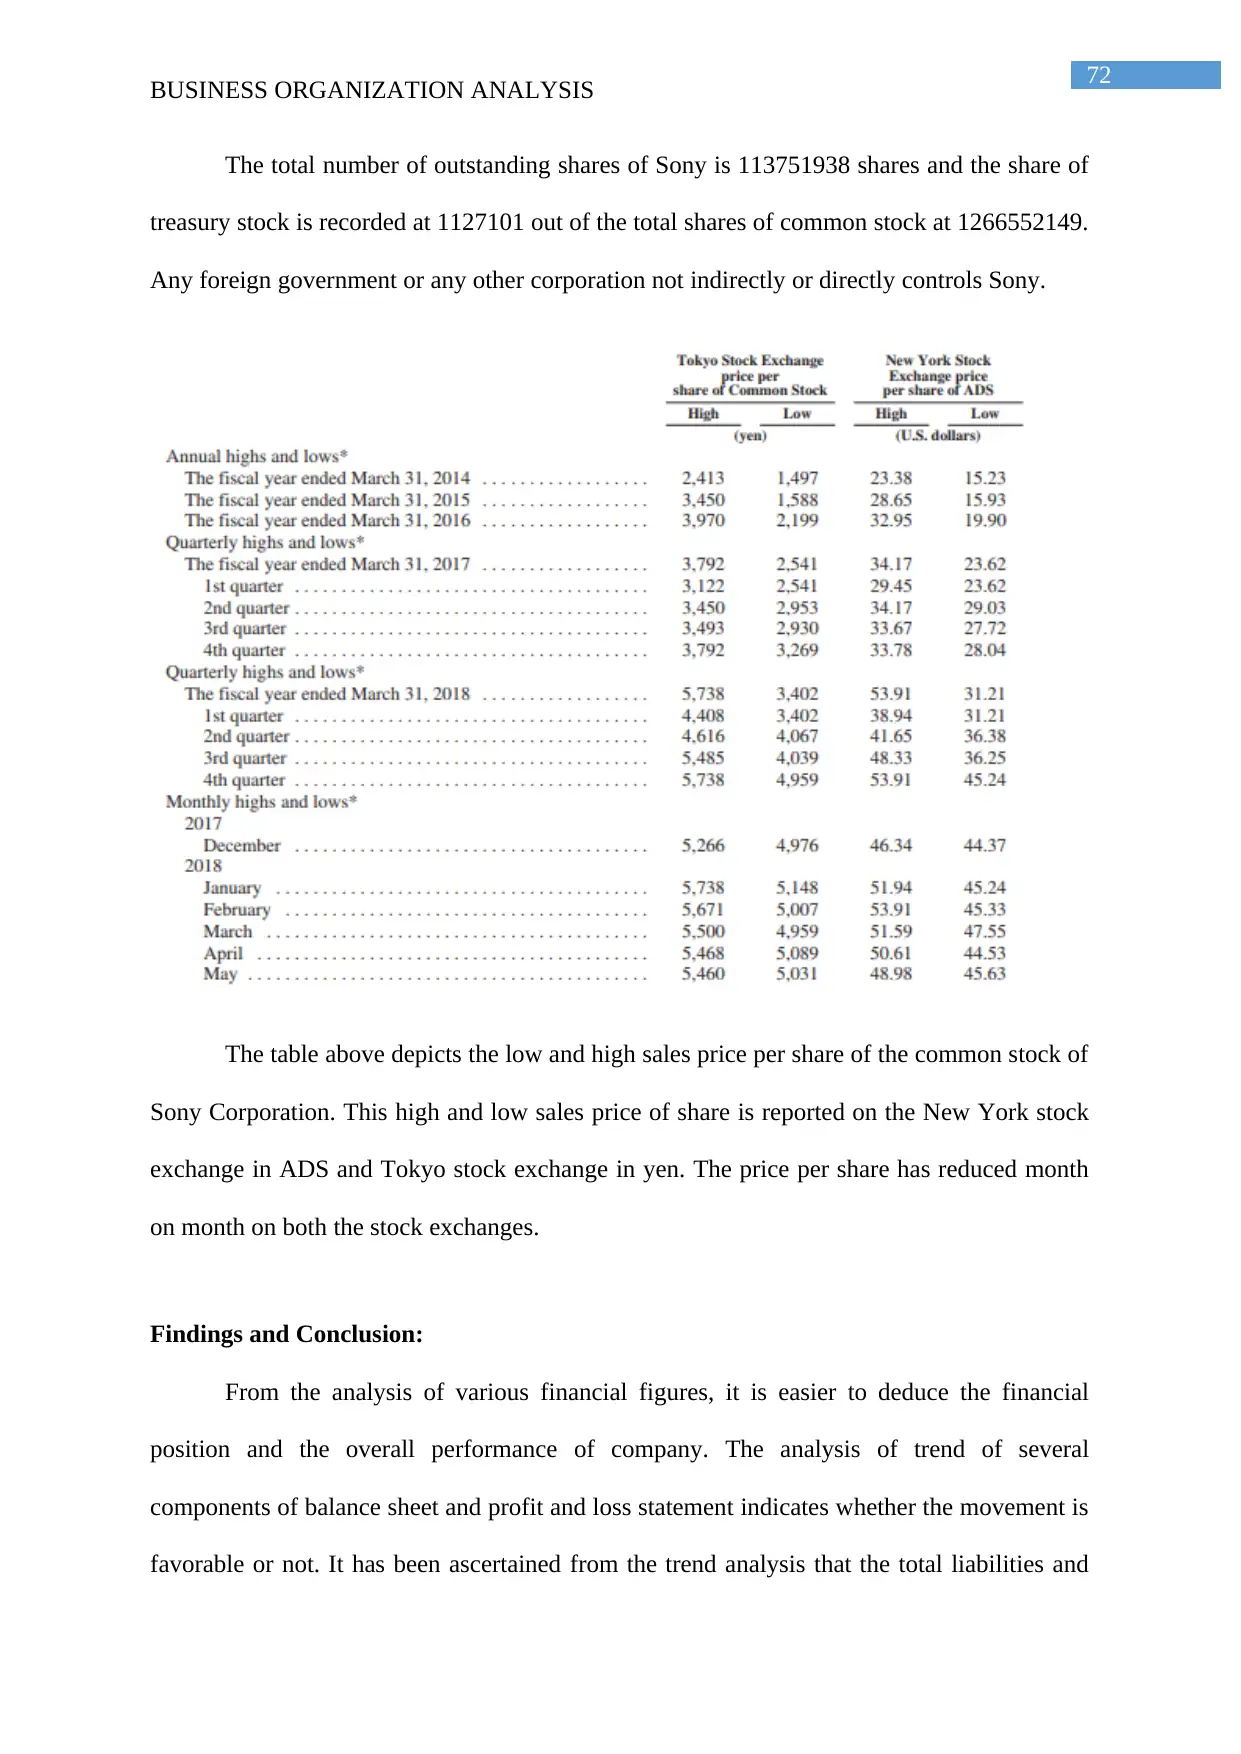
72
BUSINESS ORGANIZATION ANALYSIS
The total number of outstanding shares of Sony is 113751938 shares and the share of
treasury stock is recorded at 1127101 out of the total shares of common stock at 1266552149.
Any foreign government or any other corporation not indirectly or directly controls Sony.
The table above depicts the low and high sales price per share of the common stock of
Sony Corporation. This high and low sales price of share is reported on the New York stock
exchange in ADS and Tokyo stock exchange in yen. The price per share has reduced month
on month on both the stock exchanges.
Findings and Conclusion:
From the analysis of various financial figures, it is easier to deduce the financial
position and the overall performance of company. The analysis of trend of several
components of balance sheet and profit and loss statement indicates whether the movement is
favorable or not. It has been ascertained from the trend analysis that the total liabilities and
Paraphrase This Document
Need a fresh take? Get an instant paraphrase of this document with our AI Paraphraser
73
BUSINESS ORGANIZATION ANALYSIS
total asset of Sony Corporation is on declining trend. Although the net income has increased
considerably in the currency year of financial analysis, the total expenses incurred by
organization increased on average. Investors would have positive perception of making
investment in this company because there has been drastic increase in the net income
available to shareholders. The liquidity position of company is favorable as the company is
sufficiently liquid to meet its total short term obligations. In addition to this, it can be inferred
that the company is efficient in utilizing its assets for generating sales and income.
Furthermore, from the analysis of financial figures, the company does not have high financial
leverage and has sufficient liquidity to meet its obligations. Therefore, the solvency position
of company is also favorable. Investors seeking investment in this company will have
positive anticipation of the performance and return generated because of increasing figure of
several valuation ratios measuring the worth of company. Hence, it is deduced that the overall
financial performance of company is favorable enough to make investment.
74
BUSINESS ORGANIZATION ANALYSIS
Reference and Bibliography:
Andadari, R. K., Priyanto, S. H., &Haryanto, J. O. (2016). ANTECEDENTS OF FUTURE
MARKET ANTICIPATION: A BETTER UNDERSTANDING FROM THE FASHION
INDUSTRY IN INDONESIA. International Journal of Organizational Innovation, 8(3).
Arif, T. M. H., Noor-E-Jannat, K., & Anwar, S. R. (2016). Financial Statement and Competitiveness
Analysis: A Study on Tourism & Hospitality Industry in Bangladesh. International Journal of
Financial Research, 7(4), 180-189.
Armstrong, G., Kotler, P., Buchwitz, L. A., Trifts, V., &Gaudet, D. (2015). Marketing: an
introduction.
Artz, L. (2017). Commentary: Transnational capitalism and the new political economy of
transnational media. The Political Economy of Communication, 5(2).
Avota, S., McFadzean, E., &Peiseniece, L. (2015). LINKING PERSONAL AND
ORGANISATIONAL VALUES AND BEHAVIOUR TO CORPORATE
SUSTAINABILITY: A CONCEPTUAL MODEL. Journal of Business Management, (10).
Bartoletti, M., &Pompianu, L. (2017, April). An empirical analysis of smart contracts: platforms,
applications, and design patterns. In International Conference on Financial Cryptography and
Data Security (pp. 494-509). Springer, Cham.
Bartoli, A., Guerrero, J. L., &Hermel, P. (2019). Introduction: What Does Responsibility Mean to
Organizations in the Current Global Context? In Responsible Organizations in the Global
Context (pp. 1-17). Palgrave Macmillan, Cham.
Bischoff, B., & van Dinther, C. (2016). Workflow management systems-an analysis of current open
source products. In DEC (pp. 147-160).
Brown Jr, J. R. (2018). Opening Japan's financial markets. Routledge.
75
BUSINESS ORGANIZATION ANALYSIS
Bussière, M., Schmidt, J., & Valla, N. (2018). International financial flows in the new normal: Key
patterns (and why we should care). In International Macroeconomics in the Wake of the
Global Financial Crisis (pp. 249-269). Springer, Cham.
Cao, M., Chychyla, R., & Stewart, T. (2015). Big Data analytics in financial statement
audits. Accounting Horizons, 29(2), 423-429.
Cao, Y., & Feng, M. (2016). Corporate Social Responsibility Reporting: A Descriptive Study across
Industries. Journal of Applied Business and Economics, 18(7).
Cartlidge, J., & Phelps, S. (2018). Estimating demand for dynamic pricing in electronic
markets. GSTF Journal on Computing (JoC), 1(2).
Chen, K., Luo, P., Xu, D., & Wang, H. (2016). The dynamic predictive power of company
comparative networks for stock sector performance. Information & Management, 53(8),
1006-1019.
Chen, P., Karabarbounis, L., & Neiman, B. (2017). The global rise of corporate saving. Journal of
Monetary Economics, 89, 1-19.
Chen, R., Chang, J. H., & Chen, H. Y. (2016). Trademark identification and expansion-using visual
information map to support trend analysis. Journal of Asian Business Strategy, 6(12), 267-
285.
Chen, R., Chang, J. H., & Chen, H. Y. (2016). Trademark identification and expansion-using visual
information map to support trend analysis. Journal of Asian Business Strategy, 6(12), 267-
285.
Clevenger, M. R., &MacGregor, C. J. (2019). Stakeholder Management and Corporate Social
Responsibility (CSR). Business and Corporation Engagement with Higher Education:
Models, Theories and Best Practices, 67.
Secure Best Marks with AI Grader
Need help grading? Try our AI Grader for instant feedback on your assignments.
76
BUSINESS ORGANIZATION ANALYSIS
Cortez, M. A. A., Ikram, M. I. N., Nguyen, T. T., &Pravini, W. P. (2015). Innovation and financial
performance of electronics companies: A cross-country comparison. Journal of International
Business Research, 14(1), 166-179.
Dattani, P., Director, E. P. G., Still, A., &VikasPota, C. E. O. (2015). About Business Backs
Education and this report.
Davlin, A. (2015). History of cameras: Illustrated timeline.
De Grauwe, P., &Grimaldi, M. (2018). The exchange rate in a behavioral finance framework.
Princeton University Press.
Deveau, D., Allahverdiyev, Z., Corazza, E., Fatullayev, O., Ly, S., & Otto, J. (2015).
PROFESSIONAL SOCIAL NETWORKING.
Dosse, C. (2018). The Position of Banks and Securities Companies in the Japanese Financial Market
and its Effect on International Capital Flows. In Japan's Response to Crisis and Change in the
World Economy (pp. 131-151). Routledge.
Edgington, D. W. (2018). Japanese business down under: Patterns of Japanese investment in
Australia. Routledge.
Edwards, R. D., Magee, J., &Bassetti, W. C. (2018). Technical analysis of stock trends. CRC press.
Epstein, M. J. (2018). Making sustainability work: Best practices in managing and measuring
corporate social, environmental and economic impacts. Routledge.
Fujii, H., &Managi, S. (2018). Trends and priority shifts in artificial intelligence technology
invention: A global patent analysis. Economic Analysis and Policy, 58, 60-69.
Fukuda, S. I. (2018). Companies’ Financial Surpluses and Cash/Deposit Holdings. Public Policy
Review, 14(3), 369-396.
77
BUSINESS ORGANIZATION ANALYSIS
Garga, E., Maiyaki, A. A., &Sagagi, M. S. (2019). Factors Influencing Brand Switching Behaviour
of Mobile Phone Users and the Mediating Effect of Customer Satisfaction: A Literature
Review. Journal of Education, Society and Behavioural Science, 1-11.
Giannone, D., Lenza, M., &Reichlin, L. (2011). Market freedom and the global recession. IMF
Economic Review, 59(1), 111-135.
Grant, R. M. (2016). Contemporary strategy analysis: Text and cases edition. John Wiley & Sons.
Gray, D., &EhoffJr, C. (2015). Sarbanes-Oxley And Dodd Frank: Then There Was Fraud. Journal of
Business & Economics Research (Online), 13(1), 19.
GS, A. D., &Rahmansyah, M. R. (2017). Implementation of Economic Value Added and Market
Value Added Analysis as Valuation Tools of Invest Feasibility. Sinergi:
JurnalIlmiahIlmuManajemen, 7(2).
Hong, S. (2018). Financial Situation Assessment of the Sony Corporation.
Hong, Y. U., & WANG, J. Y. (2017). Analysis and Suggestion on the Development of
SONY. DEStech Transactions on Economics, Business and Management, (icem).
Iqbal, N., Khattak, S. R., &Khattak, M. A. (2013). Does fundamental analysis predict stock returns?
Joshi, A., Pandey, N., Chawla, R., &Patil, P. (2015). Use of data mining techniques to improve the
effectiveness of sales and marketing. International Journal of Computer Science and Mobile
Computing (IJCSMC), 4, 81-87.
Kalyani, J., Bharathi, P., &Jyothi, P. (2016). Stock trend prediction using news sentiment
analysis. arXiv preprint arXiv:1607.01958.
78
BUSINESS ORGANIZATION ANALYSIS
Kaur, M. (2018). Combining financial statement analysis and technical analysis to enhance stock
portfolio performance: A study of Indian stock market (Doctoral dissertation, Punjab
Agricultural University, Ludhiana).
Khan, U. A., Alam, M. N., &Alam, S. (2015). A critical analysis of internal and external
environment of Apple Inc. International Journal of Economics, Commerce and
Management, 3(6), 955-961.
Kidwell, D. S., Blackwell, D. W., Sias, R. W., &Whidbee, D. A. (2016). Financial institutions,
markets, and money. John Wiley & Sons.
Kieżel, M., &Wiechoczek, J. (2016). Internet-based Marketing Tools for Customer Engagement
Management. In Proceedings of the International Marketing Trends Conference, ESCP-
Europe and the Ca’Foscari University Venezia, Venezia.
Koibuchi, S., &Goto, M. (2018). Geographical Distribution of Firm Structure and Capital
Investment: Cases of Major Japanese Exporters. Public Policy Review, 14(3), 461-
488.Hassan, A. A. M., Zaharudin, A., &Yunus, A. M. (2015). Delays in physical distribution:
a case study of sony supply chain solutions Malaysia.
Kotz, H. H., &Schäfer, D. (2017). EU Capital Markets Union: an alluring opportunity or a blind
alley? Concept and micro-perspectives of
CMUs. VierteljahrsheftezurWirtschaftsforschung, 86(1), 5-8.
Krippendorff, K. (2018). Content analysis: An introduction to its methodology. Sage publications.
Kuriakose, S., & Paul, J. (2016). Strategic and financial similarities of bank mergers. Review of
International Business and Strategy, 26(1), 50-68.
Lang, M., &Stice-Lawrence, L. (2015). Textual analysis and international financial reporting: Large
sample evidence. Journal of Accounting and Economics, 60(2-3), 110-135.
Paraphrase This Document
Need a fresh take? Get an instant paraphrase of this document with our AI Paraphraser
79
BUSINESS ORGANIZATION ANALYSIS
Lee, A., Mudambi, R., & Cano-Kollmann, M. (2016). An analysis of Japan’s connectivity to the
global innovation system. Multinational Business Review, 24(4), 399-423.
Lucey, B. M., Vigne, S. A., Ballester, L., Barbopoulos, L., Brzeszczynski, J., Carchano,
O., ...&Goodell, J. W. (2018). Future directions in international financial integration research-
A crowdsourced perspective. International Review of Financial Analysis, 55, 35-49.
MATAS, M. J., Reckhow, M. W., &Taigman, Y. (2018). U.S. Patent Application No. 10/025,972.
Mohanram, P., Saiy, S., & Vyas, D. (2018). Fundamental analysis of banks: the use of financial
statement information to screen winners from losers. Review of Accounting Studies, 23(1),
200-233.
Motoyama, Y. (2016). Global companies, local innovations: why the engineering aspects of
innovation making require co-location. Routledge.
Nagasaka, H. (2019). U.S. Patent Application No. 16/080,131.
Nishimura, A. (2015). Comprehensive opportunity and lost opportunity control model and enterprise
risk management. International Journal of Business and Management, 10(8), 73.
Oki, K. (2016). The history of a mother factory. Annals of Business Administrative Science, 15(1),
29-48.
Oliinyk, V., Kozmenko, O., Wiebe, I., &Kozmenko, S. (2018). Optimal Control over the Process of
Innovative Product Diffusion: The Case of Sony Corporation. Economics &
Sociology, 11(3), 265-285.
Ombaka, C., &Jagongo, A. (2018). Mergers and acquisitions on financial performance among
selected commercial banks, Kenya. International Academic Journal of Economics and
Finance, 3(1), 1-23.
80
BUSINESS ORGANIZATION ANALYSIS
Pilbeam, K. (2018). Finance & financial markets. Macmillan International Higher Education.
Pilbeam, K. (2018). Finance & financial markets. Macmillan International Higher Education.
Rahman, K. M., & Bremer, M. (2016). EFFECTIVE CORPORATE GOVERNANCE AND
FINANCIAL REPORTING IN JAPAN. Asian Academy of Management Journal of
Accounting & Finance, 12.
Rai, B., Kasturi, M., & Huang, C. Y. (2018, August). Analyzing Stock Market Movements Using
News, Tweets, Stock Prices and Transactions Volume Data for APPLE (AAPL), GOOGLE
(GOOG) and SONY (SNE). In Proceedings of the International Conference on Pattern
Recognition and Artificial Intelligence(pp. 109-112). ACM.
Rakhy, K. S., &Vijayan, S. (2018). Digitalisation in Human Resource Management Process, the
Opportunity for the Competence Management in Retail Sector. International Journal of Pure
and Applied Mathematics, 119(12), 2569-2581.
Rezaee, Z. (2016). Business sustainability research: A theoretical and integrated perspective. Journal
of Accounting Literature, 36, 48-64.
Rita, M. R., Priyanto, S. H., Andadari, R. K., &Haryanto, J. O. (2018). How entrepreneurs anticipate
the future market: An initial approach of a future market anticipation model for small
businesses. Journal of Small Business Strategy, 28(1), 49-65.
Rita, M. R., Priyanto, S. H., Andadari, R. K., &Haryanto, J. O. (2018). How entrepreneurs anticipate
the future market: An initial approach of a future market anticipation model for small
businesses. Journal of Small Business Strategy, 28(1), 49-65.
Robinson, T. R., Henry, E., Pirie, W. L., &Broihahn, M. A. (2015). International financial statement
analysis. John Wiley & Sons.
81
BUSINESS ORGANIZATION ANALYSIS
Rowledge, L. R., Barton, R., Brady, K., Fava, J., Figge, C., Saur, K., & Young, S. (2017). Mapping
the Journey: case studies in strategy and action toward sustainable development. Routledge.
Sarrafzadeh, M., Mortazavi, J. B., Li, X., & Chu, K. C. (2019). U.S. Patent Application No.
10/201,746.
Sasaki, S., Koga, H., Krosshaug, T., Kaneko, S., &Fukubayashi, T. (2018). Kinematic analysis of
pressing situations in female collegiate football games: new insight into anterior cruciate
ligament injury causation. Scandinavian journal of medicine & science in sports, 28(3), 1263-
1271.
Schmidlin, N. (2014). The art of company valuation and financial statement analysis: a value
investor's guide with real-life case studies. John Wiley & Sons.
Sisodia, S. (2016). Identification of growth driving factors for ecommerce 2.0 at Tata unistore ltd.
NIFT.
Spicer, A. H. (2017). 'It’s our property and our passion’: Managing creativity in a successful
company–Aardman Animations.
Svatošová, V., &Svobodová, Z. (2016, June). Determination of Financial Strategy of Selected
Company and its Importance for Other Business Development-Case Study. In Proceedings of
the 13th International Scientific Conference European Financial Systems 2016 (pp. 776-786).
Svatošová, V., &Svobodová, Z. (2016, June). Determination of Financial Strategy of Selected
Company and its Importance for Other Business Development-Case Study. In Proceedings of
the 13th International Scientific Conference European Financial Systems 2016 (pp. 776-786).
Tomita, S., &Takefuji, Y. (2016). A Mathematical Model for Optimal Corporate Alliances: Evidence
from Japan.
Secure Best Marks with AI Grader
Need help grading? Try our AI Grader for instant feedback on your assignments.
82
BUSINESS ORGANIZATION ANALYSIS
Udo, G., Bagchi, K., &Kirs, P. (2018). ANALYSIS OF THE GROWTH OF SECURITY
BREACHES: A MULTI-GROWTH MODEL APPROACH. Issues in Information
Systems, 19(4).
Véron, N., & Wolff, G. B. (2016). Capital Markets Union: a vision for the long term. Journal of
Financial Regulation, 2(1), 130-153.
Watson IV, G. F., Weaven, S., Perkins, H., Sardana, D., &Palmatier, R. W. (2018). International
market entry strategies: Relational, digital, and hybrid approaches. Journal of International
Marketing, 26(1), 30-60.
Zetter, K. (2016). The biggest security threats we’ll face in 2016.
1 out of 83
Related Documents


Your All-in-One AI-Powered Toolkit for Academic Success.
+13062052269
info@desklib.com
Available 24*7 on WhatsApp / Email
![[object Object]](/_next/static/media/star-bottom.7253800d.svg)
Unlock your academic potential
© 2024 | Zucol Services PVT LTD | All rights reserved.