logo

Production Flow Assignment 2022


Added on  2022-09-27

5 Pages954 Words26 Views
Assignment on Production Flow
Introduction
Each production process consists of machinery integrated into each other in a manner that the time
taken for each finished product is optimum. However, there are circumstances when one of the
machinery in the production process break down or slows down leading to slowdown of the entire
production process. The report seeks to analyse one such integrated production process by analysing
the downtime of eight integrated machinery. The details of the integrated machinery has been
provided here-in-below:
Terminology of Machines Abbreviations
APM Anode Preparation Machine
APS Anode Preparation Spacing Machine
ASM Anode Scrapping Washing Machine
ECSM East Cathode Stripping Machine
HLW 1 & 2 High Lift Wagons 1 &2
N Crane North Crane
S Crane South Crane
WCSM West Cathode Stripping Machine
Further, the production process flow chart is enclosed herewith and marked as Exhibit-1.
Data for Analysis
The data for analysis includes both for slowdown and for downtime. Further, the data has been
provided for past 26 months on the basis of start time of issue and end time of issue. Also, the data
has been provided for 8 equipment.
Assumption of Analysis
The following are the assumptions undertaken for the purpose of analysing the downtime of
equipment:
(a) Start time for the equipment has been considered for analysis;
(b) There has been no downtime in the month of December, 2018;
(c) Only data for downtime of equipment has been considered for analysis;
Answer 1
The graph for downtime of machinery is drawn here in below:
Dec
Jan
Feb
Mar
Apr
May
Jun
Jul
Aug
Sep
Oct
Nov
Dec
Jan
Feb
Mar
Apr
May
Jun
Jul
Aug
Sep
Oct
Nov
Jan
Feb
20
16
2017 2018 2019
0
200
400
600
800
1000
1200
APM
APS
ASM
ECSM
HLW 1 & 2
N Crane
S Crane
WCSM
Production Flow Assignment 2022_1
Further, the curve for the machinery quarterly wise is depicted as under:
Qtr4 Qtr1 Qtr2 Qtr3 Qtr4 Qtr1 Qtr2 Qtr3 Qtr4 Qtr1
2016 2017 2018 2019
0
500
1000
1500
2000
2500
APM
APS
ASM
ECSM
HLW 1 & 2
N Crane
S Crane
WCSM
The data used for plotting the above curve is enclosed in the excel.
Further, the data depicts the highest downtime in 2017 as against 2018. The month recording the
highest downtime of machinery is December, 2017 and the month recording lowest downtime of
machinery is January,2019 . Also, it has been given to understand that quarter 4 of 2017 has
witnessed the highest downtime of equipment while quarter 1 of 2019 has witnessed the lowest. The
total downtime observed over the period of 2 years stand at 88014 hours.
Answer 2
The Pareto chart is a chart which represents the data both on bar and line graph. Further, the
individual data are represented in bar graph in descending order and the line graph depicts the data
cumulatively. The purpose of preparation of Pareto Chart is to present the most critical of all the
factors. Under, quality control the chart depicts the most common source of defects. In the current
case, the Pareto Chart shall depict the highest downtime for the equipment and the overall downtime
of equipment. The sketch has been drawn on the basis of downtime of machinery and is presented as
under:
Production Flow Assignment 2022_2

End of preview

Want to access all the pages? Upload your documents or become a member.

Related Documents
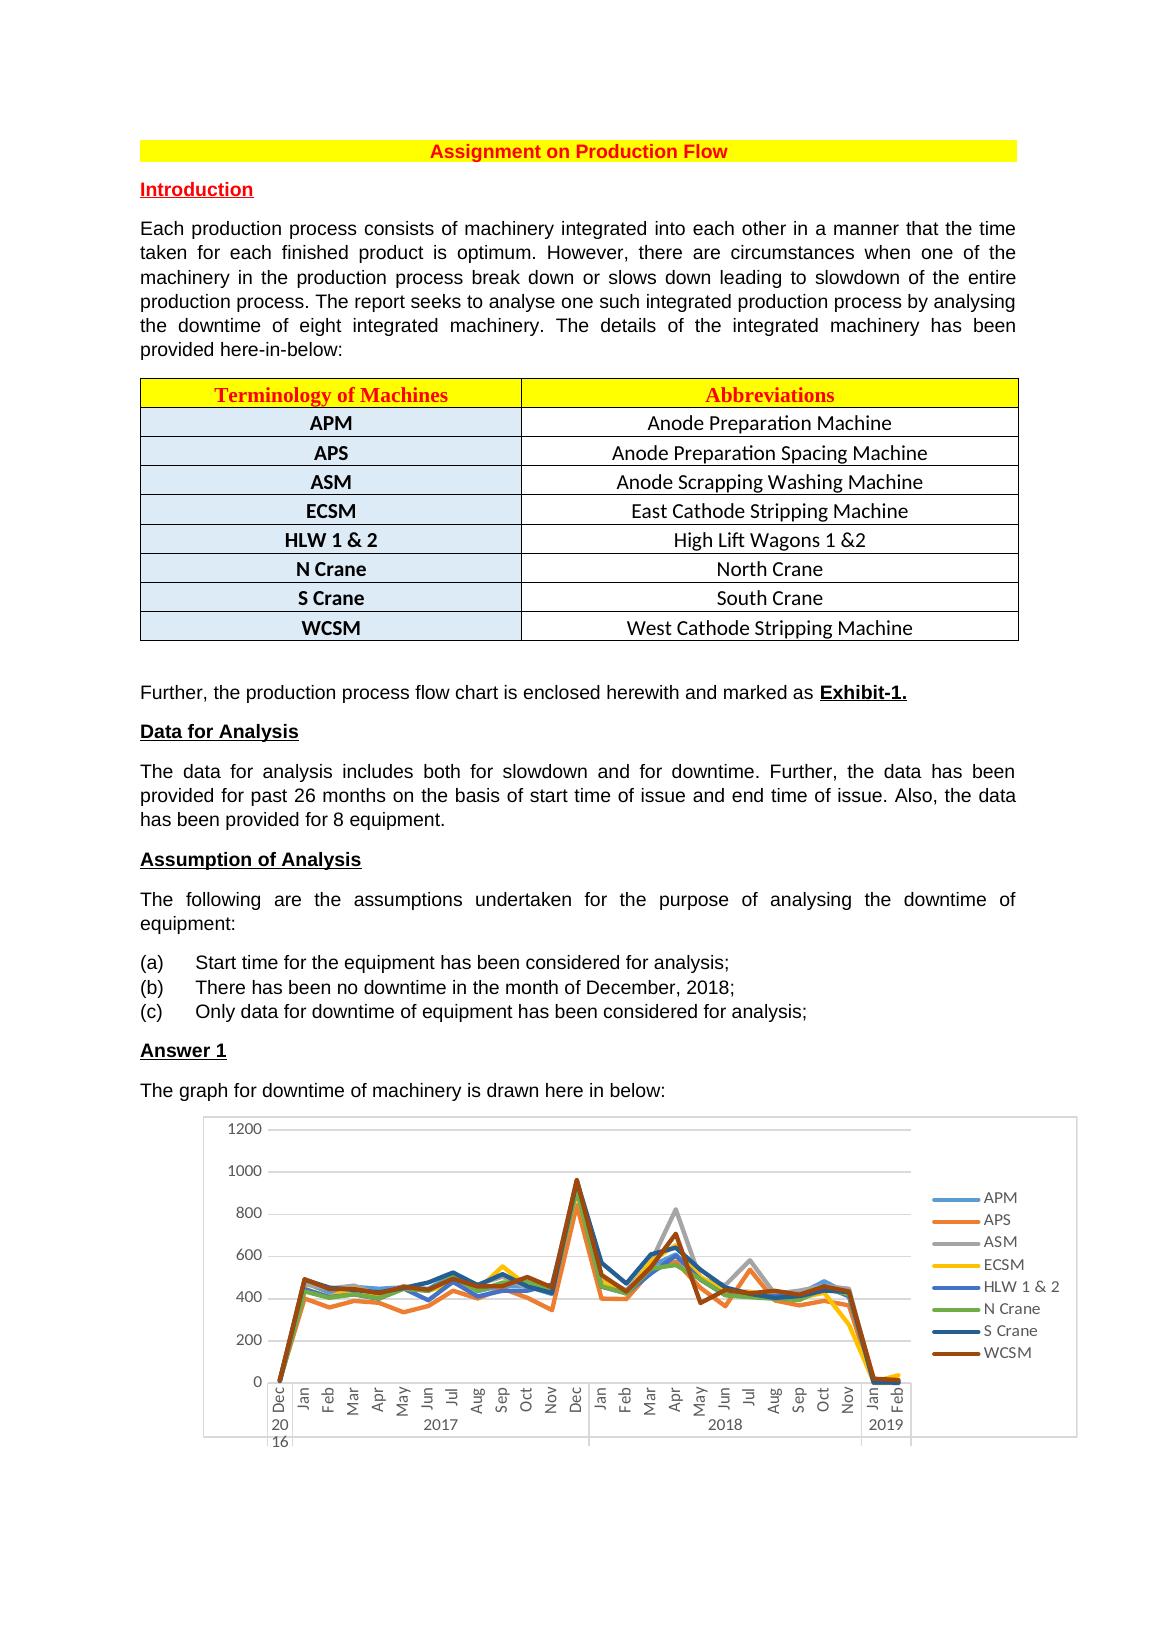
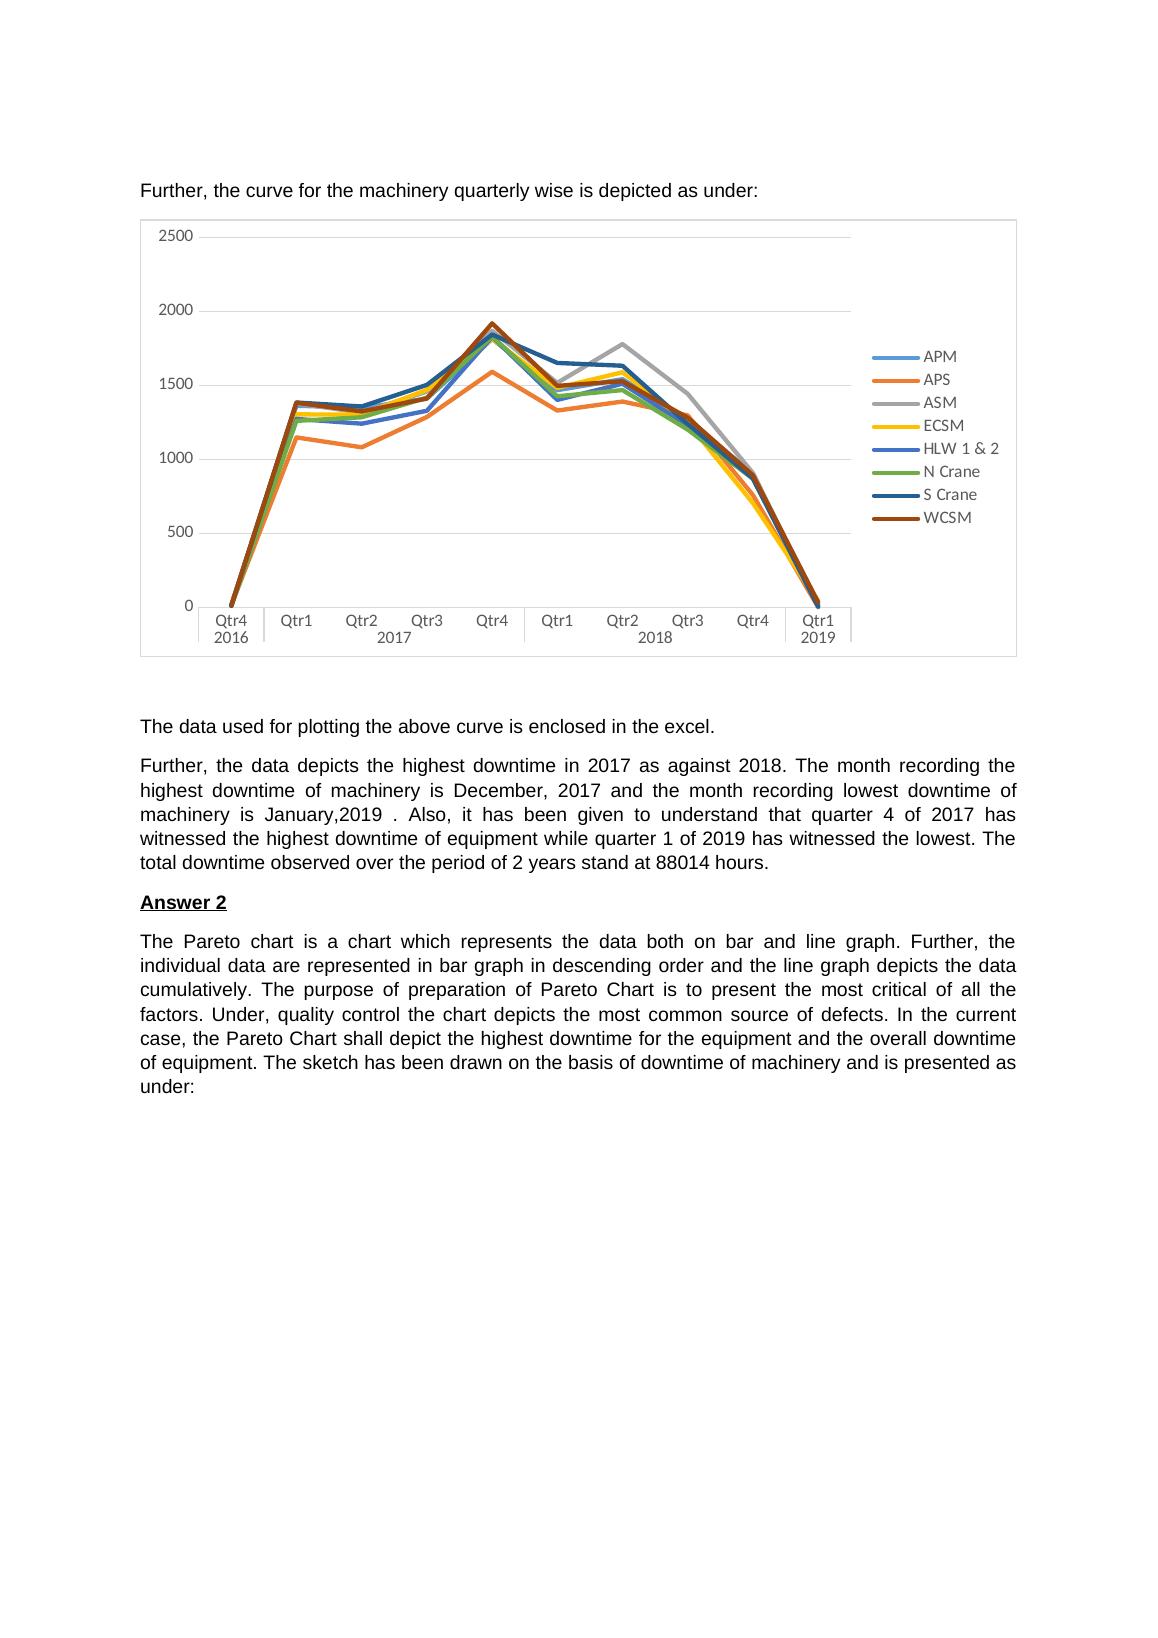
Analysis of Machinery Downtime in an Industrial Facility for 2 Years
|4
|1089
|116

Downtime Analysis Summary of 8 Major Equipment In Continuous Process
|4
|1007
|407

Production Flow- Equipment Down time Assignment 2022
|4
|1211
|18

Analysis of Downtime for 8 Major Machinery in an Industrial Facility
|5
|1126
|351

Equipment Downtime Analysis - Trend, Pareto Analysis and Ranking
|11
|1464
|482

Classification Of Critical Equipment 6 Examination Of The Critical Equipment 7 Investigation Of The Critical Equipment 8 Machines
|11
|1855
|329