Understanding Classifier Performance: Metrics and ROC Curve
Added on 2023-04-20
4 Pages655 Words369 Views
Classifier performance is how much correct classification is made. There are lot of
metrics which measures the performance of the classifier can be used to assess it. Each
classifier produces a probability value which is the threshold to decide the classification
region or zone. If a classifier produces a value of 0 it is definitely negative and if a
classifier produces a value of 1 then it is definitely positive and anything above 0.5 is
considered to be positive. So this probability value can also be called as score of the
classifier
Any threshold is going to produce four types of terms:
True positives (TP)
False positives (FP)
True negatives (TN)
False negatives (FN).
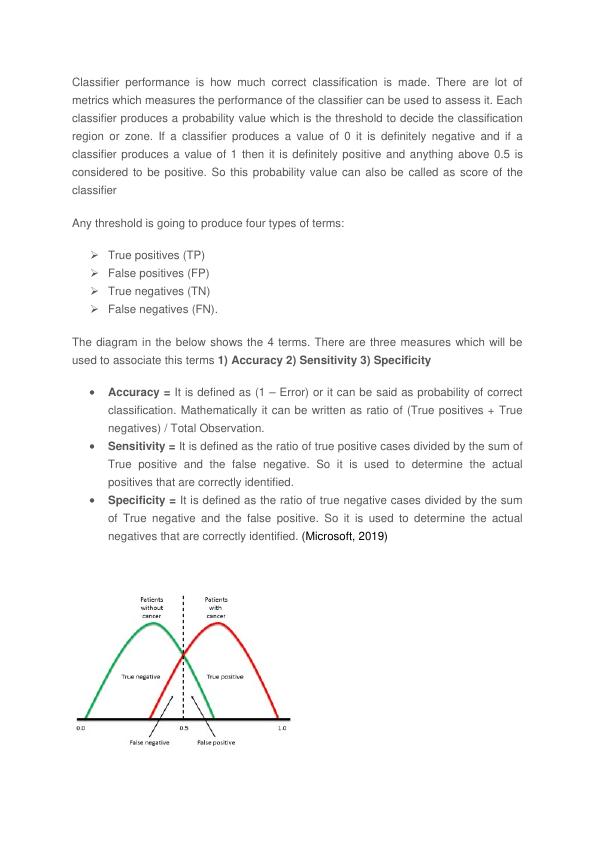
The diagram in the below shows the 4 terms. There are three measures which will be
used to associate this terms 1) Accuracy 2) Sensitivity 3) Specificity
Accuracy = It is defined as (1 – Error) or it can be said as probability of correct
classification. Mathematically it can be written as ratio of (True positives + True
negatives) / Total Observation.
Sensitivity = It is defined as the ratio of true positive cases divided by the sum of
True positive and the false negative. So it is used to determine the actual
positives that are correctly identified.
Specificity = It is defined as the ratio of true negative cases divided by the sum
of True negative and the false positive. So it is used to determine the actual
negatives that are correctly identified. (Microsoft, 2019)
metrics which measures the performance of the classifier can be used to assess it. Each
classifier produces a probability value which is the threshold to decide the classification
region or zone. If a classifier produces a value of 0 it is definitely negative and if a
classifier produces a value of 1 then it is definitely positive and anything above 0.5 is
considered to be positive. So this probability value can also be called as score of the
classifier
Any threshold is going to produce four types of terms:
True positives (TP)
False positives (FP)
True negatives (TN)
False negatives (FN).
The diagram in the below shows the 4 terms. There are three measures which will be
used to associate this terms 1) Accuracy 2) Sensitivity 3) Specificity
Accuracy = It is defined as (1 – Error) or it can be said as probability of correct
classification. Mathematically it can be written as ratio of (True positives + True
negatives) / Total Observation.
Sensitivity = It is defined as the ratio of true positive cases divided by the sum of
True positive and the false negative. So it is used to determine the actual
positives that are correctly identified.
Specificity = It is defined as the ratio of true negative cases divided by the sum
of True negative and the false positive. So it is used to determine the actual
negatives that are correctly identified. (Microsoft, 2019)
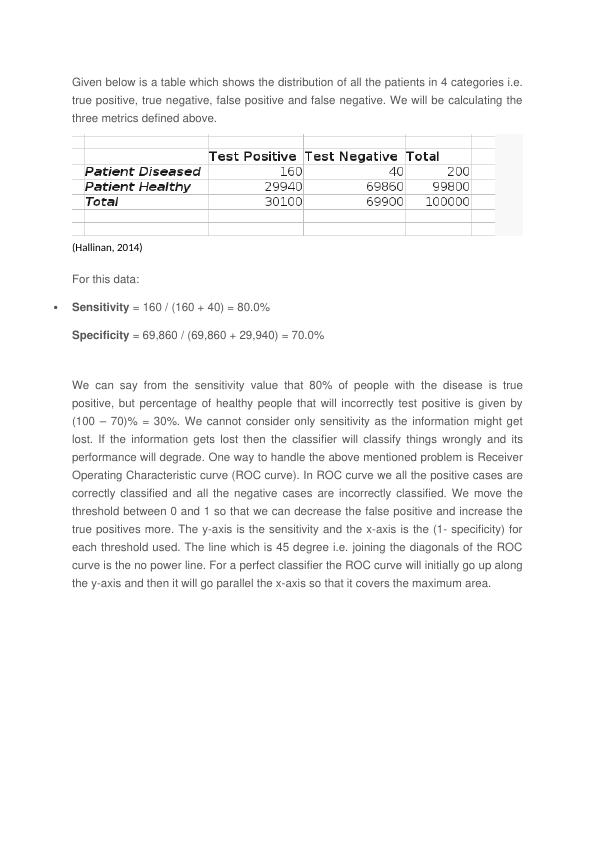
Given below is a table which shows the distribution of all the patients in 4 categories i.e.
true positive, true negative, false positive and false negative. We will be calculating the
three metrics defined above.
(Hallinan, 2014)
For this data:
Sensitivity = 160 / (160 + 40) = 80.0%
Specificity = 69,860 / (69,860 + 29,940) = 70.0%
We can say from the sensitivity value that 80% of people with the disease is true
positive, but percentage of healthy people that will incorrectly test positive is given by
(100 – 70)% = 30%. We cannot consider only sensitivity as the information might get
lost. If the information gets lost then the classifier will classify things wrongly and its
performance will degrade. One way to handle the above mentioned problem is Receiver
Operating Characteristic curve (ROC curve). In ROC curve we all the positive cases are
correctly classified and all the negative cases are incorrectly classified. We move the
threshold between 0 and 1 so that we can decrease the false positive and increase the
true positives more. The y-axis is the sensitivity and the x-axis is the (1- specificity) for
each threshold used. The line which is 45 degree i.e. joining the diagonals of the ROC
curve is the no power line. For a perfect classifier the ROC curve will initially go up along
the y-axis and then it will go parallel the x-axis so that it covers the maximum area.
End of preview
Want to access all the pages? Upload your documents or become a member.
Related Documents
Weka: Data Mining and Machine Learning Topic 2022lg...
|13
|1214
|16
(solved) Epidemiology Assignmentlg...
|5
|835
|136
Business Analytics Assignment (Solved)lg...
|12
|1793
|236