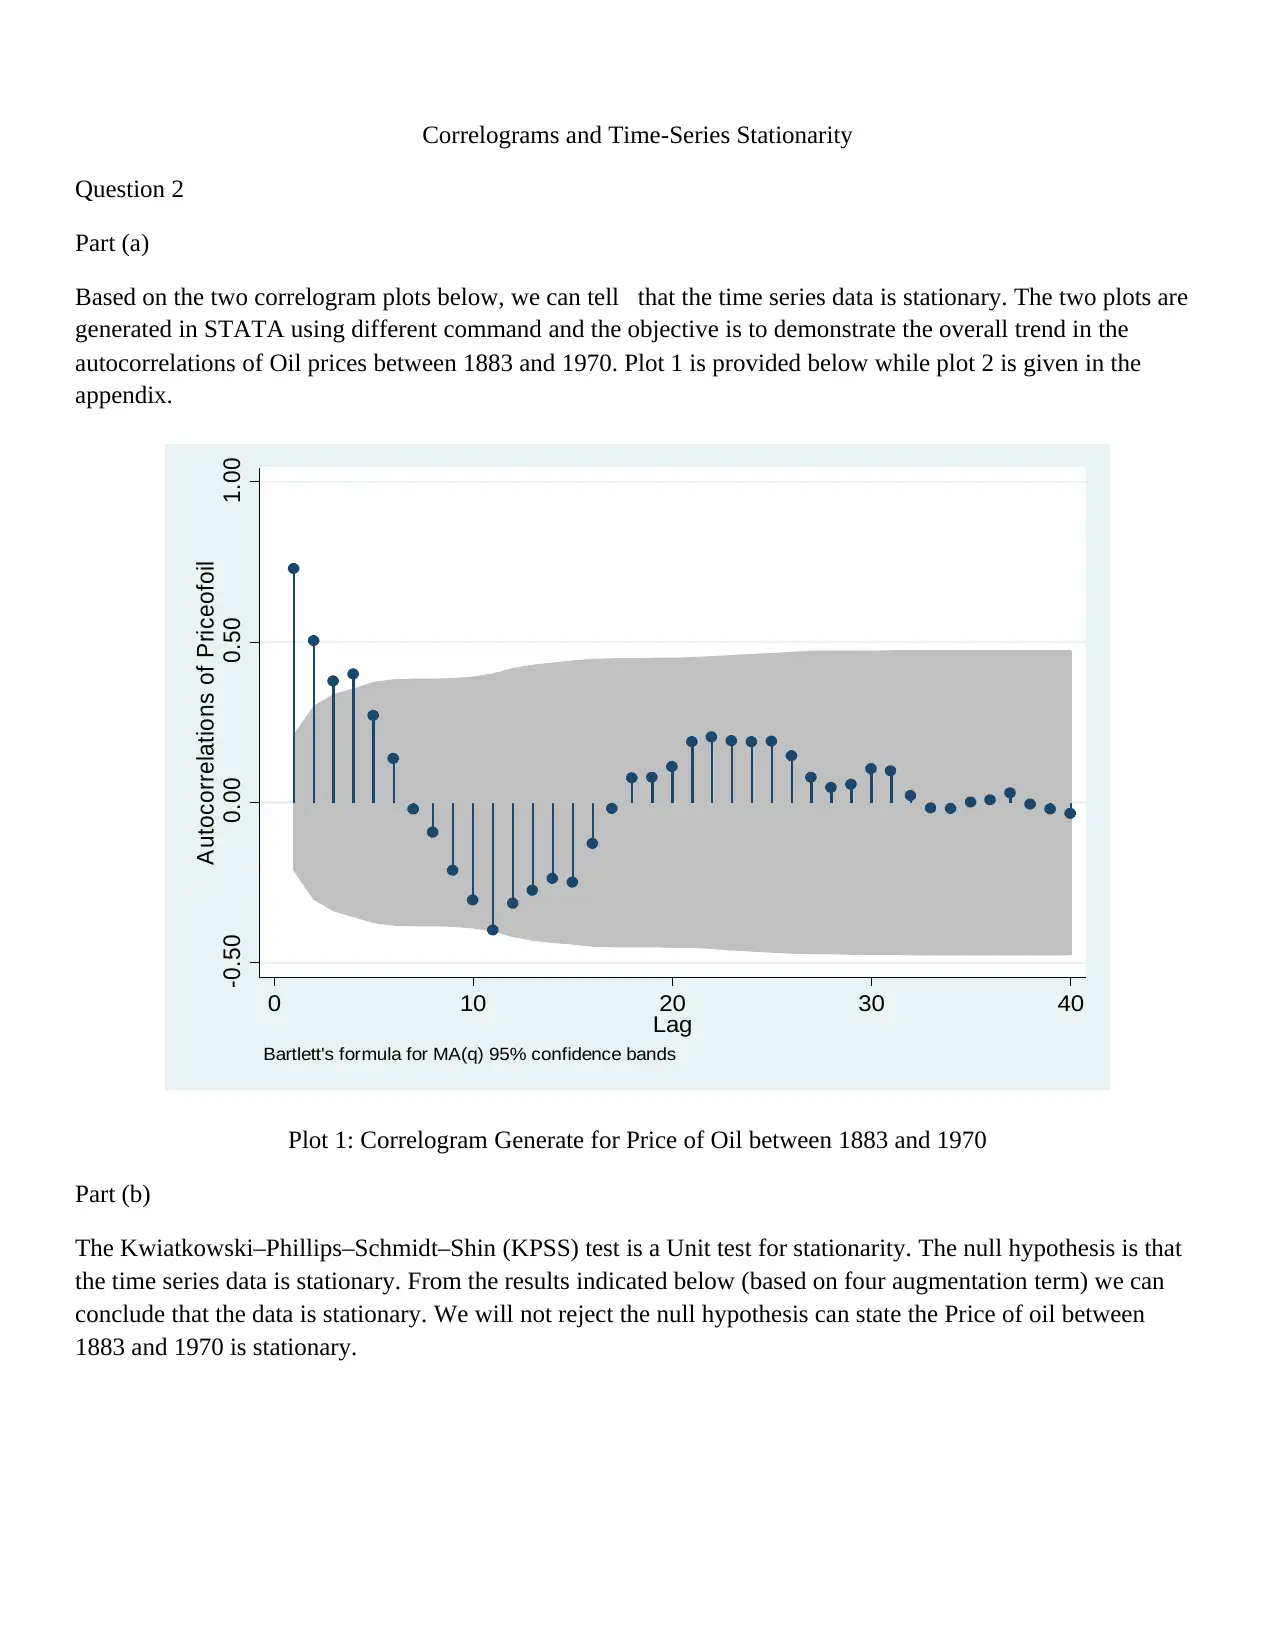
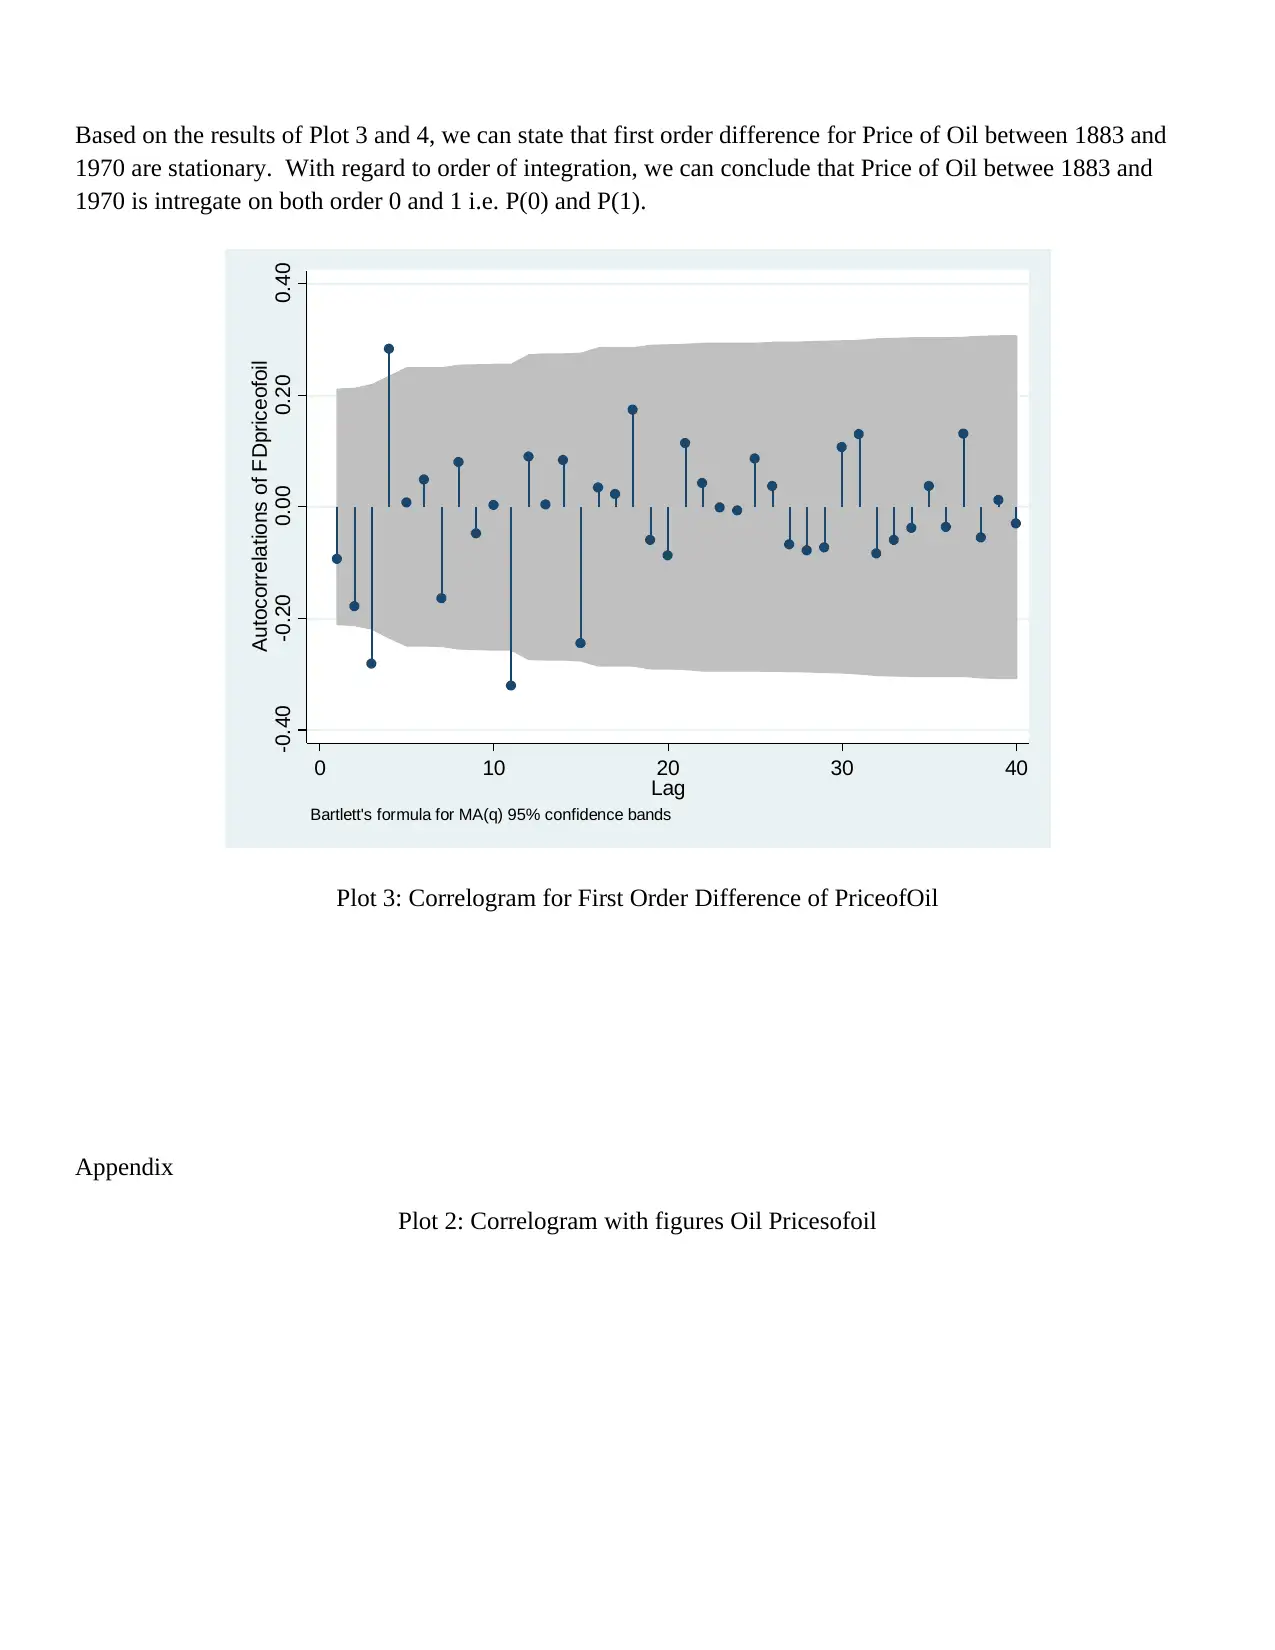
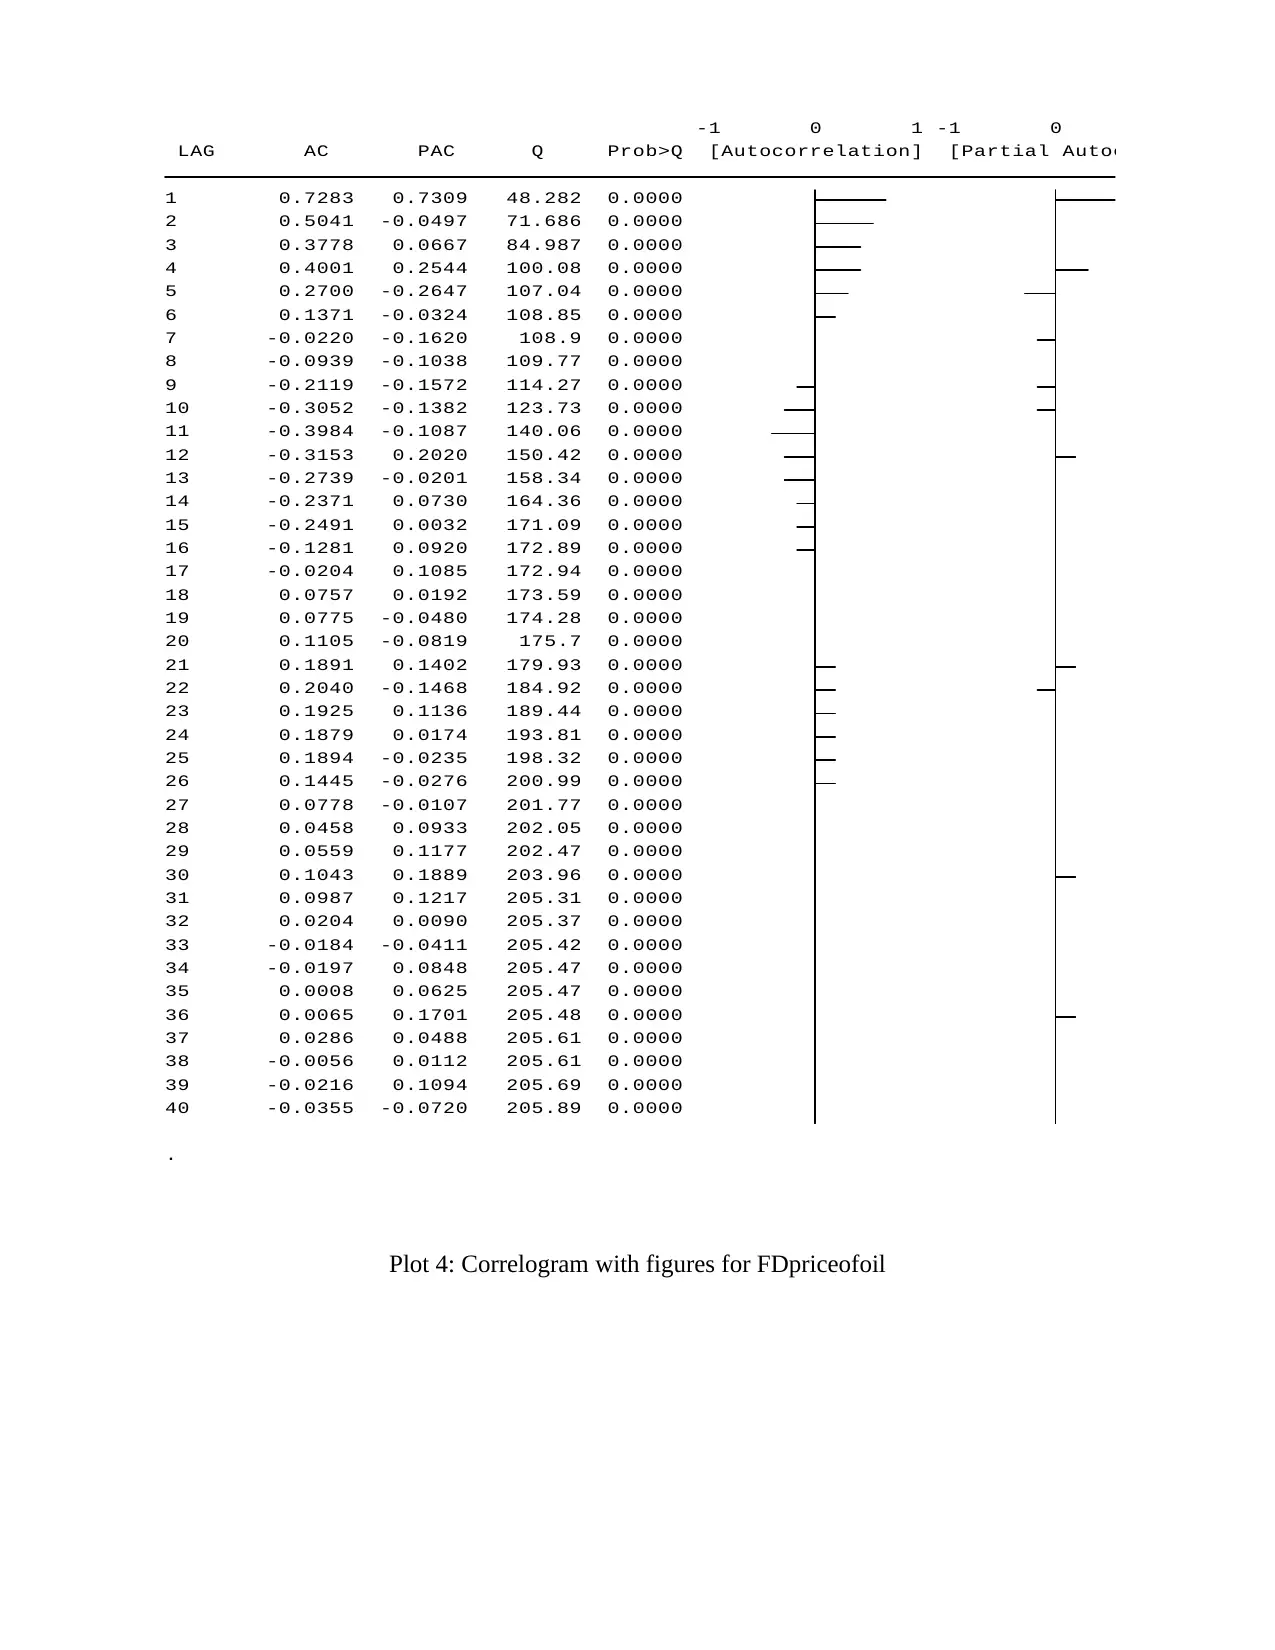
Correlograms and Time-Series Stationarity
VerifiedAdded on 2023/04/19
|5
|929
|100
AI Summary
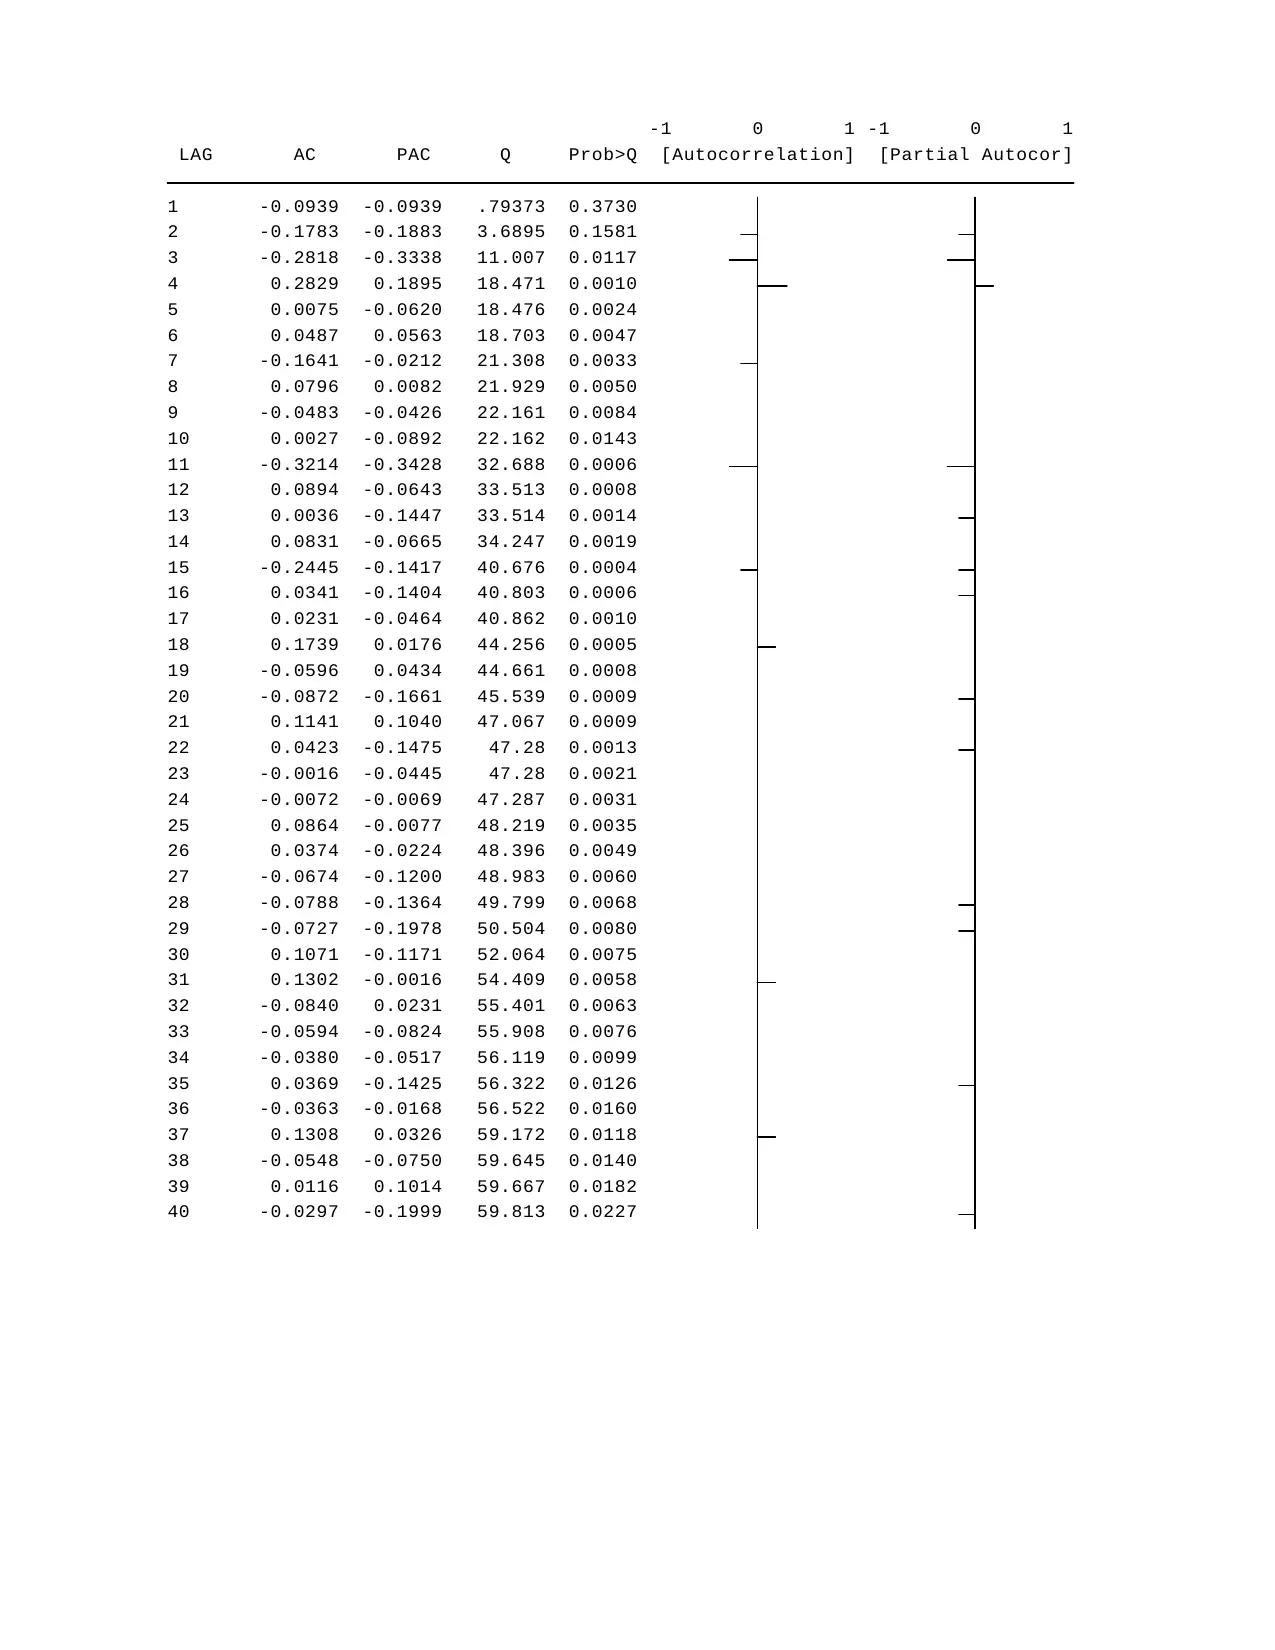
This study material discusses correlograms and time-series stationarity. It includes plots of autocorrelations of oil prices between 1883 and 1970, as well as the results of the Kwiatkowski–Phillips–Schmidt–Shin (KPSS) test and the Augmented Dickey-Fuller test. The material concludes that the price of oil between 1883 and 1970 is stationary.
Contribute Materials
Your contribution can guide someone’s learning journey. Share your
documents today.
1 out of 5
Related Documents


Your All-in-One AI-Powered Toolkit for Academic Success.
+13062052269
info@desklib.com
Available 24*7 on WhatsApp / Email
![[object Object]](/_next/static/media/star-bottom.7253800d.svg)
© 2024 | Zucol Services PVT LTD | All rights reserved.