logo

Cost of Living Information for International Students

8 Pages2396 Words93 Views
   

Singapore University of Social Sciences


BUS100 Professional Communication Skills (BUS100)


Added on  2020-02-24

About This Document

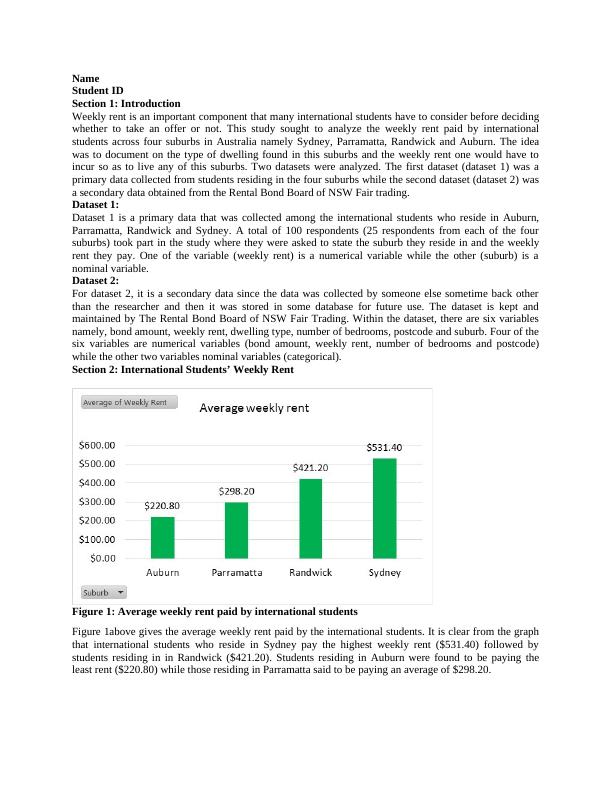
You've chosen to study in the United States, and one of the major elements to consider for a student pursuing education overseas is how much money they'll need to spend on living expenses each month.

Cost of Living Information for International Students


Singapore University of Social Sciences


BUS100 Professional Communication Skills (BUS100)

   Added on 2020-02-24

ShareRelated Documents
NameStudent IDSection 1: Introduction Weekly rent is an important component that many international students have to consider before decidingwhether to take an offer or not. This study sought to analyze the weekly rent paid by internationalstudents across four suburbs in Australia namely Sydney, Parramatta, Randwick and Auburn. The ideawas to document on the type of dwelling found in this suburbs and the weekly rent one would have toincur so as to live any of this suburbs. Two datasets were analyzed. The first dataset (dataset 1) was aprimary data collected from students residing in the four suburbs while the second dataset (dataset 2) wasa secondary data obtained from the Rental Bond Board of NSW Fair trading. Dataset 1: Dataset 1 is a primary data that was collected among the international students who reside in Auburn,Parramatta, Randwick and Sydney. A total of 100 respondents (25 respondents from each of the foursuburbs) took part in the study where they were asked to state the suburb they reside in and the weeklyrent they pay. One of the variable (weekly rent) is a numerical variable while the other (suburb) is anominal variable.Dataset 2:For dataset 2, it is a secondary data since the data was collected by someone else sometime back otherthan the researcher and then it was stored in some database for future use. The dataset is kept andmaintained by The Rental Bond Board of NSW Fair Trading. Within the dataset, there are six variablesnamely, bond amount, weekly rent, dwelling type, number of bedrooms, postcode and suburb. Four of thesix variables are numerical variables (bond amount, weekly rent, number of bedrooms and postcode)while the other two variables nominal variables (categorical). Section 2: International Students’ Weekly Rent Figure 1: Average weekly rent paid by international studentsFigure 1above gives the average weekly rent paid by the international students. It is clear from the graphthat international students who reside in Sydney pay the highest weekly rent ($531.40) followed bystudents residing in in Randwick ($421.20). Students residing in Auburn were found to be paying theleast rent ($220.80) while those residing in Parramatta said to be paying an average of $298.20.
Cost of Living Information for International Students_1
Table 1: Descriptive StatisticsAuburnParramattaRandwickSydneyMean220.80298.20421.20531.40Standard Error4.175.907.627.94Median230.00295.00420.00530.00Mode230.00260.00405.00530.00Standard Deviation20.8529.5138.0939.70Sample Variance434.75870.581450.581576.08Kurtosis-0.81-1.13-0.50-0.55Skewness-0.530.08-0.20-0.32Range70.00100.00135.00145.00Minimum180.00250.00350.00450.00Maximum250.00350.00485.00595.00Sum5520.007455.0010530.0013285.00Count25.0025.0025.0025.00Confidence Level (95.0%)8.6112.1815.7216.39Table 1 above gives the descriptive statistics of the data where we observe that the highest averageweekly rent paid was in Sydney while the lowest average weekly rent paid was in Auburn. Majority ofpeople in Auburn paid $230, in Parramatta majority said to be paying $260, Randwick it was $405 whileSydney it was $530.Section 3: Rental Bond Board Property Data – Dwelling Type Figure 2: Dwelling TypesFigure 2 above presents a bar chart of the dwelling type, it can clearly be seen that most of theparticipants who partook the study live in flats (96%, n =470) while the minority live in houses (4%, n =21).
Cost of Living Information for International Students_2
Table 2: One-Sample StatisticsNMeanStd. DeviationStd. ErrorMeanDwelling Type500.04.201.009Table 3: One-Sample TestTest Value = 0.1tdfSig. (2-tailed)MeanDifference95% Confidence Interval of theDifferenceLowerUpperDwelling Type-6.459499.000-.058-.08-.04To determine whether there is enough evidence that the proportion of House dwelling type is less than10%, we performed a one-sample t-test at 5% level of significance. Results are shown in tables 2 and 3above. As can be seen, the proportion of people who lived in houses was 0.04 and this was significantlylower than the hypothesized proportion of 0.1, a mean difference of -0.058 was found to be statisticallysignificant (95% CI, -0.08 to -0.04), t(499) = -6.46, p = .000.Figure 3 above gives the comparison in terms of the proportions of the dwelling types based on thesuburb. Sydney had 100% of all the respondents living in flats (n = 177) while Auburn had the highestproportion of people living in houses (28%, n = 16). Parramatta and Randwick had 3% (n = 4) and 1% (n= 1) of the respondents living in houses respectively. Based on the above results, the advice I would give to clients who would like to rent a house instead of aflat would be to consider going to Auburn city since it is the only suburb that has more respondents livingin houses. In Sydney for instance, there was nobody interviewed who said to live in a house, this couldeither mean that there are a few houses to be rented in Sydney and other suburbs that saw a very lowproportion of people living in houses. Figure 3: Dwelling type versus suburb
Cost of Living Information for International Students_3

End of preview

Want to access all the pages? Upload your documents or become a member.

Related Documents
Australia as a top five destination for international students
|8
|2045
|148

Higher Education in Australia
|8
|1719
|43

BUS708 - Statistics and Data Analysis Assignment
|14
|2112
|65

BUS708 Statistics and Data Analysis Assignment
|12
|1613
|61

Datasets Analysis Report Assignment
|7
|1428
|94

Data related to dwelling type and numerical display
|18
|2659
|275