Business Statistics Assessment 1 v2.1
Added on 2023-04-26
32 Pages5850 Words87 Views
T-1.8.1
Details of Assessment
Term and Year T4 2018 Time allowed 7 Weeks
Assessment No 1 of 2 Assessment Weighting 50%
Assessment Type Portfolio of Activities
Due Date Week 7 Room TBA
Details of Subject
Qualification FNS60217Advanced Diploma of Accounting
Subject Name Business Statistics
Details of Unit(s) of competency
Unit Code and
Title
FNSINC602 Interpret and use financial statistics and tools
Details of Student
Student
Name
Student ID College
Student Declaration: I declare that the work
submitted is my own, and has not been copied or
plagiarised from any person or source.
Signature: ___________________________
Date: _______/________/_______________
Details of Assessor
Assessor’s Name
Assessment Outcome
Results
Competent Not Yet Competent
Marks 50
FEEDBACK TO STUDENT
Progressive feedback to students, identifying gaps in competency and comments on positive improvements:
______________________________________________________________________________
______________________________________________________________________________
______________________________________________________________________________
______________________________________________________________________________
______________________________________________________________________________
Student Declaration: I declare that I have been
assessed in this unit, and I have been advised of my
result. I also am aware of my appeal rights and
reassessment procedure.
Signature: ____________________________
Date: ____/_____/_____
Assessor Declaration: I declare that I have
conducted a fair, valid, reliable and flexible
assessment with this student, and I have provided
appropriate feedback
Student did not attend the feedback session.
Feedback provided on assessment.
Signature: ____________________________
Date: ____/_____/_____
Business Statistics, Assessment 1, v2.1 Page 1
T-1.8.1
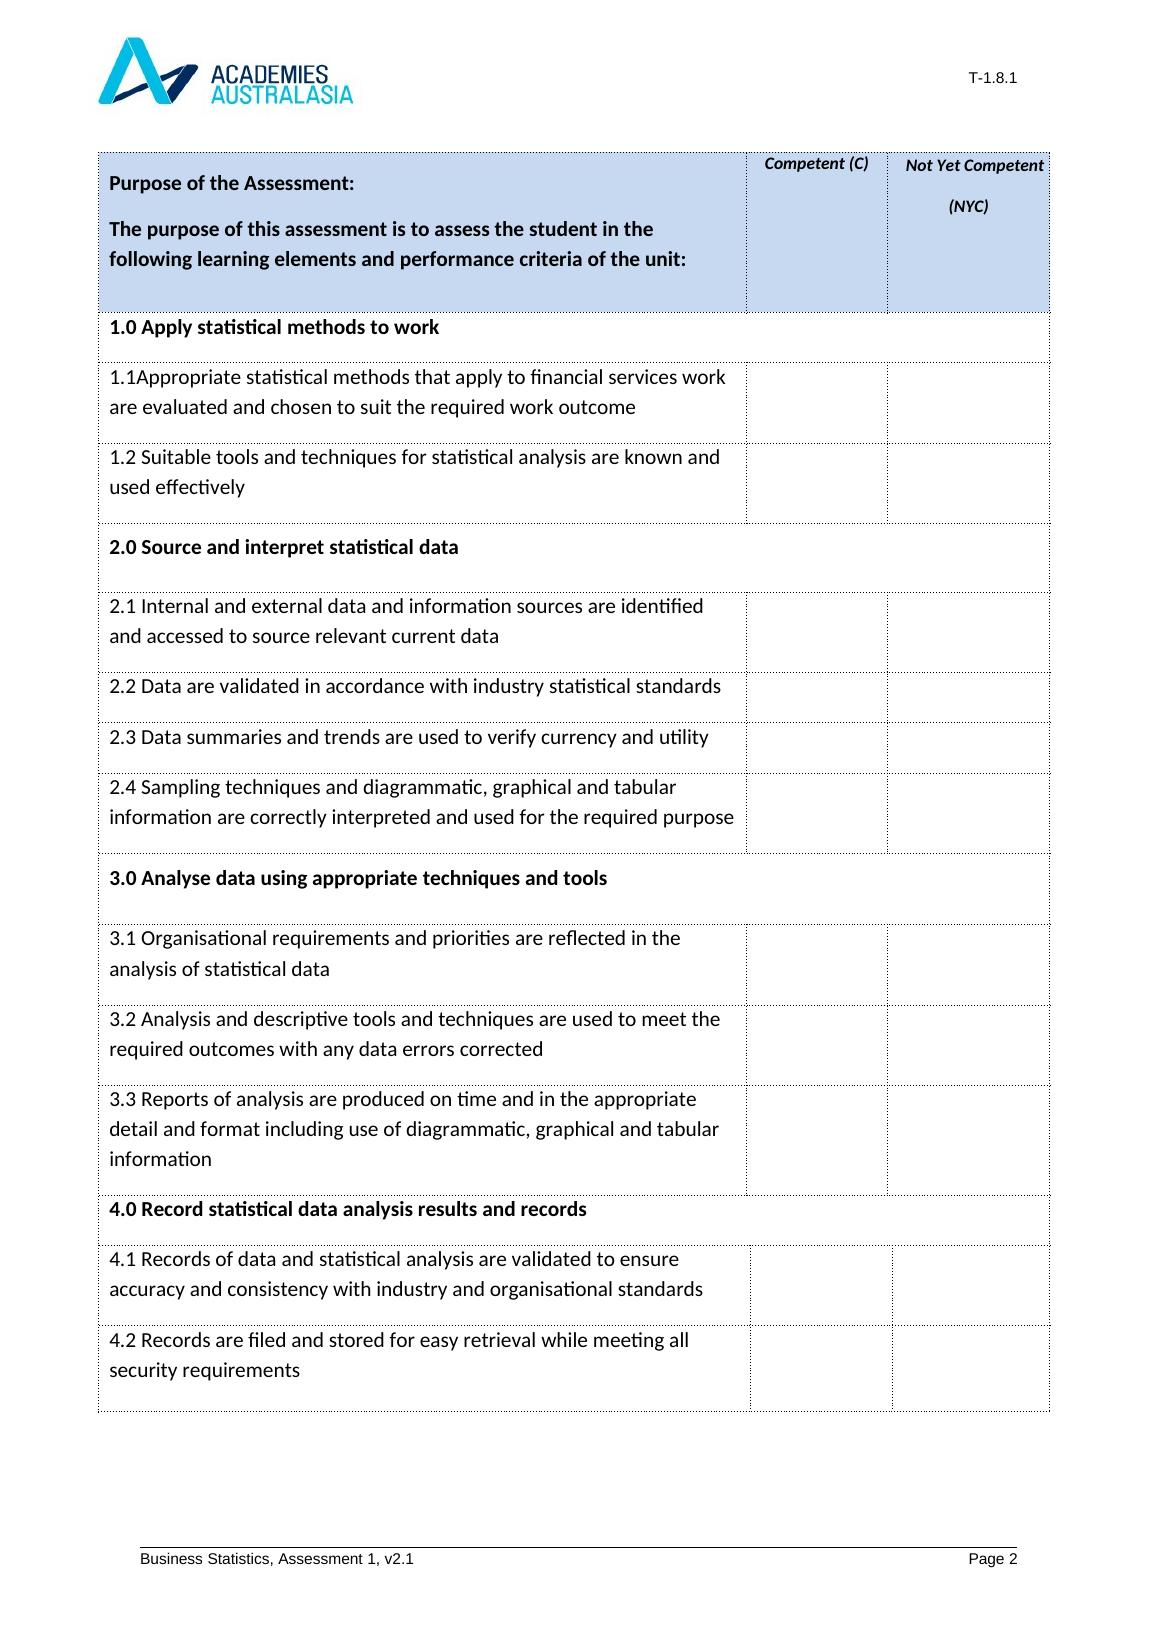
Purpose of the Assessment:
The purpose of this assessment is to assess the student in the
following learning elements and performance criteria of the unit:
Competent (C) Not Yet Competent
(NYC)
1.0 Apply statistical methods to work
1.1Appropriate statistical methods that apply to financial services work
are evaluated and chosen to suit the required work outcome
1.2 Suitable tools and techniques for statistical analysis are known and
used effectively
2.0 Source and interpret statistical data
2.1 Internal and external data and information sources are identified
and accessed to source relevant current data
2.2 Data are validated in accordance with industry statistical standards
2.3 Data summaries and trends are used to verify currency and utility
2.4 Sampling techniques and diagrammatic, graphical and tabular
information are correctly interpreted and used for the required purpose
3.0 Analyse data using appropriate techniques and tools
3.1 Organisational requirements and priorities are reflected in the
analysis of statistical data
3.2 Analysis and descriptive tools and techniques are used to meet the
required outcomes with any data errors corrected
3.3 Reports of analysis are produced on time and in the appropriate
detail and format including use of diagrammatic, graphical and tabular
information
4.0 Record statistical data analysis results and records
4.1 Records of data and statistical analysis are validated to ensure
accuracy and consistency with industry and organisational standards
4.2 Records are filed and stored for easy retrieval while meeting all
security requirements
Business Statistics, Assessment 1, v2.1 Page 2
T-1.8.1
Assessment/evidence gathering conditions
Each assessment component is recorded as either Competent (C) or Not Yet Competent (NYC). A student
can only achieve competence when all assessment components listed under Purpose of the assessment
section are Satisfactory. Your trainer will give you feedback after the completion of each assessment. A
student who is assessed as NS (Not Satisfactory) is eligible for re-assessment.
Resources required for this Assessment
All documents must be completed in the class
Upon completion, submit the assessment to your trainer.
Refer to the notes on eLearning to answer the tasks
Any additional material will be provided by Trainer
Instructions for Students
Please read the following instructions carefully
This assessment is to be completed according to the instructions given by your assessor.
Feedback on each task will be provided to enable you to determine how your work could be improved.
You will be provided with feedback on your work within 2 weeks of the assessment due date. All other
feedbacks will be provided by the end of the term.
Should you not answer the questions correctly, you will be given feedback on the results and your gaps
in knowledge. You will be given another opportunity to demonstrate your knowledge and skills to be
deemed competent for this unit of competency.
If you are not sure about any aspects of this assessment, please ask for clarification from your
assessor.
Please refer to the College re-assessment and re-sit policy for more information.
Business Statistics, Assessment 1, v2.1 Page 3
T-1.8.1
Assessment 1 (50 Marks)
Instructions:
This is an individual assessment.
This assessment need to be completed in class and at home
The purpose of this assessment task is to assess the students’ knowledge
essential to interpreting and analysing financial statistical data in a range of
contexts and industry settings.
To make full and satisfactory responses you should consult a range of
learning resources, other information such as handouts and learners’
resources and slides on Elearning.
Make sure you attempt all the assessment tasks.
You may attach a separate sheet if required.
You must fill out the cover page of the assessment
You can use pencils to answer questions and for drawing alternatively you
may work on MS Word and Excel. And submit hard copy.
You must staple the loose sheets together along with the cover page.
You must attach the loose sheets chronologically as per the page numbers.
Resources required to complete the assessment task:
Computer
Internet
MS Word & Excel
Printer or e-printer
Adobe acrobat/reader
Learning management system (Elearning access)
Assessment Instruction:
You are required to complete 17 tasks for this assessment. These tasks are to be
completed in 7 weeks during class time and at home. Details marks are provided
alongside the individual tasks. By the end week 7 you are required to submit hard
copy of your completed assessment to your class teacher during class time.
Week 1: Introduction to Statistics and Visual Presentation of Data9 marks
Business Statistics, Assessment 1, v2.1 Page 4
T-1.8.1
Task 1: (2 marks)
a. Define population and sample. Explain why sample is preferred than
population. Which Australian Government Organisation surveys the
total population of Australia?
In statistics, population is the whole set of observations likely to be made from
a defined group being studied or under collection of information for making
decisions that are data driven. Even though population is usually used to refer
to people, it may also mean things. For example, if we are studying the age of
students admitted to Academies Australasia last year then the population will
be the set of ages of all the students admitted last year or average daily
temperatures for Melbourne city in January. A sample on the other hand
refers to a part, fraction or a percentage of population containing the traits of
the large population. Therefore, population is whole where as sample is just
but a portion of the population. A sample is usually of utmost importance for
large population and is often used by researchers due the fact that it is a bit
impractical studying the entire/large population. Sampling should unbiasedly
exhibit the features of the entire population. Most often researchers would like
to know more about a population but lack all the data needed. It is at this point
that they resolve to a sample to represent the general trends that he/she may
need.
Sampling is preferred to entire population due to a number of reasons: When
the economy is tight presented with limited resources and time is of utmost
importance, then sample qualifies to be the best option. As a result, a sample
saves on money, effort, and time that would otherwise be consumed while
collecting data from the entire population. Besides, lists in samples are up-to-
date and that errors are easily controlled as opposed to population. Lastly, the
researcher is likely to know who makes up the population an act which has
proven impractical with a population.
Survey of the total Australian population is done by the Australian Bureau of
Statistics (ABS), an independent statistical agency of the Australian
Government and is headquartered at Canberra. ABS conducts census at an
interval of five years whereby the last census was conducted in 9 August,
2016. Also the bureau collects data on environmental issues, health, research
and innovation, crime, and education.
Business Statistics, Assessment 1, v2.1 Page 5
T-1.8.1
b. State the most common methods of collecting primary data. What are
the advantages of collecting secondary data? Give examples of major
secondary data collection sources?
Primary data are the first hand data collected by the researcher
himself/herself. The most common methods of collecting primary data are
interviews, surveys, and questionnaires. Other methods are ethnographies,
focus groups, content analysis and direct observations. Secondary sources
are categorized as either published or unpublished. Examples of major
secondary data sources are surveys, organization records, census and data
obtained through qualitative research. Other sources include professional and
business associations, media and internet sources, think tanks, and
foundations among others.
Collection of secondary data is of varied advantages: to begin with, secondary
data saves on time that would have been spent in collecting the data
specifically the quantitative data since it is easier to access and retrieve.
Besides, the cost of collecting secondary data is much cheaper than the
primary data. Secondary data are already documented hence the researcher
can easily access them through the print-outs, internet, media or the
publication containing the relevant information. Therefore, this process is
relatively cost effective compared to primary sources where the investigator
has to go through the tedious process manually.
In addition, collection of secondary data provides large and quality data that
may not be obtained by primary methods since a lot of relevant information is
already gathered and stored. In addition, it is feasible for international and
longitudinal comparative studies. Furthermore, while collecting data through
secondary means, one is presented with a predetermined reliability and
validity making it easier for the researcher to re-examine data before finally
using it. Moreover, collection of secondary data may clarify and sometimes
answer the research question.
Task 2: (2 + 1 = 3 marks)
Business Statistics, Assessment 1, v2.1 Page 6
T-1.8.1
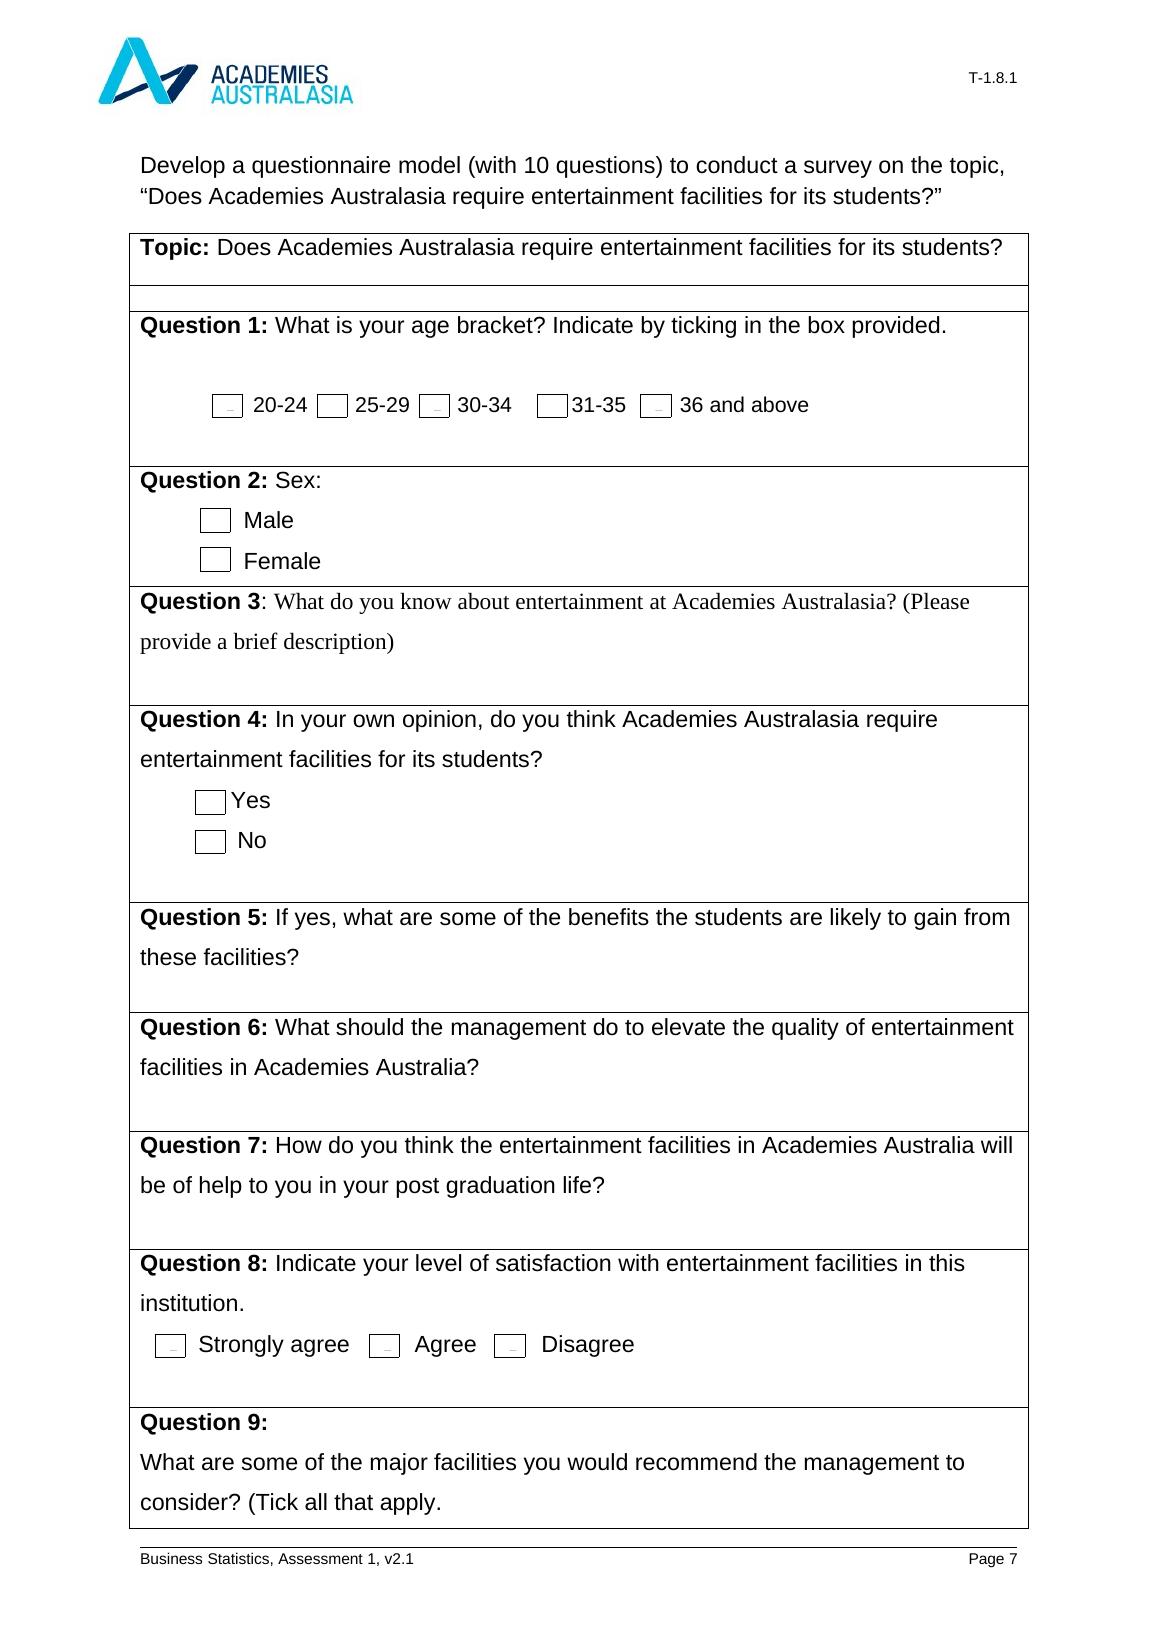
Develop a questionnaire model (with 10 questions) to conduct a survey on the topic,
“Does Academies Australasia require entertainment facilities for its students?”
Topic: Does Academies Australasia require entertainment facilities for its students?
Question 1: What is your age bracket? Indicate by ticking in the box provided.
20-24 25-29 30-34 31-35 36 and above
Question 2: Sex:
Male
Female
Question 3: What do you know about entertainment at Academies Australasia? (Please
provide a brief description)
Question 4: In your own opinion, do you think Academies Australasia require
entertainment facilities for its students?
Yes
No
Question 5: If yes, what are some of the benefits the students are likely to gain from
these facilities?
Question 6: What should the management do to elevate the quality of entertainment
facilities in Academies Australia?
Question 7: How do you think the entertainment facilities in Academies Australia will
be of help to you in your post graduation life?
Question 8: Indicate your level of satisfaction with entertainment facilities in this
institution.
Strongly agree Agree Disagree
Question 9:
What are some of the major facilities you would recommend the management to
consider? (Tick all that apply.
Business Statistics, Assessment 1, v2.1 Page 7
z z z z z
z
z
z
z
z z z
T-1.8.1
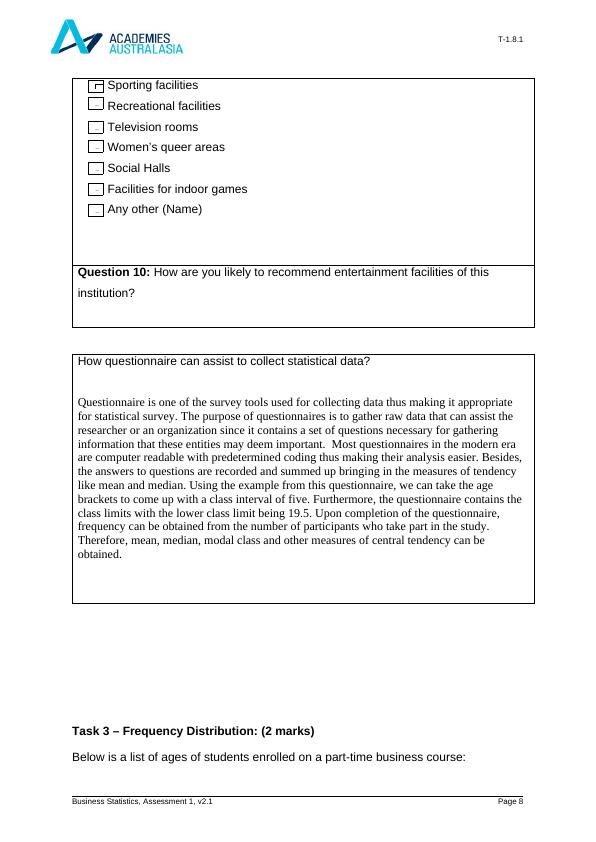
Sporting facilities
Recreational facilities
Television rooms
Women’s queer areas
Social Halls
Facilities for indoor games
Any other (Name)
Question 10: How are you likely to recommend entertainment facilities of this
institution?
How questionnaire can assist to collect statistical data?
Questionnaire is one of the survey tools used for collecting data thus making it appropriate
for statistical survey. The purpose of questionnaires is to gather raw data that can assist the
researcher or an organization since it contains a set of questions necessary for gathering
information that these entities may deem important. Most questionnaires in the modern era
are computer readable with predetermined coding thus making their analysis easier. Besides,
the answers to questions are recorded and summed up bringing in the measures of tendency
like mean and median. Using the example from this questionnaire, we can take the age
brackets to come up with a class interval of five. Furthermore, the questionnaire contains the
class limits with the lower class limit being 19.5. Upon completion of the questionnaire,
frequency can be obtained from the number of participants who take part in the study.
Therefore, mean, median, modal class and other measures of central tendency can be
obtained.
Task 3 – Frequency Distribution: (2 marks)
Below is a list of ages of students enrolled on a part-time business course:
Business Statistics, Assessment 1, v2.1 Page 8
z
z
z
z
z
z
z
End of preview
Want to access all the pages? Upload your documents or become a member.
Related Documents
Innovation and Continuous Improvement Plan for a Restaurantlg...
|51
|8082
|303
Resource Allocation and Register Manual Assessment for BSB61015 Advanced Diploma of Leadership and Managementlg...
|29
|4163
|202
T-1.8.1. Details of Assessment Term and Year. 1, 2019.lg...
|23
|5113
|87
Program Benefits Analysis for XXXlg...
|26
|6198
|22
FNSACC414 & FNSACC412 Assignment - Accounting and Budgetinglg...
|11
|2778
|416
Assessment No.2 for BSB51915 Diploma of Leadership and Managementlg...
|11
|5115
|491