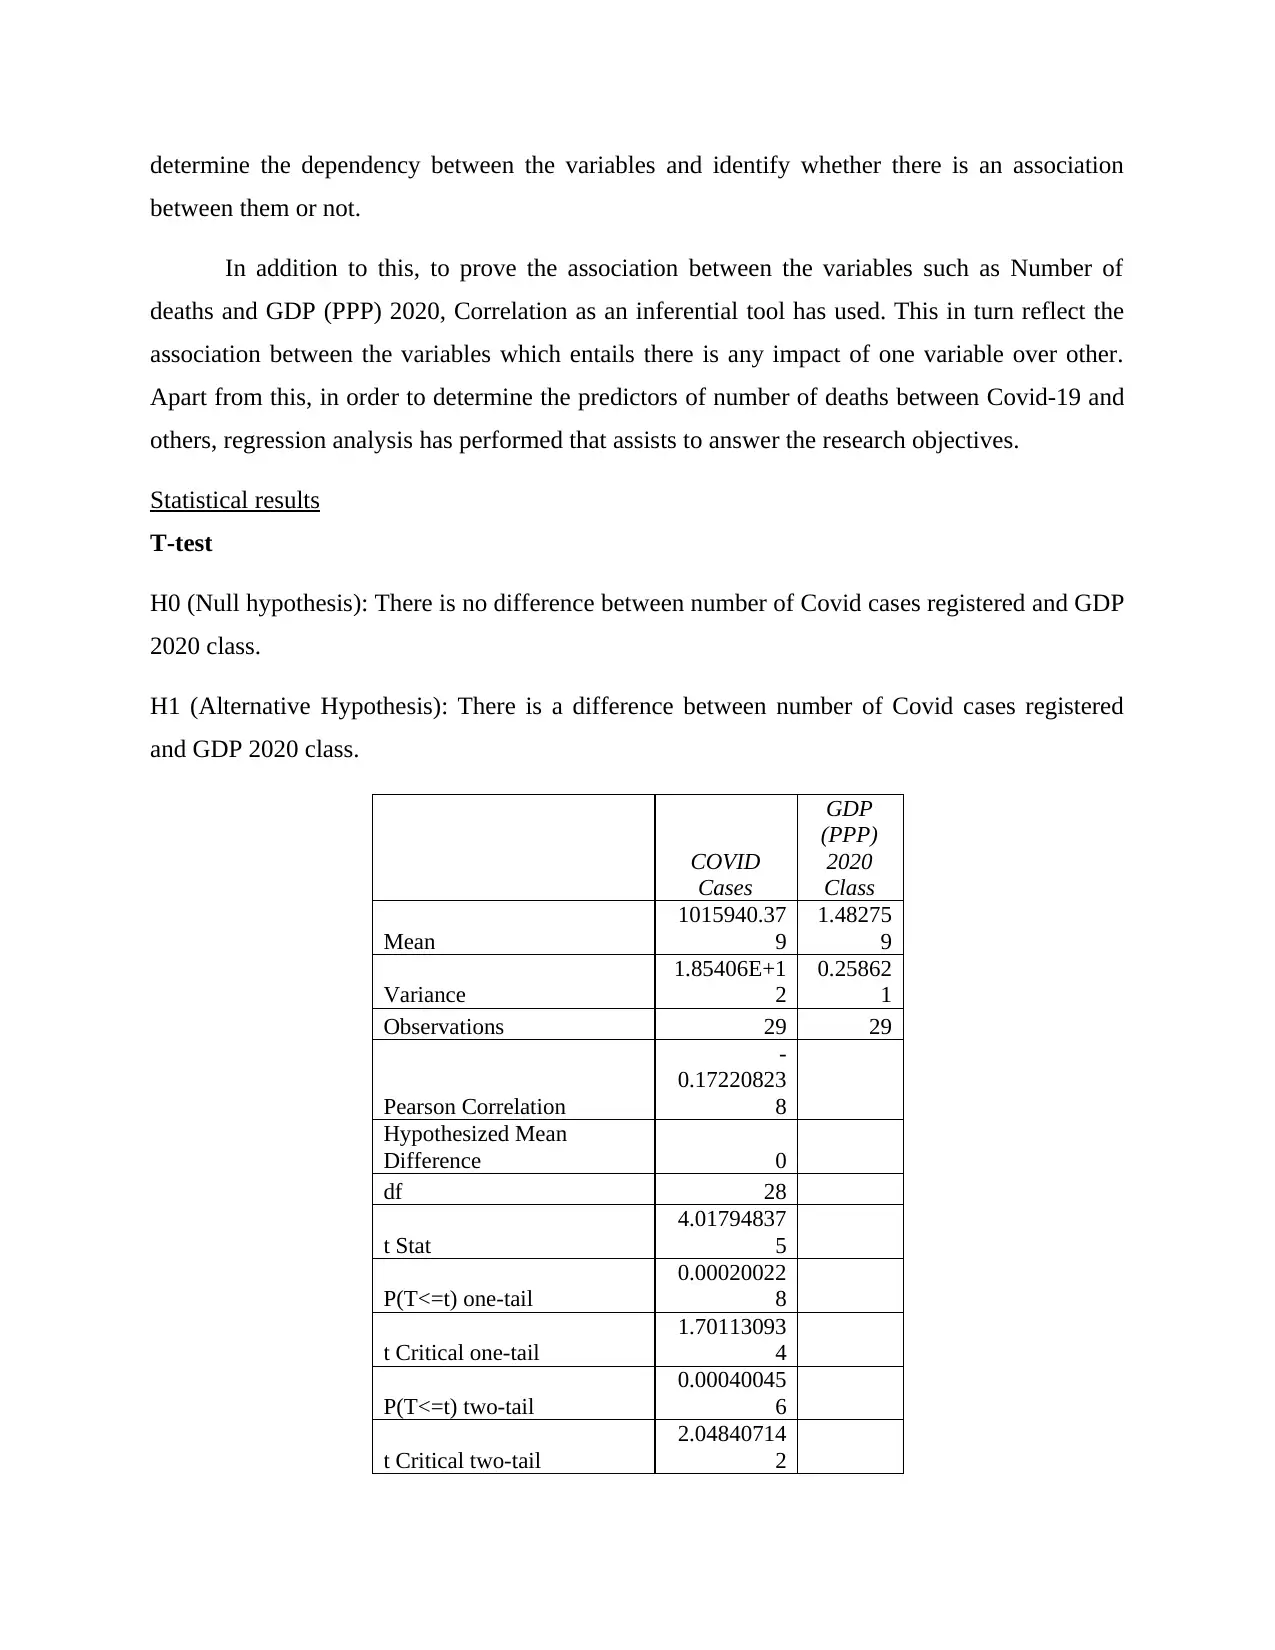
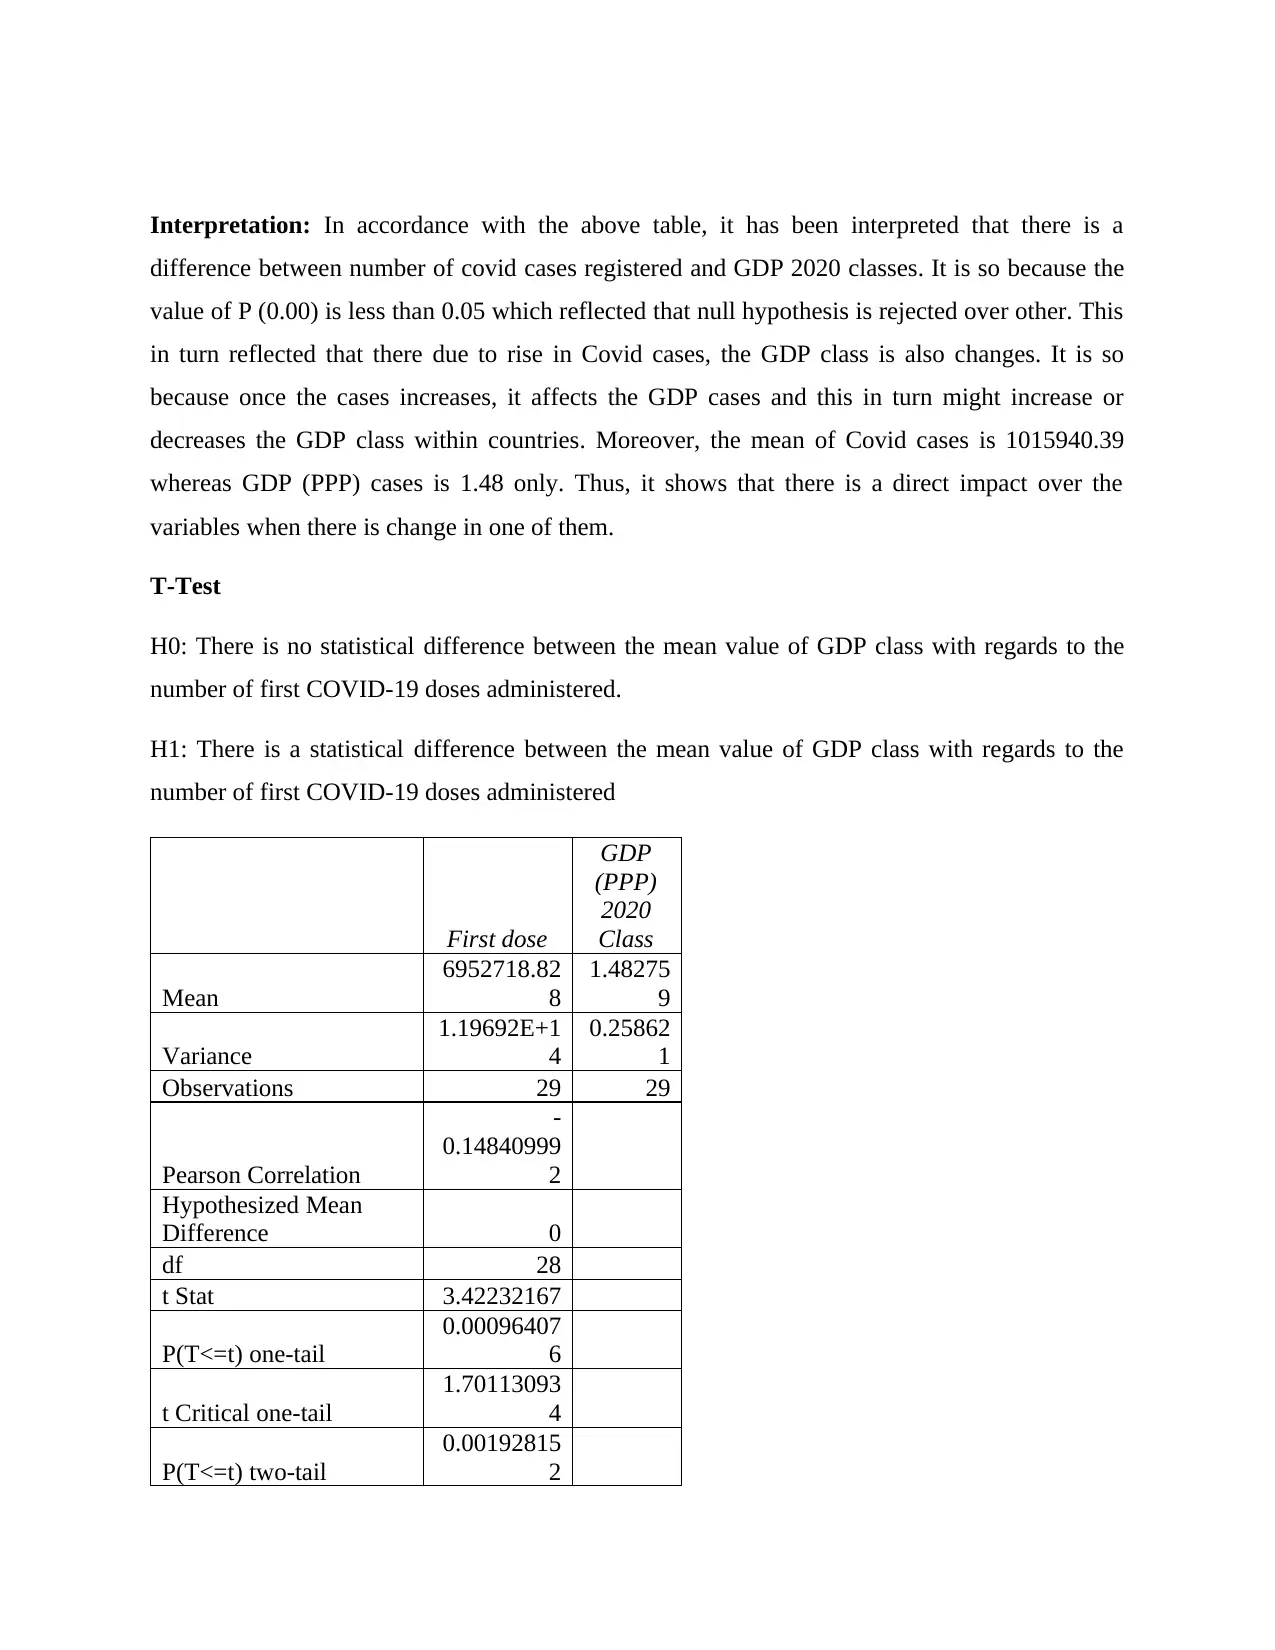
logo

Impact of Covid-19 on Human Lives: Statistical Analysis


Added on  2023-06-18

13 Pages2685 Words98 Views
Analysing the set of given data
Impact of Covid-19 on Human Lives: Statistical Analysis_1
TABLE OF CONTENTS
INTRODUCTION...........................................................................................................................3
Objectives....................................................................................................................................3
Presenting the reason to use inferential statistical technique.......................................................3
Statistical results..........................................................................................................................4
Descriptive statistics....................................................................................................................9
CONCLUSION..............................................................................................................................11
Reflective log.............................................................................................................................11
REFERENCES..............................................................................................................................12
Impact of Covid-19 on Human Lives: Statistical Analysis_2
INTRODUCTION
In recent times, entire world I badly affected with pandemic and this not only affect the
human lives, but decrease the economic rates as well. Along with this, there are many countries
where unemployment rates and political stability affected in negative manner. Similarly, the
present study will help to develop an understanding with regard to the changes and impact of
Covid-19 upon the human lives, with number of doses administrated. The entire study is based
upon European Centre for Disease Prevention and Control (ECDC) where number of doses
administrated, where sample of 29 countries are randomly selected in order to meet the
objectives by using relevant inferential statistics.
Objectives
The objectives of the present study is to determine whether:
1. There is a difference between number of COVID cases registered and GDP 2020 classes
2. There is a difference between GDP class and number of first COVID-19 doses
administered.
3. There is an interrelation between
Covid-19 cases and number of test
Number of deaths and GDP (PPP) 2020
Predictors of number of deaths between Covid cases, GDP, sum of tests done and first
dose administered
Presenting the reason to use inferential statistical technique
In order to answer the research question/ objectives, it is necessary to use inferential
statistics that helps to determine the results. There are range of inferential statistics used by the
scholar, depend upon their requirements. Similarly, in order to determine the answer of objective
1 and 2, T-Test as an inferential statistic uses which helps to determine the mean of two groups
i.e. Covid cases registered and GDP 2020 as well as GDP classes and first doses administered.
Apart from this, in order to determine the interrelationship between the values of Covid-19 cases
and number of test done, regression will be used (Data on the daily number of new reported
COVID-19 cases and deaths by EU/EEA country, 2021). This inferential tool will assist to
Impact of Covid-19 on Human Lives: Statistical Analysis_3
determine the dependency between the variables and identify whether there is an association
between them or not.
In addition to this, to prove the association between the variables such as Number of
deaths and GDP (PPP) 2020, Correlation as an inferential tool has used. This in turn reflect the
association between the variables which entails there is any impact of one variable over other.
Apart from this, in order to determine the predictors of number of deaths between Covid-19 and
others, regression analysis has performed that assists to answer the research objectives.
Statistical results
T-test
H0 (Null hypothesis): There is no difference between number of Covid cases registered and GDP
2020 class.
H1 (Alternative Hypothesis): There is a difference between number of Covid cases registered
and GDP 2020 class.
COVID
Cases
GDP
(PPP)
2020
Class
Mean
1015940.37
9
1.48275
9
Variance
1.85406E+1
2
0.25862
1
Observations 29 29
Pearson Correlation
-
0.17220823
8
Hypothesized Mean
Difference 0
df 28
t Stat
4.01794837
5
P(T<=t) one-tail
0.00020022
8
t Critical one-tail
1.70113093
4
P(T<=t) two-tail
0.00040045
6
t Critical two-tail
2.04840714
2
Impact of Covid-19 on Human Lives: Statistical Analysis_4

End of preview

Want to access all the pages? Upload your documents or become a member.

Related Documents
Factors Affecting Plasma Beta Carotene
|23
|5275
|429

Research Methods in Psychology Statistics
|14
|3492
|353

Critique of a Correlational Study
|5
|997
|384

Critique of Card and Krueger's Minimum Wage Case Study
|6
|974
|180

Graded Homework Maths Problems With Solution 2022
|6
|1185
|13

Data Analysis and Visualisation
|12
|2397
|355