Analysis of Customer Data for Retail Surge: Business Statistics
VerifiedAdded on 2023/06/05
|27
|5018
|427
AI Summary
This report presents an analysis of customer data for Retail Surge, an online company dealing in clothes and shoes for both men and women. The report covers product categories that make the most profit, product categories that cost the most, differences in payment methods, differences in user groups on all customer attitudes, and differences in gender on all customer attitudes.
Contribute Materials
Your contribution can guide someone’s learning journey. Share your
documents today.
Business statistics
Business analytics and statistics
Student name:
Student number:
Tutor name:
Word count:
1 | P a g e
Business analytics and statistics
Student name:
Student number:
Tutor name:
Word count:
1 | P a g e
Secure Best Marks with AI Grader
Need help grading? Try our AI Grader for instant feedback on your assignments.
Business statistics
Table of Contents
1.0 Introduction...........................................................................................................................................3
2.0 Problem definition.................................................................................................................................3
3.0 Analysis and results...............................................................................................................................5
3.1 Which product categories are making the most profit?....................................................................5
3.2 Which product category costs the most (COGS)?..............................................................................6
3.3 Is there a difference in payments methods?.....................................................................................7
3.4 Are there any differences in the user groups on all of the customer attitudes? (6 outcomes)..........7
3.5 Test for the difference in means of user groups between different customer attitudes.................11
3.6 Are there any differences in gender on all of the customer attitudes? (6 outcomes).....................15
4.0 Discussion and recommendation.........................................................................................................20
Reference...................................................................................................................................................21
Appendix...................................................................................................................................................22
2 | P a g e
Business statistics
1.0 Introduction
Technological advancement in the field of business coupled by global inflation has made
business world to be a ground of competition. Many companies in various industries which
have not been able to keep up with the competition in the market have been forced to collapse.
For this reason, majority of businesses have strove to embrace various technological
advancements which have made business operations easier. For example in tours and travel
industry, customers are now able to book their tickets online at the comfort of their couches
instead of appearing physically in the offices. Such kind is what technology can do. It also
enables the company to understand the market better by analysing customer centric data. Retail
Surge, an online company, deals in clothes and shoes for both men and women. It has also
been experiencing a down surge in revenues in due to global dynamics in the market. For this
reason, the business collected customer data to be analysed so as to be able to better understand
the market and their customers.
2.0 Problem definition
The product category is made the most profit
A graph was used to present the products and their profits. This descriptive was employed since
it is visual thus easy to interpret.
Product category that cost the most
A graph was used to present the products at Retail Surge and their costs. This descriptive was
employed since it is visual thus easy to interpret.
3 | P a g e
Business statistics
Is there a difference in payment methods?
Independent sample t-test was used in this test because there were only two independent
variables that were being compared (PayPal and credit card).
Are there any differences in the user groups on all of the customer attitudes? (6
outcomes)
Analysis of variance (ANOVA) was used in this test because there were more than two variables
that were being compared. These were light, medium and heavy users customers at Retail Surge.
Are there any differences in gender on all of the customer attitudes?
Independent sample t-test was used in this test because there were only two independent
variables that were being compared (males and females).
4 | P a g e
Secure Best Marks with AI Grader
Need help grading? Try our AI Grader for instant feedback on your assignments.
Business statistics
3.0 Analysis and results
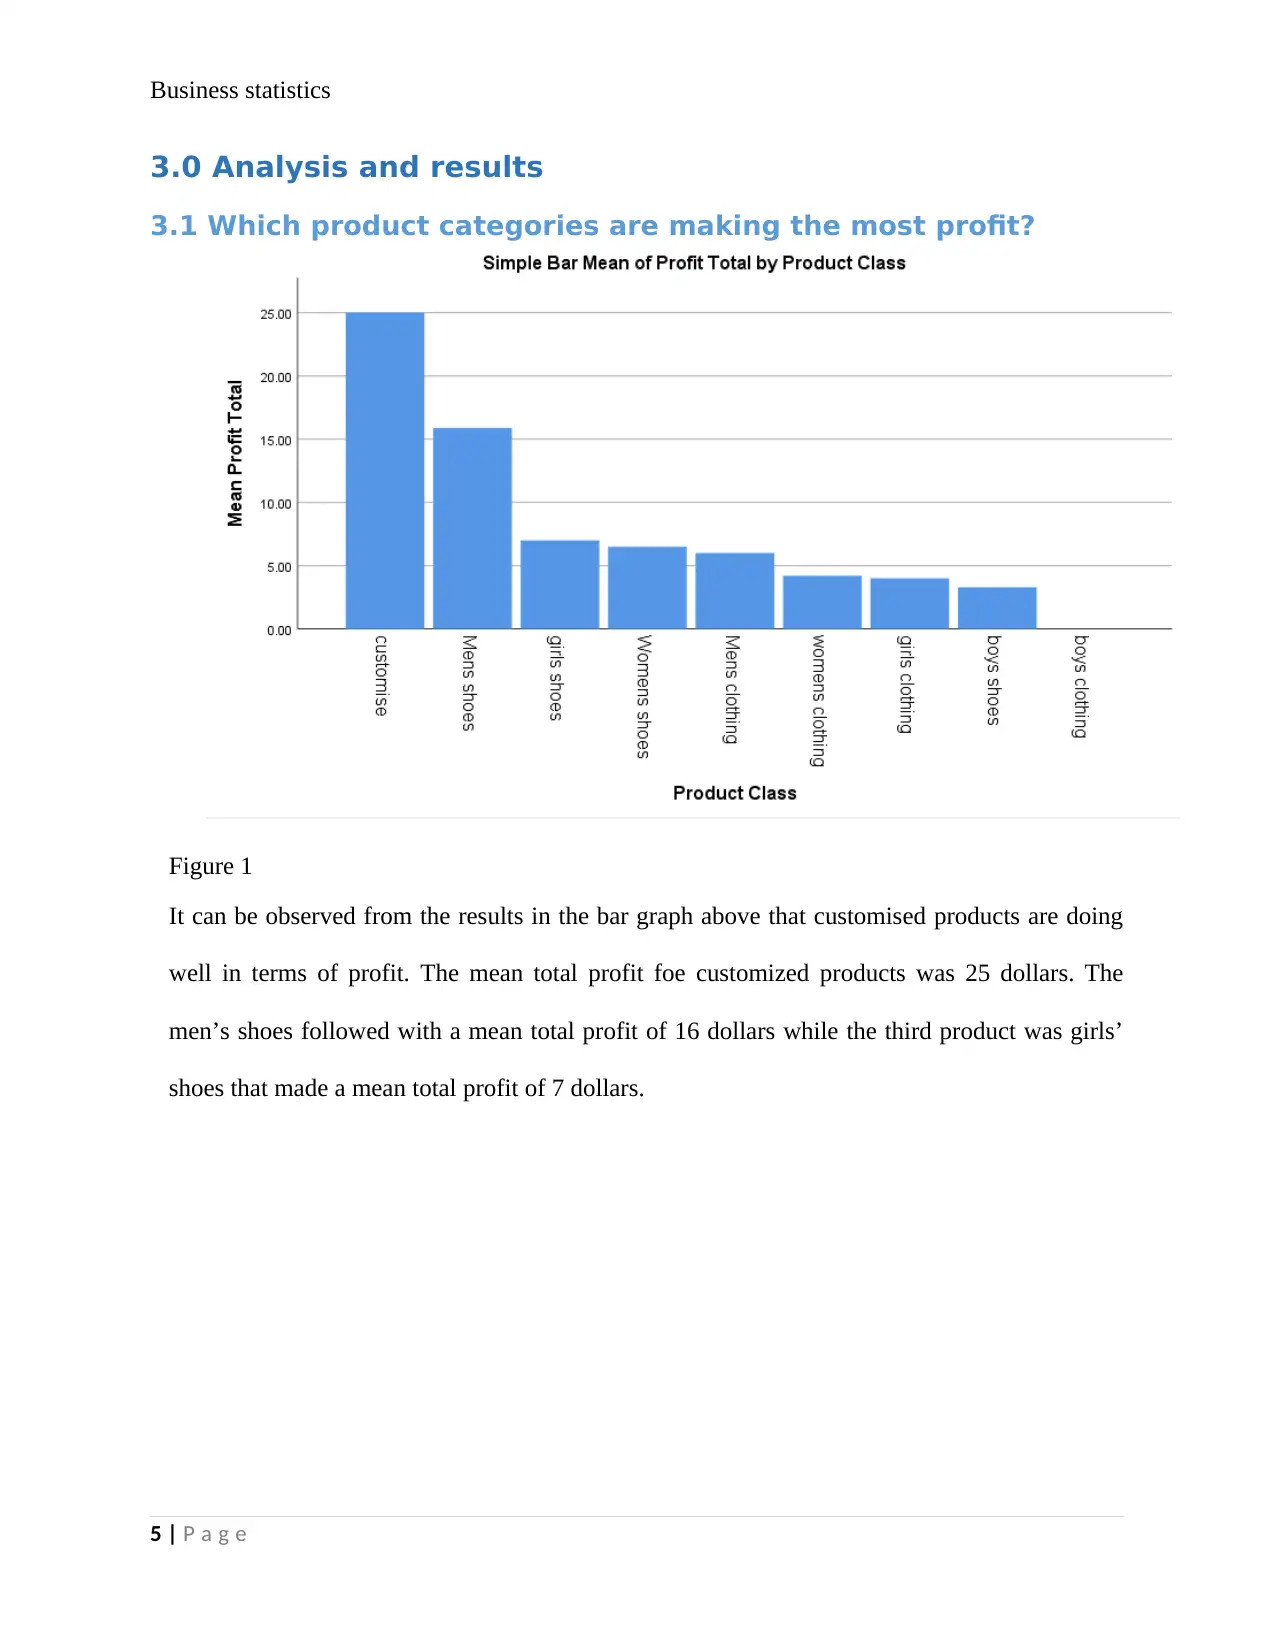
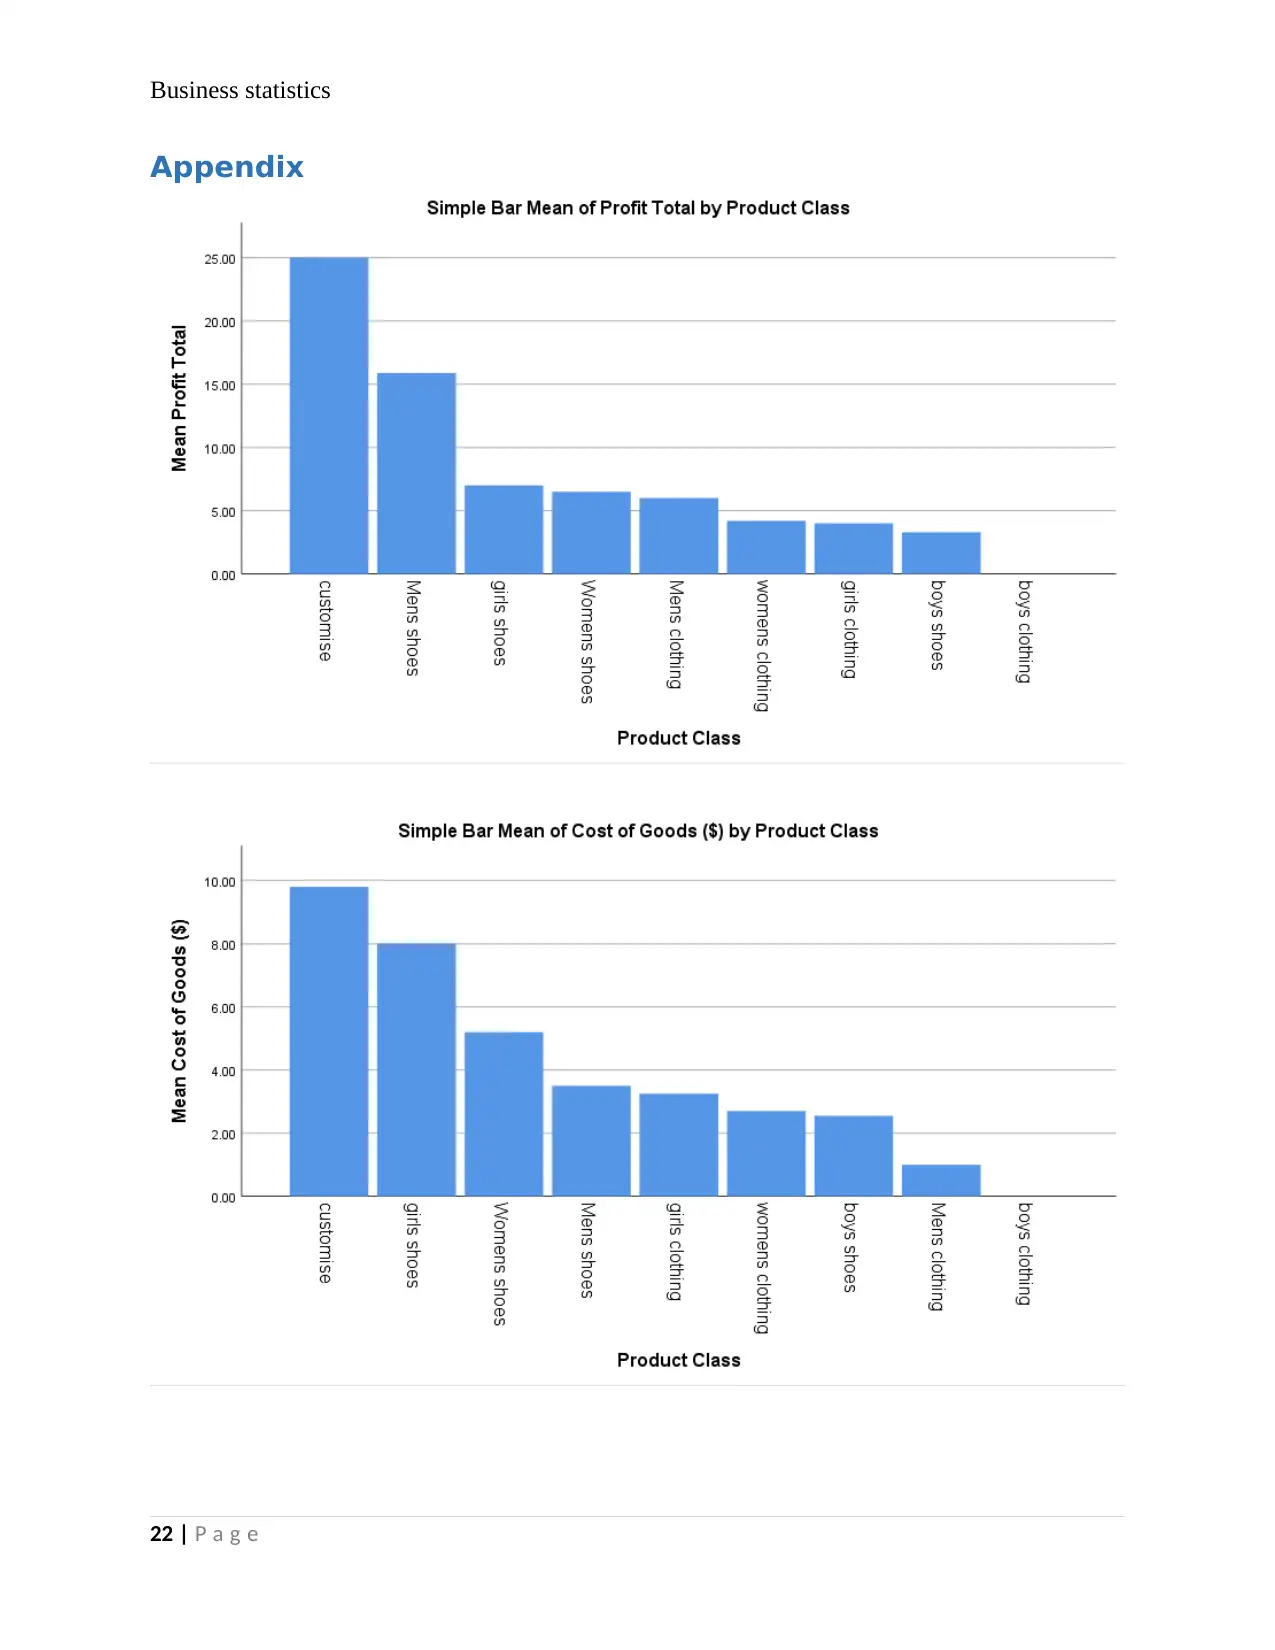
3.1 Which product categories are making the most profit?
Figure 1
It can be observed from the results in the bar graph above that customised products are doing
well in terms of profit. The mean total profit foe customized products was 25 dollars. The
men’s shoes followed with a mean total profit of 16 dollars while the third product was girls’
shoes that made a mean total profit of 7 dollars.
5 | P a g e
3.0 Analysis and results
3.1 Which product categories are making the most profit?
Figure 1
It can be observed from the results in the bar graph above that customised products are doing
well in terms of profit. The mean total profit foe customized products was 25 dollars. The
men’s shoes followed with a mean total profit of 16 dollars while the third product was girls’
shoes that made a mean total profit of 7 dollars.
5 | P a g e
Business statistics
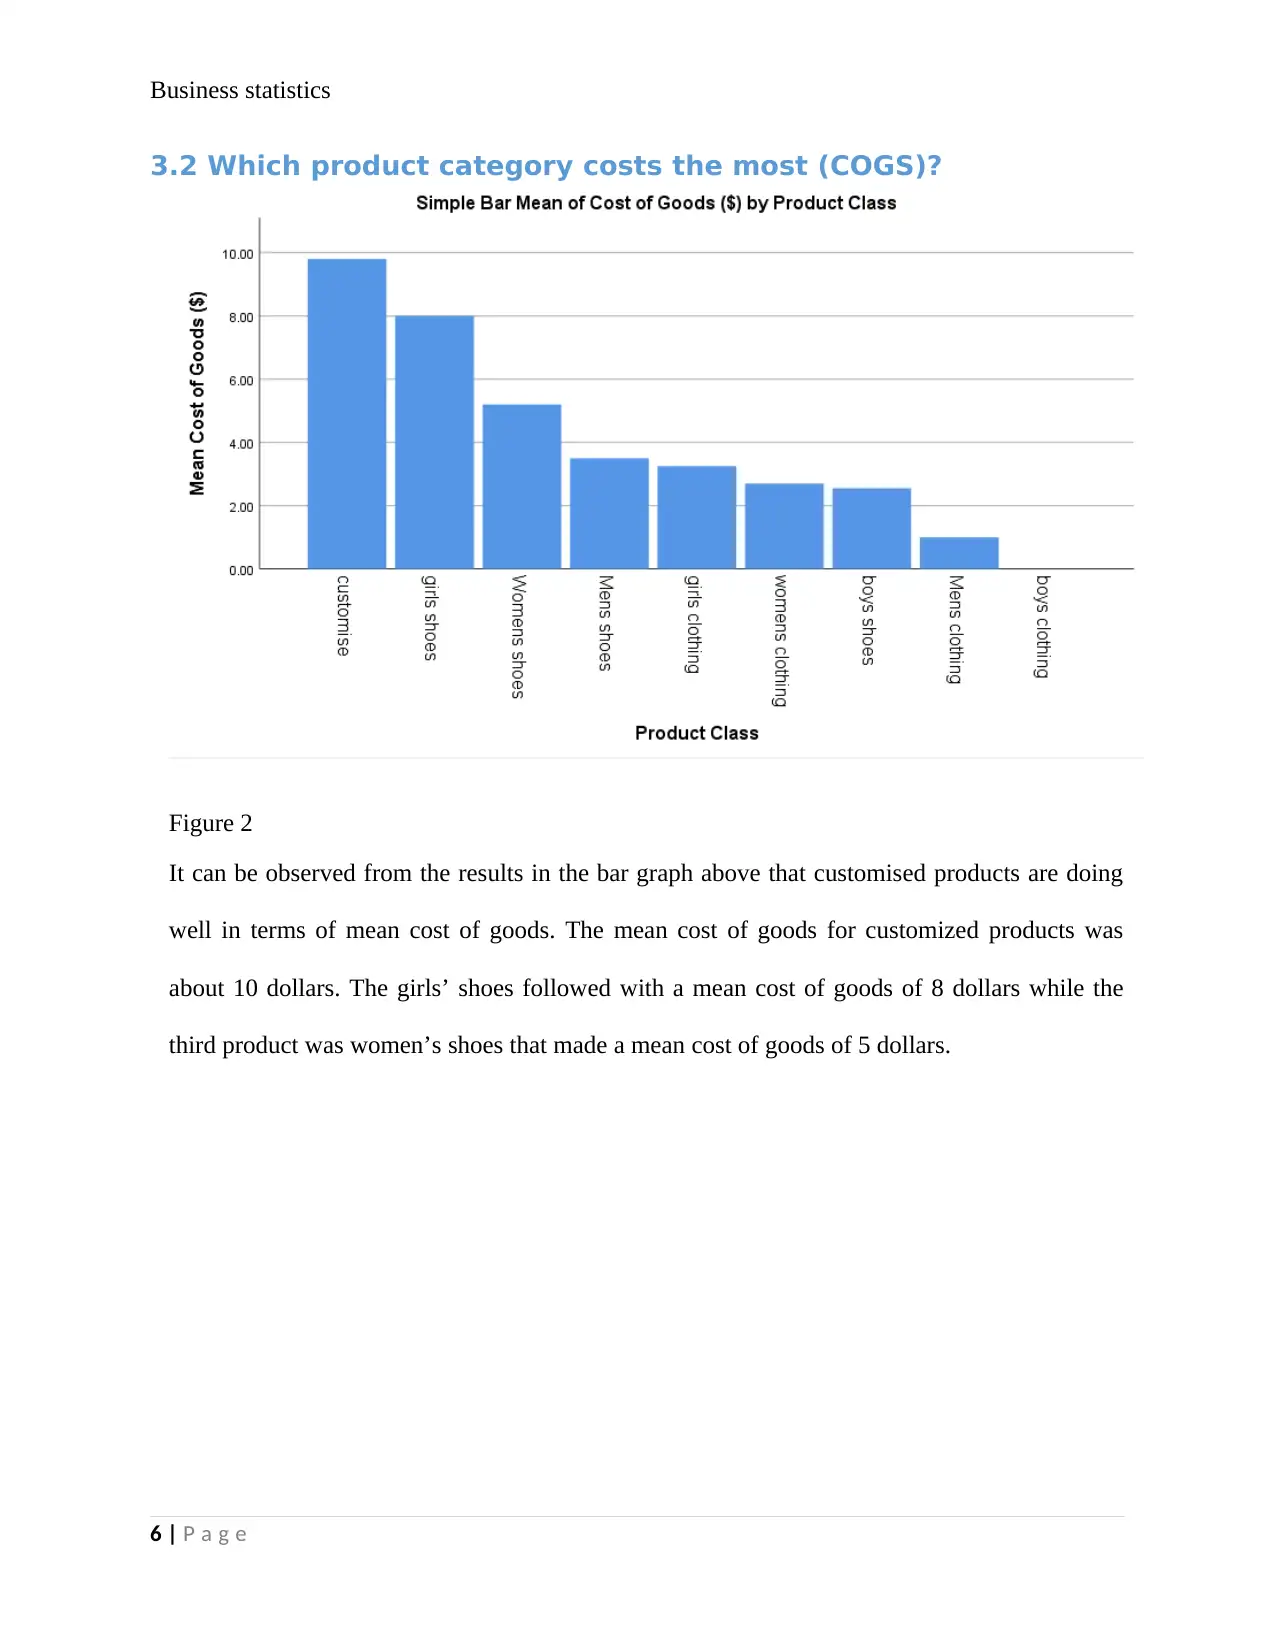
3.2 Which product category costs the most (COGS)?
Figure 2
It can be observed from the results in the bar graph above that customised products are doing
well in terms of mean cost of goods. The mean cost of goods for customized products was
about 10 dollars. The girls’ shoes followed with a mean cost of goods of 8 dollars while the
third product was women’s shoes that made a mean cost of goods of 5 dollars.
6 | P a g e
Business statistics
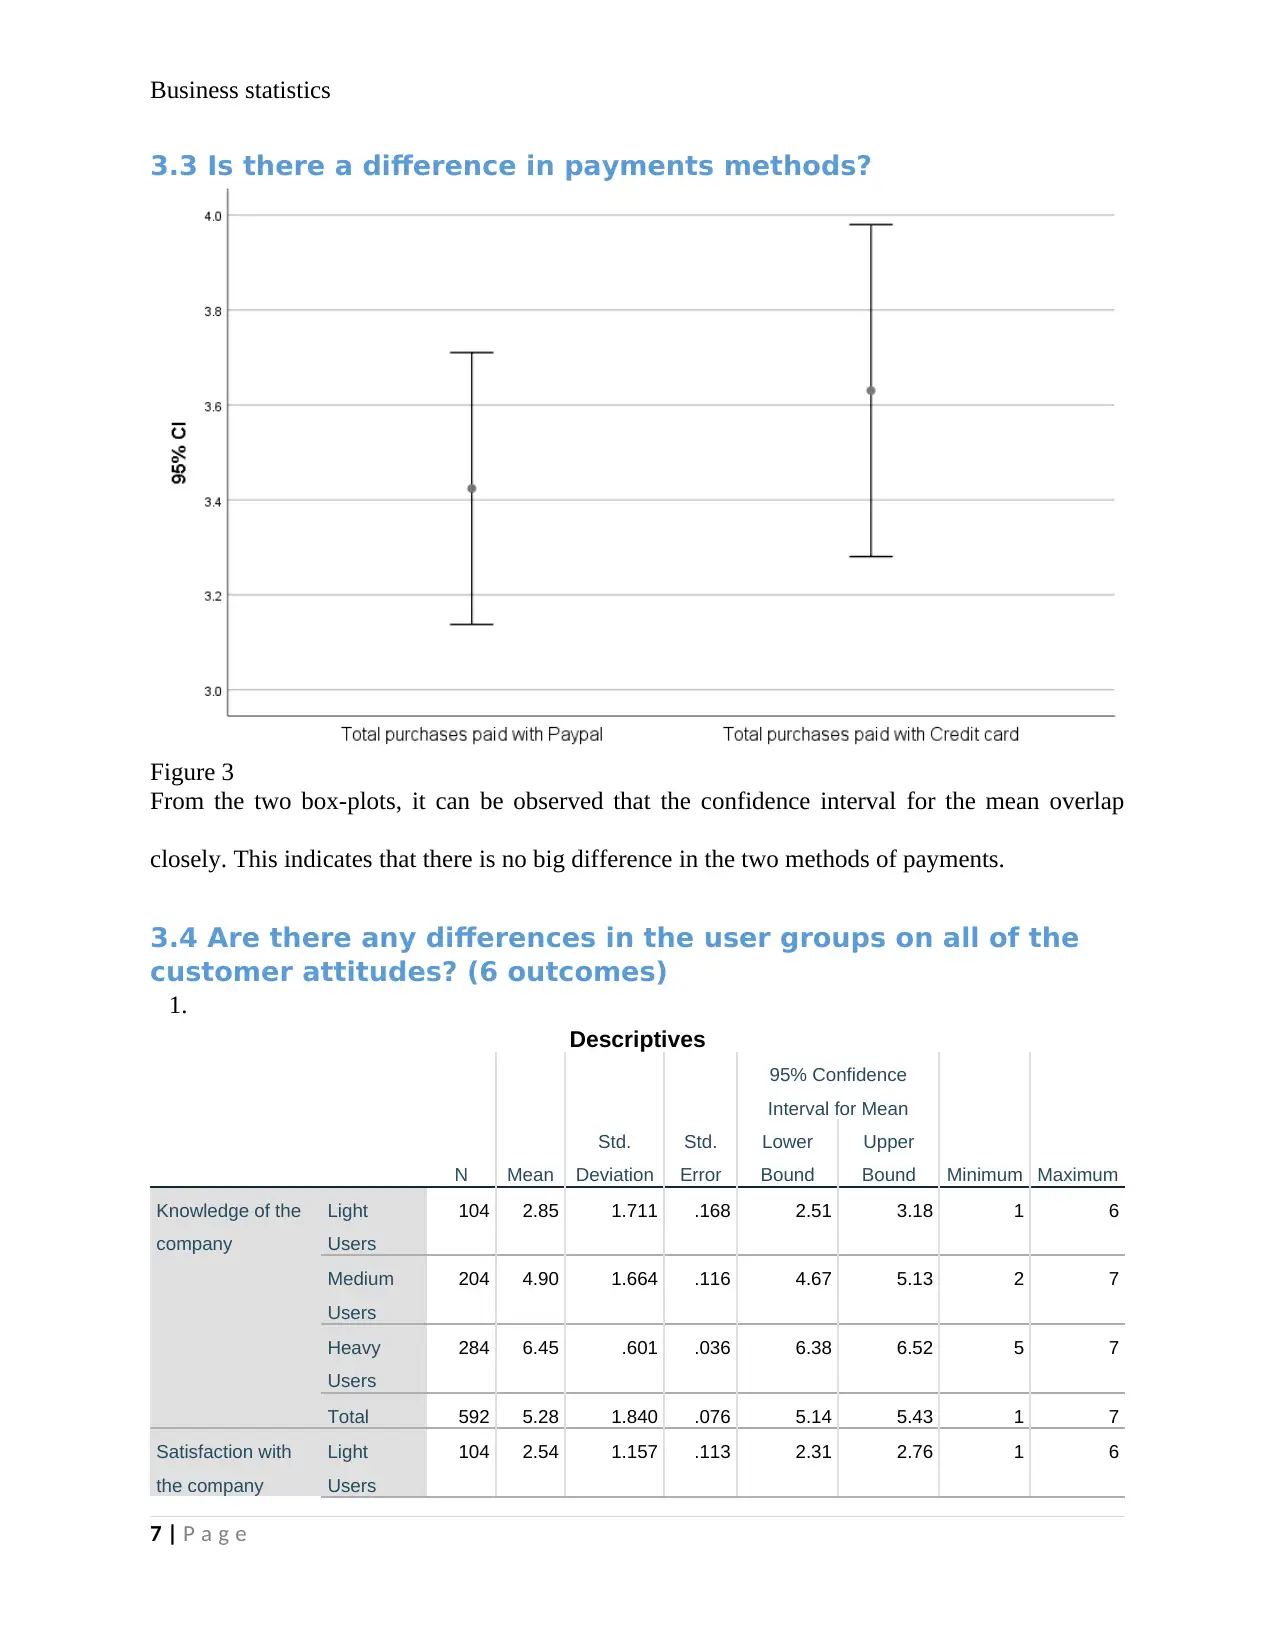
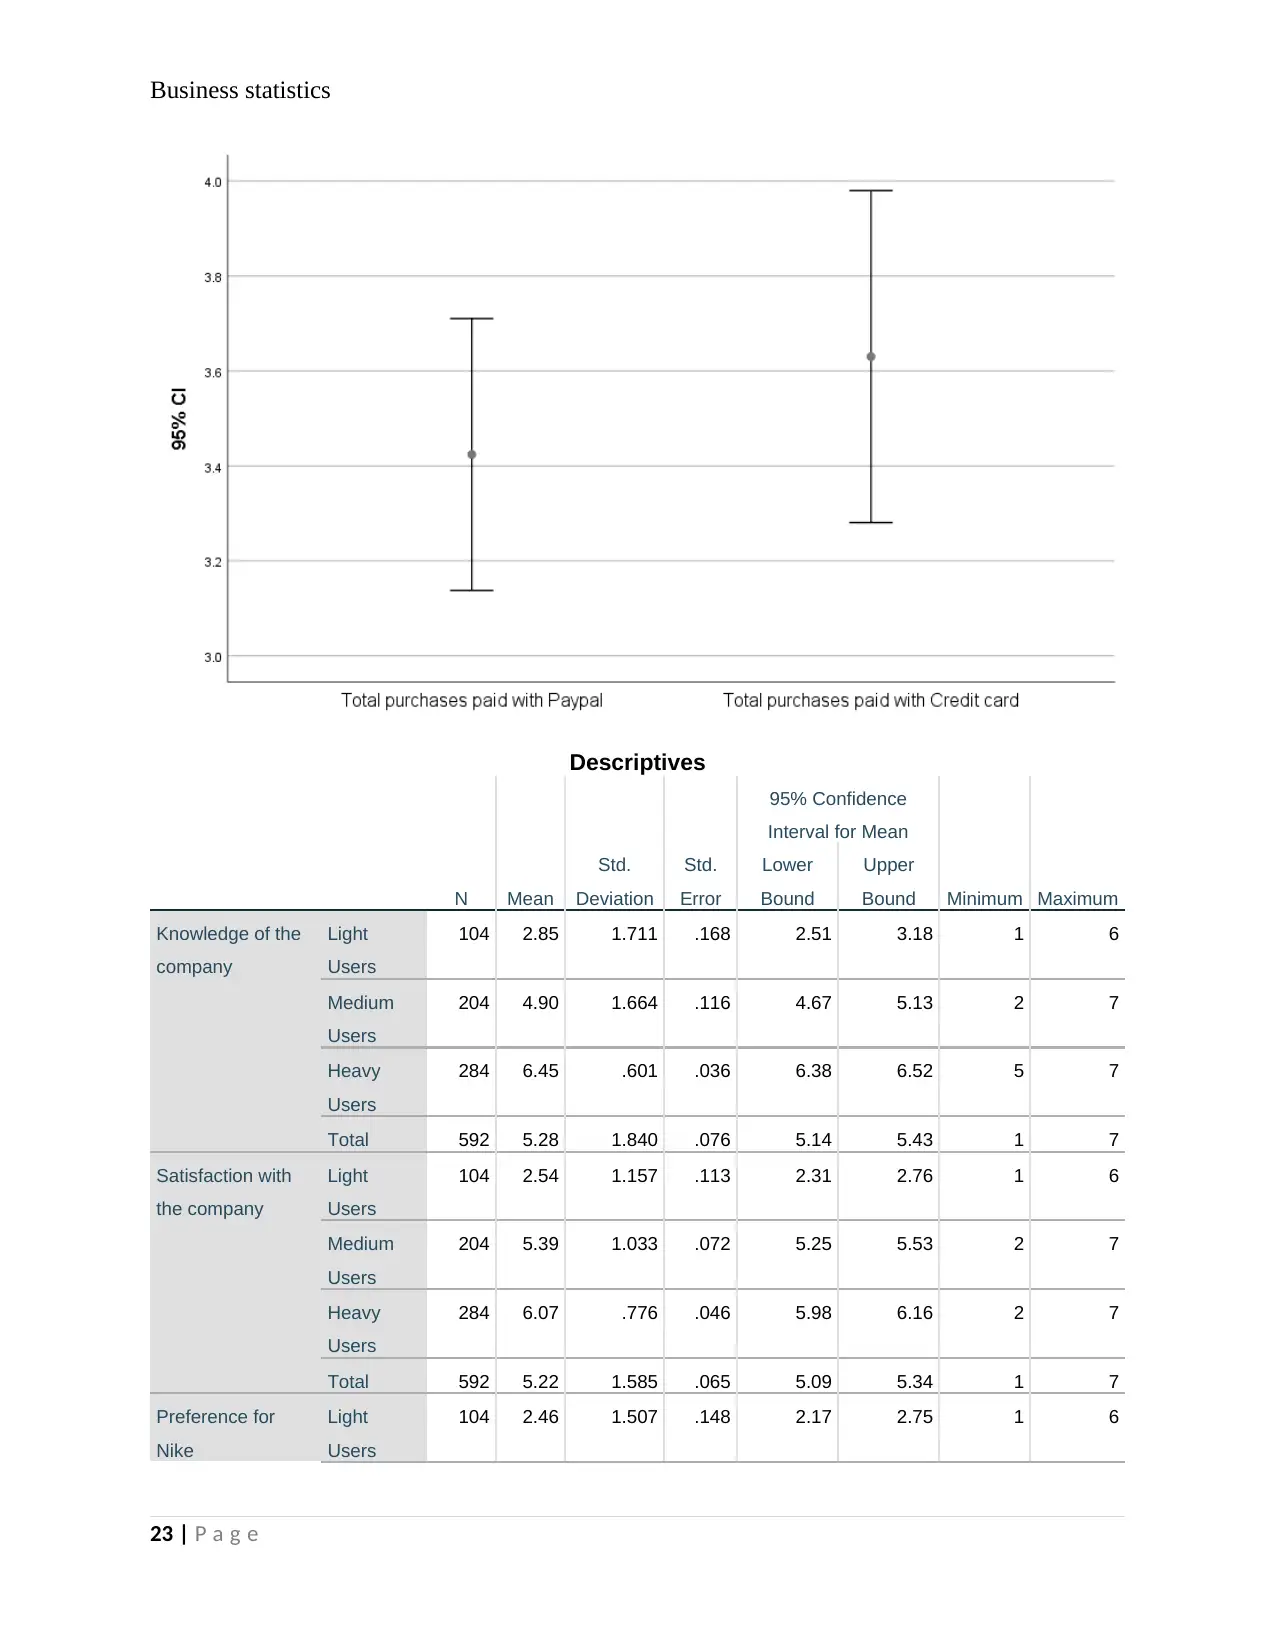
3.3 Is there a difference in payments methods?
Figure 3
From the two box-plots, it can be observed that the confidence interval for the mean overlap
closely. This indicates that there is no big difference in the two methods of payments.
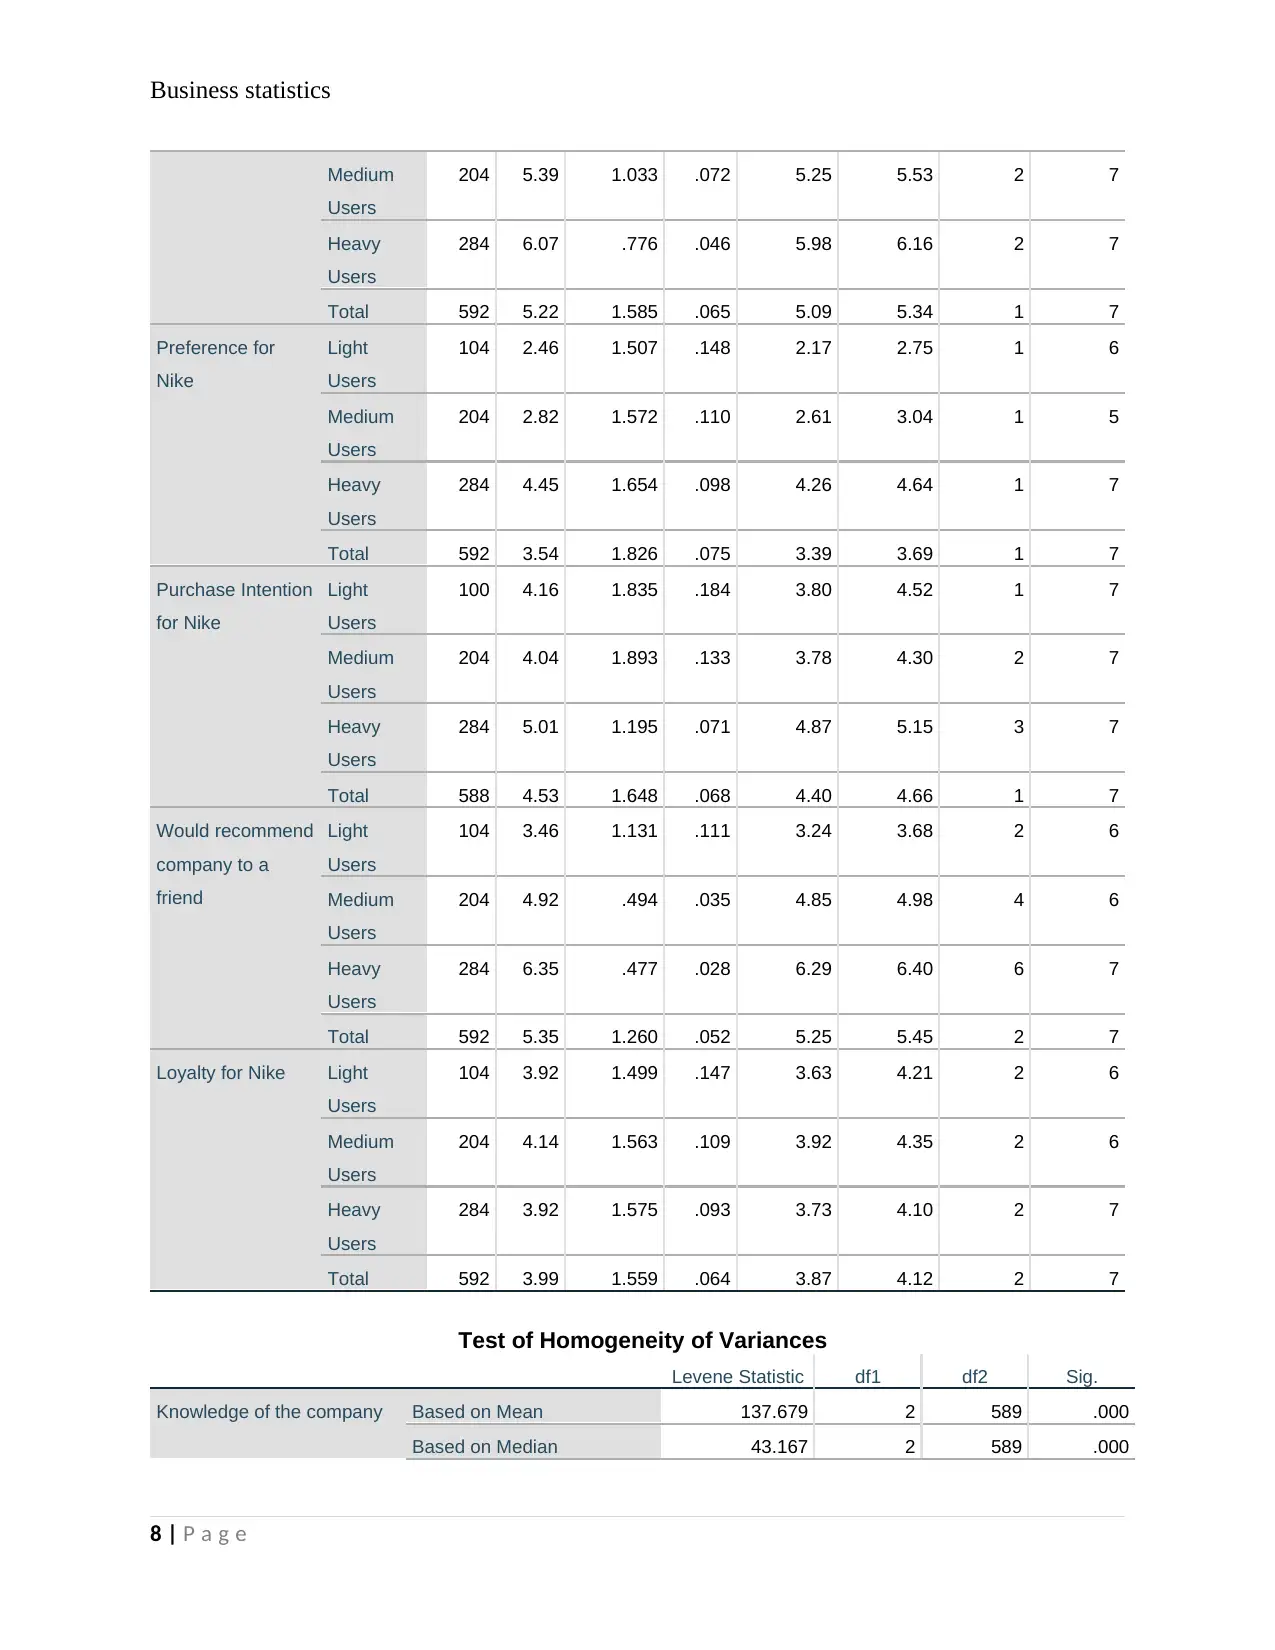
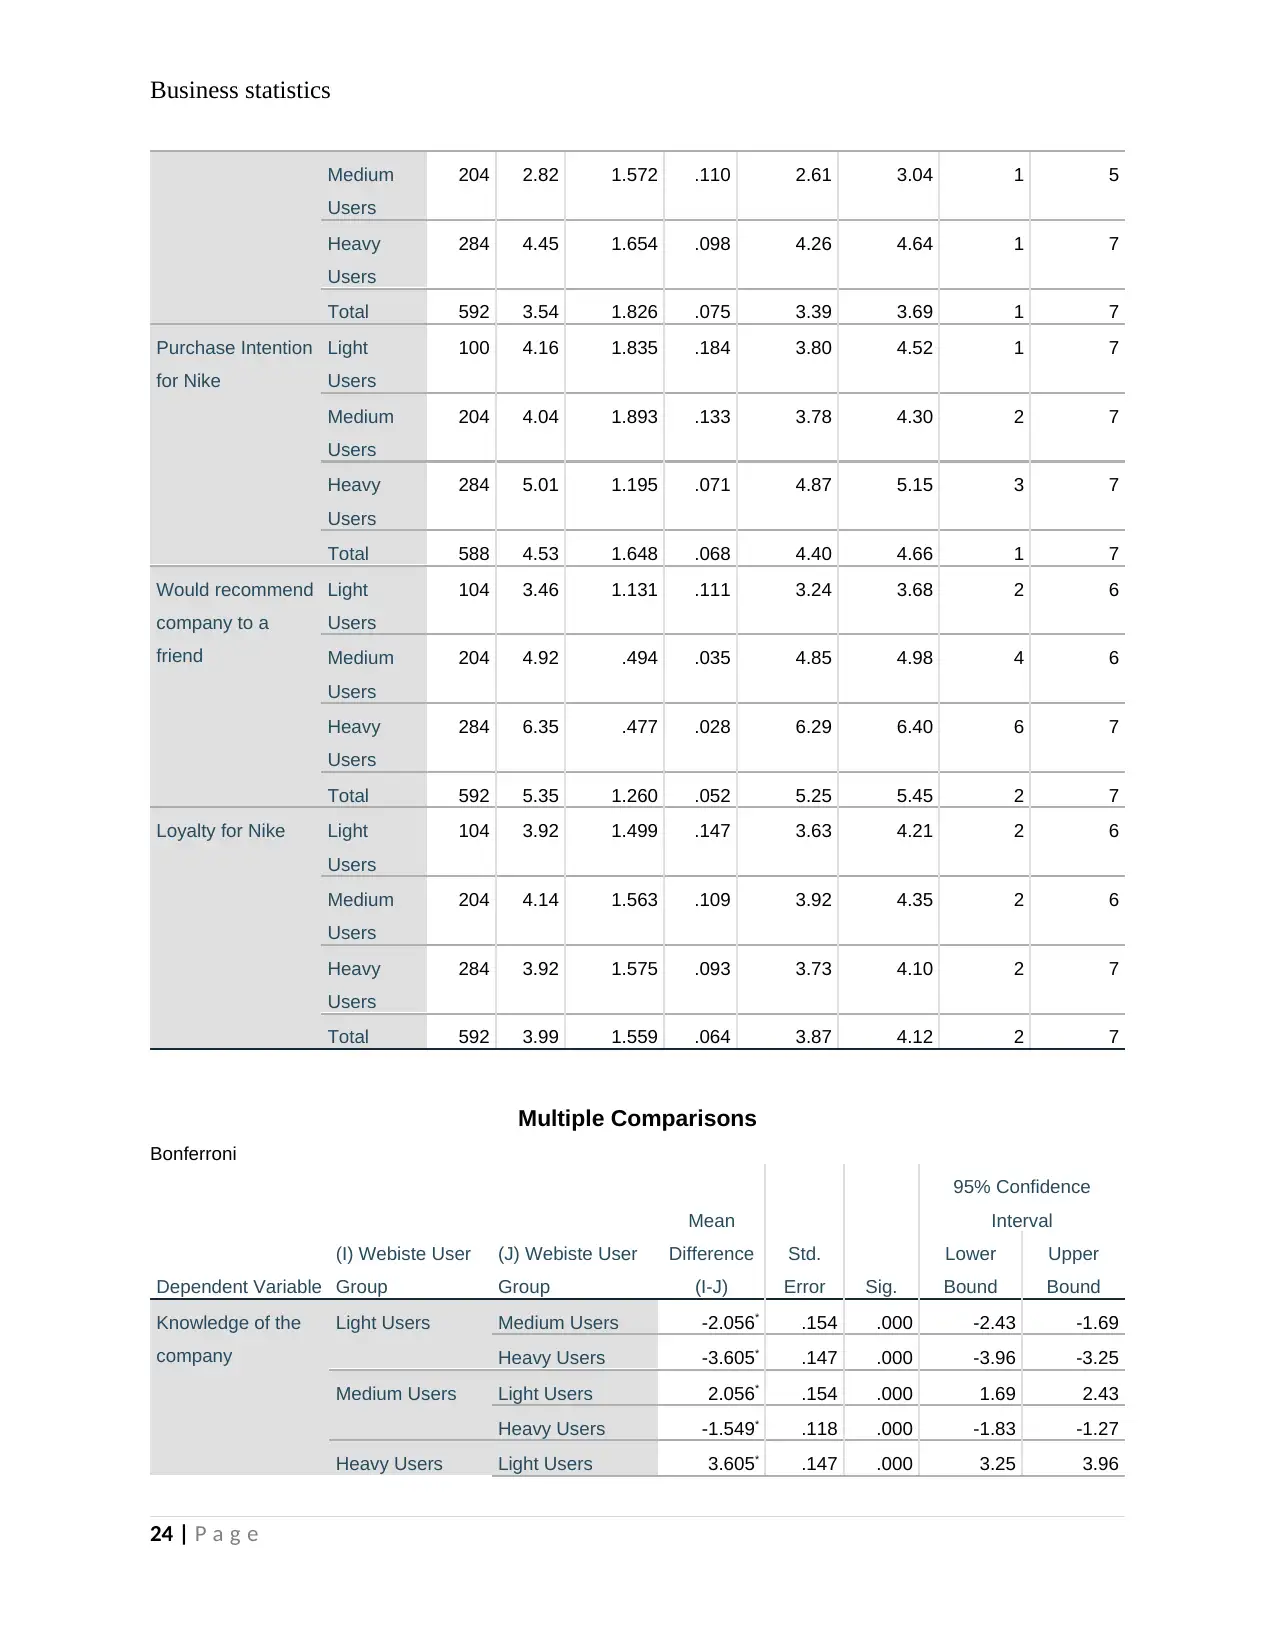
3.4 Are there any differences in the user groups on all of the
customer attitudes? (6 outcomes)
1.
Descriptives
N Mean
Std.
Deviation
Std.
Error
95% Confidence
Interval for Mean
Minimum Maximum
Lower
Bound
Upper
Bound
Knowledge of the
company
Light
Users
104 2.85 1.711 .168 2.51 3.18 1 6
Medium
Users
204 4.90 1.664 .116 4.67 5.13 2 7
Heavy
Users
284 6.45 .601 .036 6.38 6.52 5 7
Total 592 5.28 1.840 .076 5.14 5.43 1 7
Satisfaction with
the company
Light
Users
104 2.54 1.157 .113 2.31 2.76 1 6
7 | P a g e
3.3 Is there a difference in payments methods?
Figure 3
From the two box-plots, it can be observed that the confidence interval for the mean overlap
closely. This indicates that there is no big difference in the two methods of payments.
3.4 Are there any differences in the user groups on all of the
customer attitudes? (6 outcomes)
1.
Descriptives
N Mean
Std.
Deviation
Std.
Error
95% Confidence
Interval for Mean
Minimum Maximum
Lower
Bound
Upper
Bound
Knowledge of the
company
Light
Users
104 2.85 1.711 .168 2.51 3.18 1 6
Medium
Users
204 4.90 1.664 .116 4.67 5.13 2 7
Heavy
Users
284 6.45 .601 .036 6.38 6.52 5 7
Total 592 5.28 1.840 .076 5.14 5.43 1 7
Satisfaction with
the company
Light
Users
104 2.54 1.157 .113 2.31 2.76 1 6
7 | P a g e
Paraphrase This Document
Need a fresh take? Get an instant paraphrase of this document with our AI Paraphraser
Business statistics
Medium
Users
204 5.39 1.033 .072 5.25 5.53 2 7
Heavy
Users
284 6.07 .776 .046 5.98 6.16 2 7
Total 592 5.22 1.585 .065 5.09 5.34 1 7
Preference for
Nike
Light
Users
104 2.46 1.507 .148 2.17 2.75 1 6
Medium
Users
204 2.82 1.572 .110 2.61 3.04 1 5
Heavy
Users
284 4.45 1.654 .098 4.26 4.64 1 7
Total 592 3.54 1.826 .075 3.39 3.69 1 7
Purchase Intention
for Nike
Light
Users
100 4.16 1.835 .184 3.80 4.52 1 7
Medium
Users
204 4.04 1.893 .133 3.78 4.30 2 7
Heavy
Users
284 5.01 1.195 .071 4.87 5.15 3 7
Total 588 4.53 1.648 .068 4.40 4.66 1 7
Would recommend
company to a
friend
Light
Users
104 3.46 1.131 .111 3.24 3.68 2 6
Medium
Users
204 4.92 .494 .035 4.85 4.98 4 6
Heavy
Users
284 6.35 .477 .028 6.29 6.40 6 7
Total 592 5.35 1.260 .052 5.25 5.45 2 7
Loyalty for Nike Light
Users
104 3.92 1.499 .147 3.63 4.21 2 6
Medium
Users
204 4.14 1.563 .109 3.92 4.35 2 6
Heavy
Users
284 3.92 1.575 .093 3.73 4.10 2 7
Total 592 3.99 1.559 .064 3.87 4.12 2 7
Test of Homogeneity of Variances
Levene Statistic df1 df2 Sig.
Knowledge of the company Based on Mean 137.679 2 589 .000
Based on Median 43.167 2 589 .000
8 | P a g e
Medium
Users
204 5.39 1.033 .072 5.25 5.53 2 7
Heavy
Users
284 6.07 .776 .046 5.98 6.16 2 7
Total 592 5.22 1.585 .065 5.09 5.34 1 7
Preference for
Nike
Light
Users
104 2.46 1.507 .148 2.17 2.75 1 6
Medium
Users
204 2.82 1.572 .110 2.61 3.04 1 5
Heavy
Users
284 4.45 1.654 .098 4.26 4.64 1 7
Total 592 3.54 1.826 .075 3.39 3.69 1 7
Purchase Intention
for Nike
Light
Users
100 4.16 1.835 .184 3.80 4.52 1 7
Medium
Users
204 4.04 1.893 .133 3.78 4.30 2 7
Heavy
Users
284 5.01 1.195 .071 4.87 5.15 3 7
Total 588 4.53 1.648 .068 4.40 4.66 1 7
Would recommend
company to a
friend
Light
Users
104 3.46 1.131 .111 3.24 3.68 2 6
Medium
Users
204 4.92 .494 .035 4.85 4.98 4 6
Heavy
Users
284 6.35 .477 .028 6.29 6.40 6 7
Total 592 5.35 1.260 .052 5.25 5.45 2 7
Loyalty for Nike Light
Users
104 3.92 1.499 .147 3.63 4.21 2 6
Medium
Users
204 4.14 1.563 .109 3.92 4.35 2 6
Heavy
Users
284 3.92 1.575 .093 3.73 4.10 2 7
Total 592 3.99 1.559 .064 3.87 4.12 2 7
Test of Homogeneity of Variances
Levene Statistic df1 df2 Sig.
Knowledge of the company Based on Mean 137.679 2 589 .000
Based on Median 43.167 2 589 .000
8 | P a g e
Business statistics
Based on Median and with
adjusted df
43.167 2 366.541 .000
Based on trimmed mean 130.226 2 589 .000
Satisfacition with the
company
Based on Mean 34.012 2 589 .000
Based on Median 19.318 2 589 .000
Based on Median and with
adjusted df
19.318 2 543.743 .000
Based on trimmed mean 28.470 2 589 .000
Preference for Nike Based on Mean 3.007 2 589 .050
Based on Median 2.032 2 589 .132
Based on Median and with
adjusted df
2.032 2 534.316 .132
Based on trimmed mean 3.259 2 589 .039
Purchase Intention for Nike Based on Mean 51.499 2 585 .000
Based on Median 48.655 2 585 .000
Based on Median and with
adjusted df
48.655 2 555.807 .000
Based on trimmed mean 49.574 2 585 .000
Would recommend company
to a friend
Based on Mean 155.697 2 589 .000
Based on Median 75.229 2 589 .000
Based on Median and with
adjusted df
75.229 2 489.408 .000
Based on trimmed mean 152.051 2 589 .000
Loyalty for Nike Based on Mean .438 2 589 .645
Based on Median 1.134 2 589 .322
Based on Median and with
adjusted df
1.134 2 466.890 .323
Based on trimmed mean .333 2 589 .717
Table 1
9 | P a g e
Based on Median and with
adjusted df
43.167 2 366.541 .000
Based on trimmed mean 130.226 2 589 .000
Satisfacition with the
company
Based on Mean 34.012 2 589 .000
Based on Median 19.318 2 589 .000
Based on Median and with
adjusted df
19.318 2 543.743 .000
Based on trimmed mean 28.470 2 589 .000
Preference for Nike Based on Mean 3.007 2 589 .050
Based on Median 2.032 2 589 .132
Based on Median and with
adjusted df
2.032 2 534.316 .132
Based on trimmed mean 3.259 2 589 .039
Purchase Intention for Nike Based on Mean 51.499 2 585 .000
Based on Median 48.655 2 585 .000
Based on Median and with
adjusted df
48.655 2 555.807 .000
Based on trimmed mean 49.574 2 585 .000
Would recommend company
to a friend
Based on Mean 155.697 2 589 .000
Based on Median 75.229 2 589 .000
Based on Median and with
adjusted df
75.229 2 489.408 .000
Based on trimmed mean 152.051 2 589 .000
Loyalty for Nike Based on Mean .438 2 589 .645
Based on Median 1.134 2 589 .322
Based on Median and with
adjusted df
1.134 2 466.890 .323
Based on trimmed mean .333 2 589 .717
Table 1
9 | P a g e
Business statistics
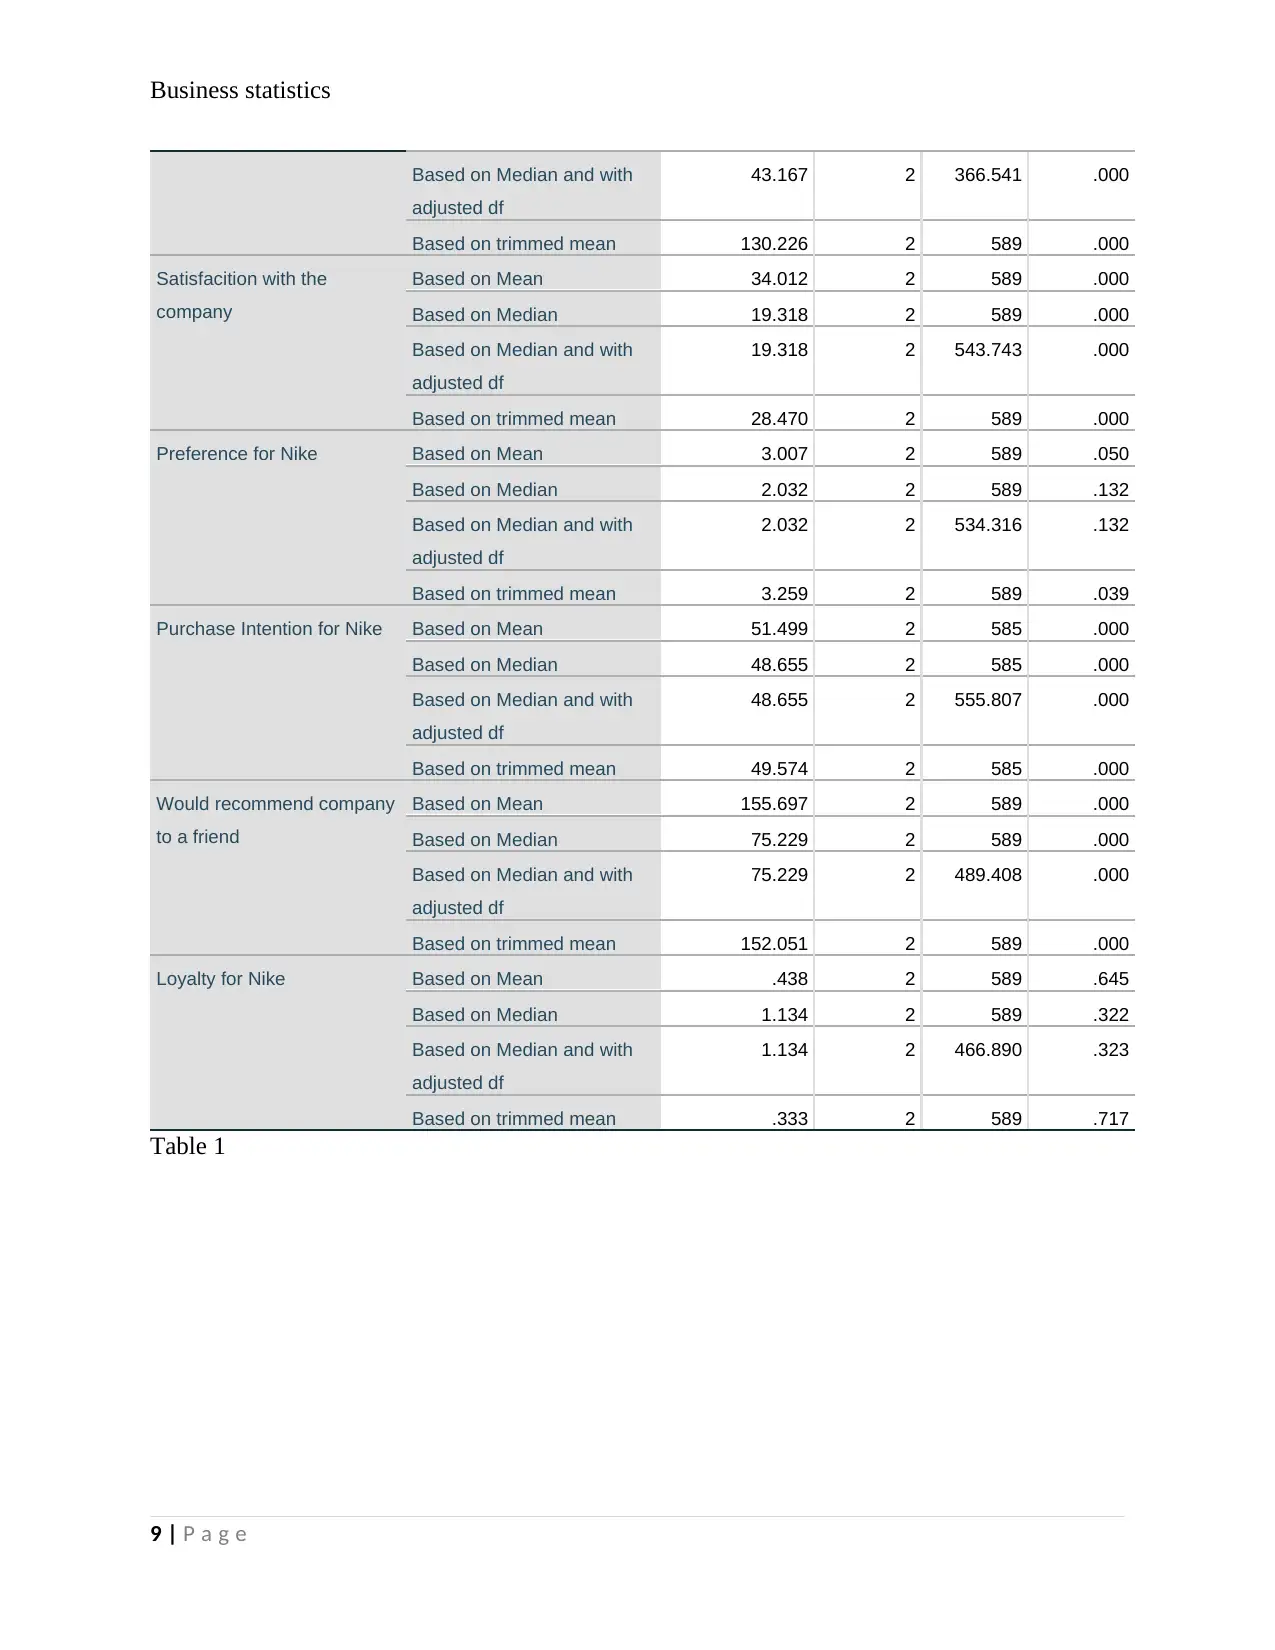
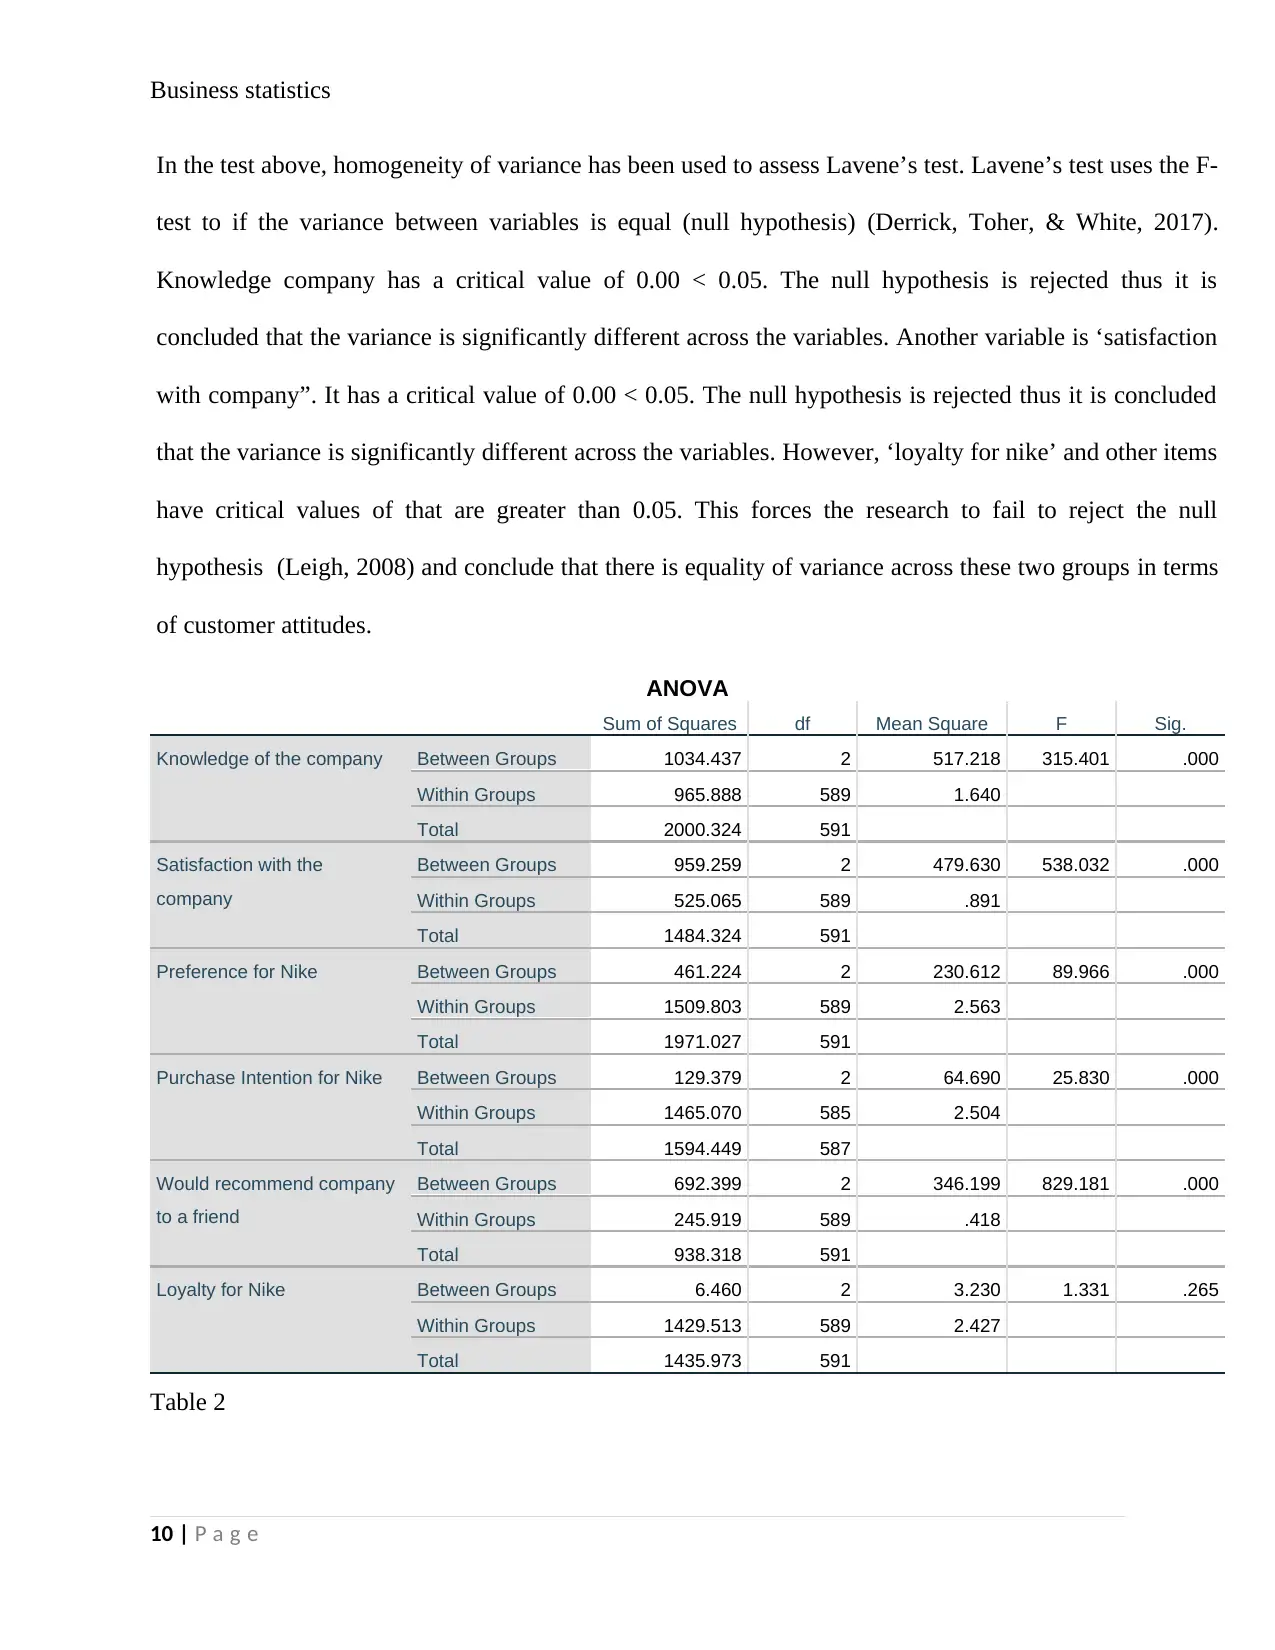
In the test above, homogeneity of variance has been used to assess Lavene’s test. Lavene’s test uses the F-
test to if the variance between variables is equal (null hypothesis) (Derrick, Toher, & White, 2017).
Knowledge company has a critical value of 0.00 < 0.05. The null hypothesis is rejected thus it is
concluded that the variance is significantly different across the variables. Another variable is ‘satisfaction
with company”. It has a critical value of 0.00 < 0.05. The null hypothesis is rejected thus it is concluded
that the variance is significantly different across the variables. However, ‘loyalty for nike’ and other items
have critical values of that are greater than 0.05. This forces the research to fail to reject the null
hypothesis (Leigh, 2008) and conclude that there is equality of variance across these two groups in terms
of customer attitudes.
ANOVA
Sum of Squares df Mean Square F Sig.
Knowledge of the company Between Groups 1034.437 2 517.218 315.401 .000
Within Groups 965.888 589 1.640
Total 2000.324 591
Satisfaction with the
company
Between Groups 959.259 2 479.630 538.032 .000
Within Groups 525.065 589 .891
Total 1484.324 591
Preference for Nike Between Groups 461.224 2 230.612 89.966 .000
Within Groups 1509.803 589 2.563
Total 1971.027 591
Purchase Intention for Nike Between Groups 129.379 2 64.690 25.830 .000
Within Groups 1465.070 585 2.504
Total 1594.449 587
Would recommend company
to a friend
Between Groups 692.399 2 346.199 829.181 .000
Within Groups 245.919 589 .418
Total 938.318 591
Loyalty for Nike Between Groups 6.460 2 3.230 1.331 .265
Within Groups 1429.513 589 2.427
Total 1435.973 591
Table 2
10 | P a g e
Secure Best Marks with AI Grader
Need help grading? Try our AI Grader for instant feedback on your assignments.
Business statistics
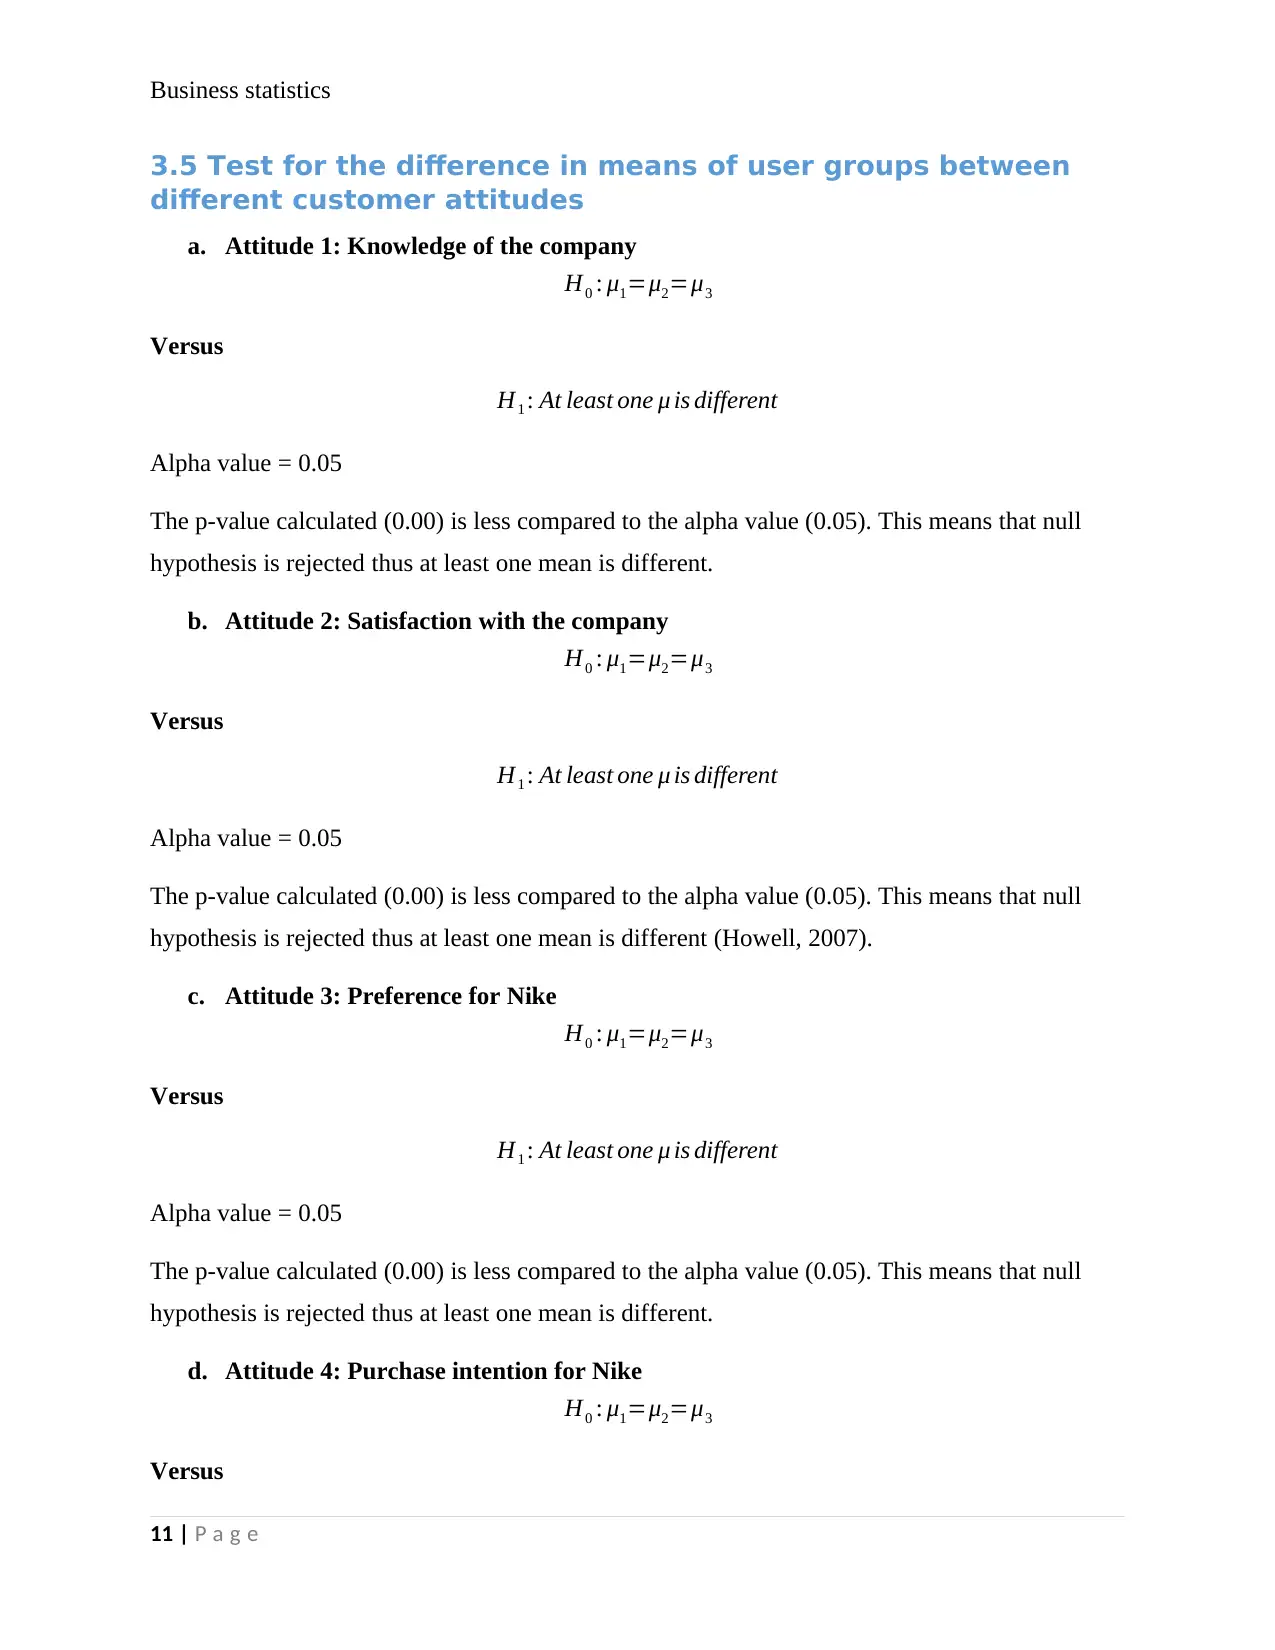
3.5 Test for the difference in means of user groups between
different customer attitudes
a. Attitude 1: Knowledge of the company
H0 : μ1=μ2=μ3
Versus
H1 : At least one μ is different
Alpha value = 0.05
The p-value calculated (0.00) is less compared to the alpha value (0.05). This means that null
hypothesis is rejected thus at least one mean is different.
b. Attitude 2: Satisfaction with the company
H0 : μ1=μ2=μ3
Versus
H1 : At least one μ is different
Alpha value = 0.05
The p-value calculated (0.00) is less compared to the alpha value (0.05). This means that null
hypothesis is rejected thus at least one mean is different (Howell, 2007).
c. Attitude 3: Preference for Nike
H0 : μ1=μ2=μ3
Versus
H1 : At least one μ is different
Alpha value = 0.05
The p-value calculated (0.00) is less compared to the alpha value (0.05). This means that null
hypothesis is rejected thus at least one mean is different.
d. Attitude 4: Purchase intention for Nike
H0 : μ1=μ2=μ3
Versus
11 | P a g e
Business statistics
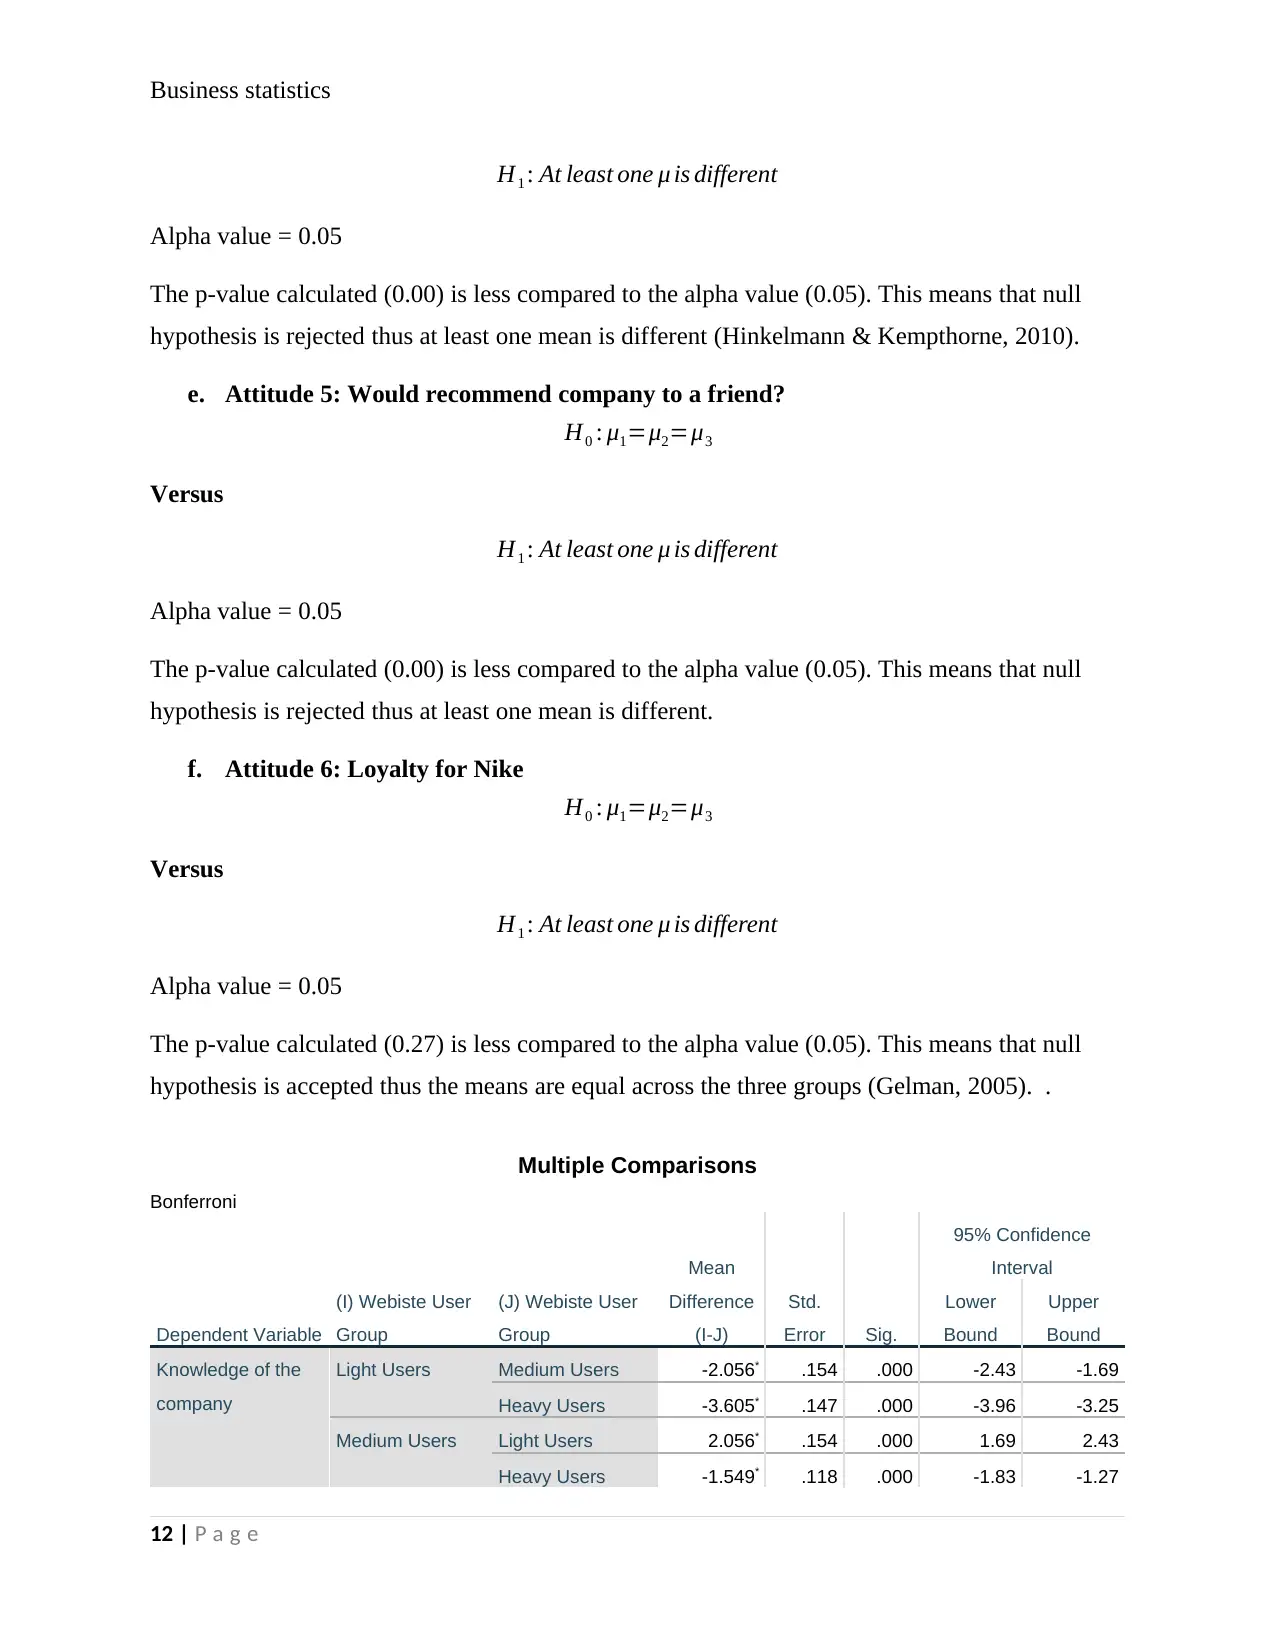
H1 : At least one μ is different
Alpha value = 0.05
The p-value calculated (0.00) is less compared to the alpha value (0.05). This means that null
hypothesis is rejected thus at least one mean is different (Hinkelmann & Kempthorne, 2010).
e. Attitude 5: Would recommend company to a friend?
H0 : μ1=μ2=μ3
Versus
H1 : At least one μ is different
Alpha value = 0.05
The p-value calculated (0.00) is less compared to the alpha value (0.05). This means that null
hypothesis is rejected thus at least one mean is different.
f. Attitude 6: Loyalty for Nike
H0 : μ1=μ2=μ3
Versus
H1 : At least one μ is different
Alpha value = 0.05
The p-value calculated (0.27) is less compared to the alpha value (0.05). This means that null
hypothesis is accepted thus the means are equal across the three groups (Gelman, 2005). .
Multiple Comparisons
Bonferroni
Dependent Variable
(I) Webiste User
Group
(J) Webiste User
Group
Mean
Difference
(I-J)
Std.
Error Sig.
95% Confidence
Interval
Lower
Bound
Upper
Bound
Knowledge of the
company
Light Users Medium Users -2.056* .154 .000 -2.43 -1.69
Heavy Users -3.605* .147 .000 -3.96 -3.25
Medium Users Light Users 2.056* .154 .000 1.69 2.43
Heavy Users -1.549* .118 .000 -1.83 -1.27
12 | P a g e
H1 : At least one μ is different
Alpha value = 0.05
The p-value calculated (0.00) is less compared to the alpha value (0.05). This means that null
hypothesis is rejected thus at least one mean is different (Hinkelmann & Kempthorne, 2010).
e. Attitude 5: Would recommend company to a friend?
H0 : μ1=μ2=μ3
Versus
H1 : At least one μ is different
Alpha value = 0.05
The p-value calculated (0.00) is less compared to the alpha value (0.05). This means that null
hypothesis is rejected thus at least one mean is different.
f. Attitude 6: Loyalty for Nike
H0 : μ1=μ2=μ3
Versus
H1 : At least one μ is different
Alpha value = 0.05
The p-value calculated (0.27) is less compared to the alpha value (0.05). This means that null
hypothesis is accepted thus the means are equal across the three groups (Gelman, 2005). .
Multiple Comparisons
Bonferroni
Dependent Variable
(I) Webiste User
Group
(J) Webiste User
Group
Mean
Difference
(I-J)
Std.
Error Sig.
95% Confidence
Interval
Lower
Bound
Upper
Bound
Knowledge of the
company
Light Users Medium Users -2.056* .154 .000 -2.43 -1.69
Heavy Users -3.605* .147 .000 -3.96 -3.25
Medium Users Light Users 2.056* .154 .000 1.69 2.43
Heavy Users -1.549* .118 .000 -1.83 -1.27
12 | P a g e
Business statistics
Heavy Users Light Users 3.605* .147 .000 3.25 3.96
Medium Users 1.549* .118 .000 1.27 1.83
Satisfaction with the
company
Light Users Medium Users -2.854* .114 .000 -3.13 -2.58
Heavy Users -3.532* .108 .000 -3.79 -3.27
Medium Users Light Users 2.854* .114 .000 2.58 3.13
Heavy Users -.678* .087 .000 -.89 -.47
Heavy Users Light Users 3.532* .108 .000 3.27 3.79
Medium Users .678* .087 .000 .47 .89
Preference for Nike Light Users Medium Users -.362 .193 .183 -.83 .10
Heavy Users -1.989* .184 .000 -2.43 -1.55
Medium Users Light Users .362 .193 .183 -.10 .83
Heavy Users -1.627* .147 .000 -1.98 -1.27
Heavy Users Light Users 1.989* .184 .000 1.55 2.43
Medium Users 1.627* .147 .000 1.27 1.98
Purchase Intention
for Nike
Light Users Medium Users .121 .193 1.000 -.34 .58
Heavy Users -.854* .184 .000 -1.30 -.41
Medium Users Light Users -.121 .193 1.000 -.58 .34
Heavy Users -.975* .145 .000 -1.32 -.63
Heavy Users Light Users .854* .184 .000 .41 1.30
Medium Users .975* .145 .000 .63 1.32
Would recommend
company to a friend
Light Users Medium Users -1.455* .078 .000 -1.64 -1.27
Heavy Users -2.887* .074 .000 -3.06 -2.71
Medium Users Light Users 1.455* .078 .000 1.27 1.64
Heavy Users -1.432* .059 .000 -1.57 -1.29
Heavy Users Light Users 2.887* .074 .000 2.71 3.06
Medium Users 1.432* .059 .000 1.29 1.57
Loyalty for Nike Light Users Medium Users -.214 .188 .763 -.66 .24
Heavy Users .008 .179 1.000 -.42 .44
Medium Users Light Users .214 .188 .763 -.24 .66
Heavy Users .222 .143 .364 -.12 .57
Heavy Users Light Users -.008 .179 1.000 -.44 .42
Medium Users -.222 .143 .364 -.57 .12
*. The mean difference is significant at the 0.05 level.
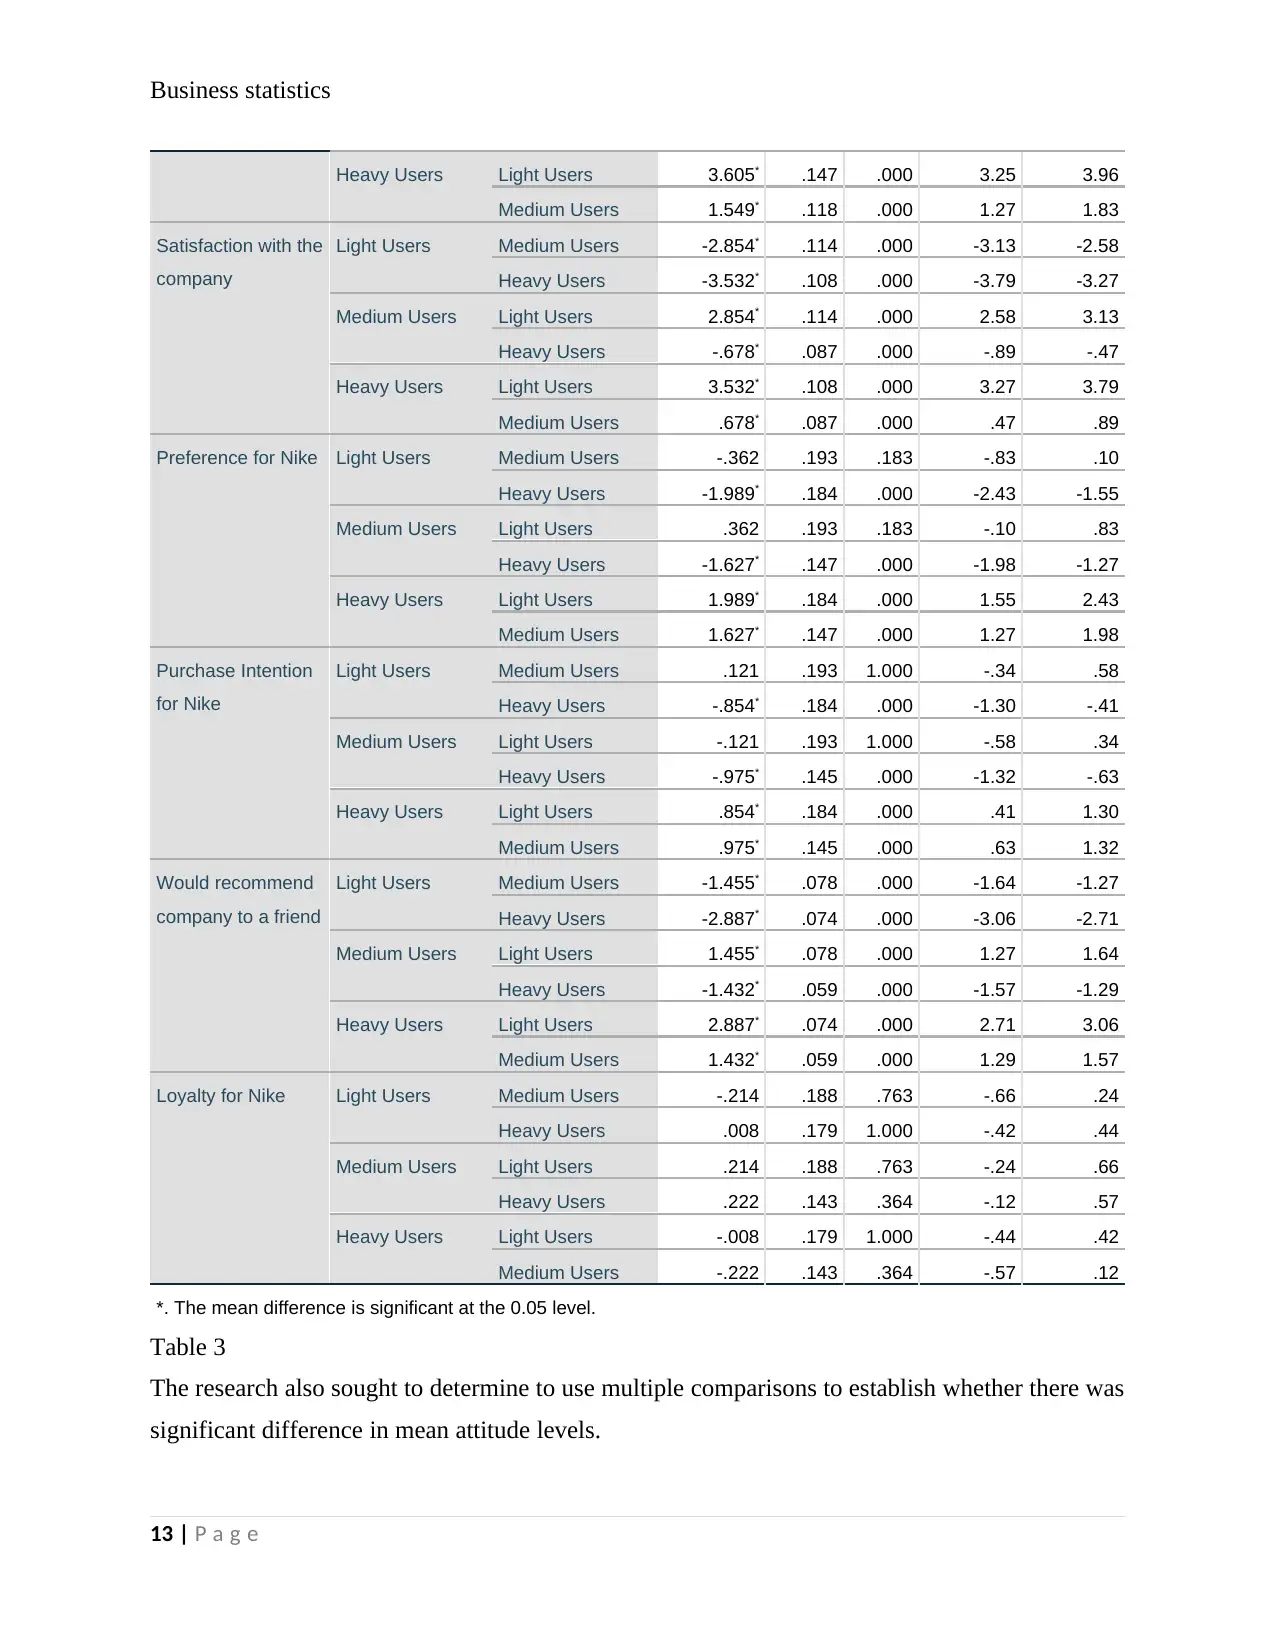
Table 3
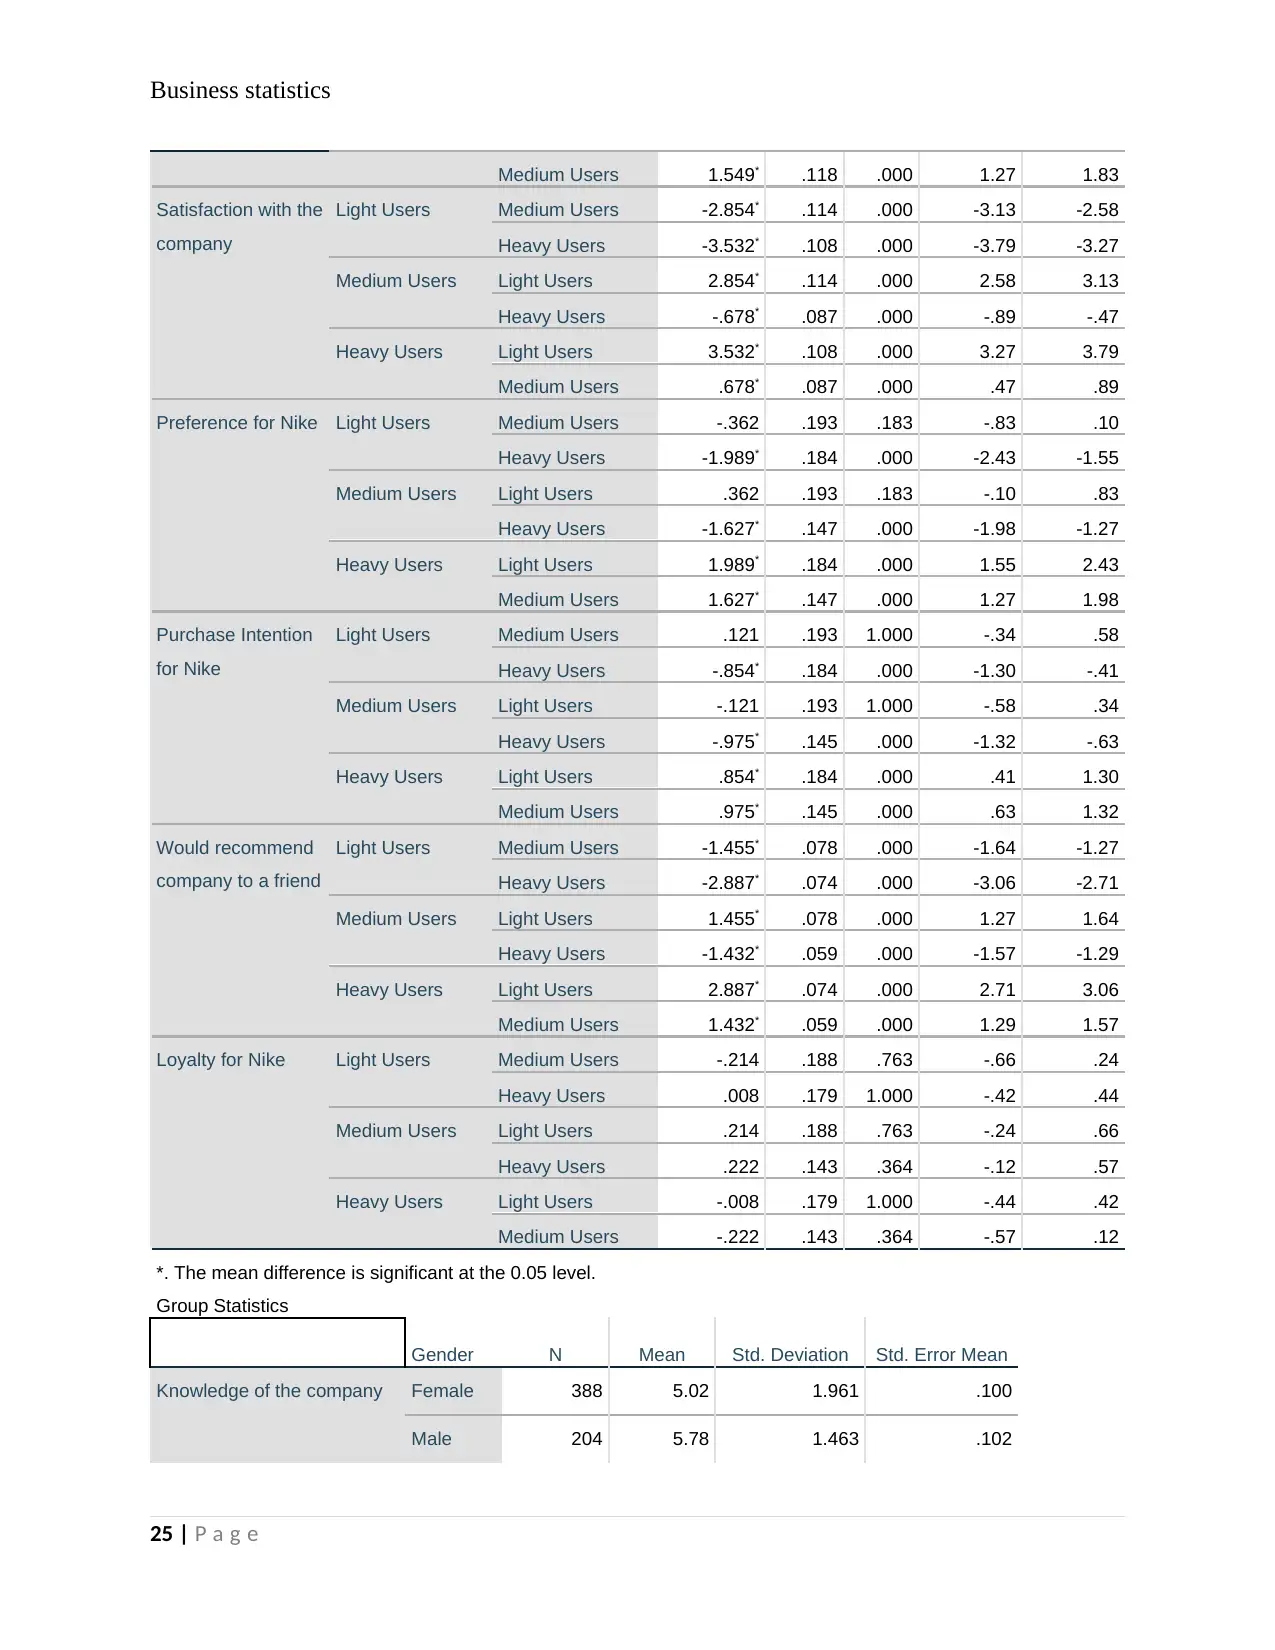
The research also sought to determine to use multiple comparisons to establish whether there was
significant difference in mean attitude levels.
13 | P a g e
Heavy Users Light Users 3.605* .147 .000 3.25 3.96
Medium Users 1.549* .118 .000 1.27 1.83
Satisfaction with the
company
Light Users Medium Users -2.854* .114 .000 -3.13 -2.58
Heavy Users -3.532* .108 .000 -3.79 -3.27
Medium Users Light Users 2.854* .114 .000 2.58 3.13
Heavy Users -.678* .087 .000 -.89 -.47
Heavy Users Light Users 3.532* .108 .000 3.27 3.79
Medium Users .678* .087 .000 .47 .89
Preference for Nike Light Users Medium Users -.362 .193 .183 -.83 .10
Heavy Users -1.989* .184 .000 -2.43 -1.55
Medium Users Light Users .362 .193 .183 -.10 .83
Heavy Users -1.627* .147 .000 -1.98 -1.27
Heavy Users Light Users 1.989* .184 .000 1.55 2.43
Medium Users 1.627* .147 .000 1.27 1.98
Purchase Intention
for Nike
Light Users Medium Users .121 .193 1.000 -.34 .58
Heavy Users -.854* .184 .000 -1.30 -.41
Medium Users Light Users -.121 .193 1.000 -.58 .34
Heavy Users -.975* .145 .000 -1.32 -.63
Heavy Users Light Users .854* .184 .000 .41 1.30
Medium Users .975* .145 .000 .63 1.32
Would recommend
company to a friend
Light Users Medium Users -1.455* .078 .000 -1.64 -1.27
Heavy Users -2.887* .074 .000 -3.06 -2.71
Medium Users Light Users 1.455* .078 .000 1.27 1.64
Heavy Users -1.432* .059 .000 -1.57 -1.29
Heavy Users Light Users 2.887* .074 .000 2.71 3.06
Medium Users 1.432* .059 .000 1.29 1.57
Loyalty for Nike Light Users Medium Users -.214 .188 .763 -.66 .24
Heavy Users .008 .179 1.000 -.42 .44
Medium Users Light Users .214 .188 .763 -.24 .66
Heavy Users .222 .143 .364 -.12 .57
Heavy Users Light Users -.008 .179 1.000 -.44 .42
Medium Users -.222 .143 .364 -.57 .12
*. The mean difference is significant at the 0.05 level.
Table 3
The research also sought to determine to use multiple comparisons to establish whether there was
significant difference in mean attitude levels.
13 | P a g e
Paraphrase This Document
Need a fresh take? Get an instant paraphrase of this document with our AI Paraphraser
Business statistics
Hypothesis
H0: Mean 1 = Mean 2 = Mean 3
Versus
H1: At least one mean is different
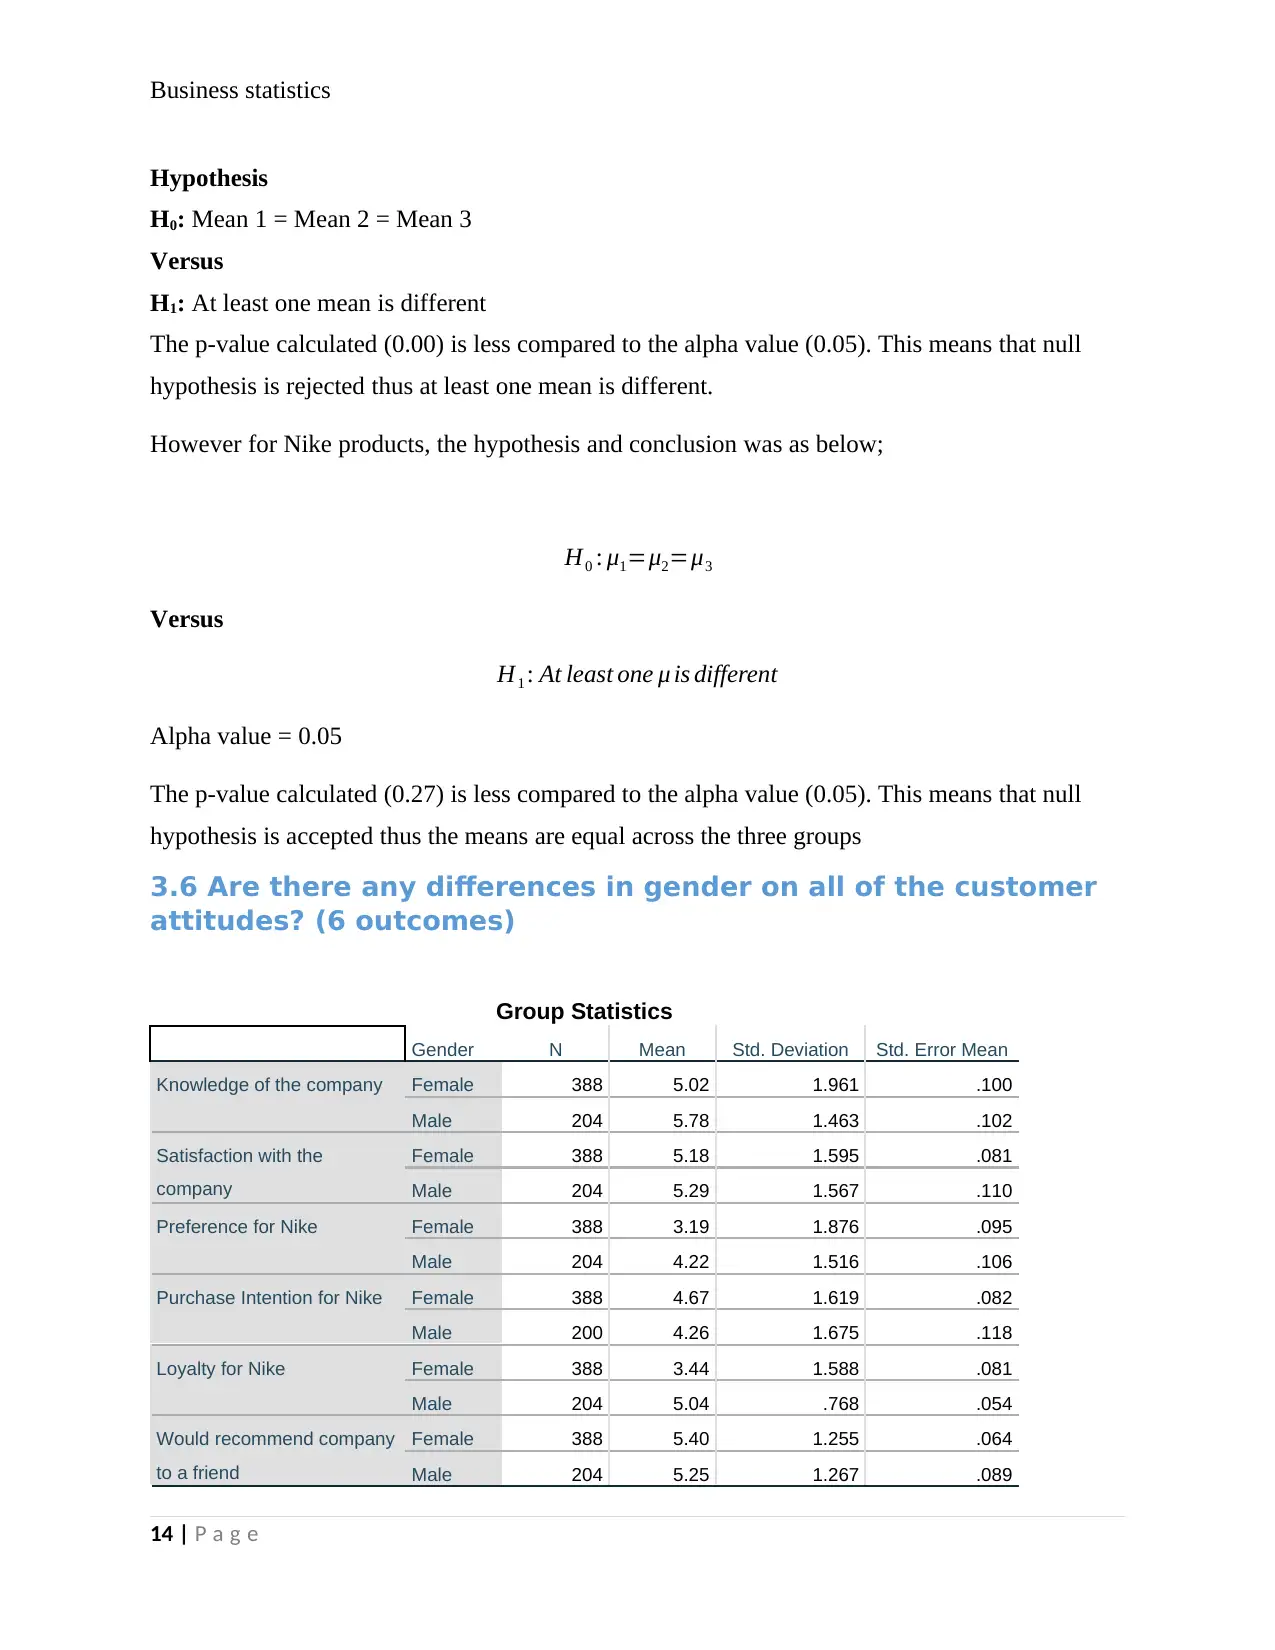
The p-value calculated (0.00) is less compared to the alpha value (0.05). This means that null
hypothesis is rejected thus at least one mean is different.
However for Nike products, the hypothesis and conclusion was as below;
H0 : μ1=μ2=μ3
Versus
H1 : At least one μ is different
Alpha value = 0.05
The p-value calculated (0.27) is less compared to the alpha value (0.05). This means that null
hypothesis is accepted thus the means are equal across the three groups
3.6 Are there any differences in gender on all of the customer
attitudes? (6 outcomes)
Group Statistics
Gender N Mean Std. Deviation Std. Error Mean
Knowledge of the company Female 388 5.02 1.961 .100
Male 204 5.78 1.463 .102
Satisfaction with the
company
Female 388 5.18 1.595 .081
Male 204 5.29 1.567 .110
Preference for Nike Female 388 3.19 1.876 .095
Male 204 4.22 1.516 .106
Purchase Intention for Nike Female 388 4.67 1.619 .082
Male 200 4.26 1.675 .118
Loyalty for Nike Female 388 3.44 1.588 .081
Male 204 5.04 .768 .054
Would recommend company
to a friend
Female 388 5.40 1.255 .064
Male 204 5.25 1.267 .089
14 | P a g e
Hypothesis
H0: Mean 1 = Mean 2 = Mean 3
Versus
H1: At least one mean is different
The p-value calculated (0.00) is less compared to the alpha value (0.05). This means that null
hypothesis is rejected thus at least one mean is different.
However for Nike products, the hypothesis and conclusion was as below;
H0 : μ1=μ2=μ3
Versus
H1 : At least one μ is different
Alpha value = 0.05
The p-value calculated (0.27) is less compared to the alpha value (0.05). This means that null
hypothesis is accepted thus the means are equal across the three groups
3.6 Are there any differences in gender on all of the customer
attitudes? (6 outcomes)
Group Statistics
Gender N Mean Std. Deviation Std. Error Mean
Knowledge of the company Female 388 5.02 1.961 .100
Male 204 5.78 1.463 .102
Satisfaction with the
company
Female 388 5.18 1.595 .081
Male 204 5.29 1.567 .110
Preference for Nike Female 388 3.19 1.876 .095
Male 204 4.22 1.516 .106
Purchase Intention for Nike Female 388 4.67 1.619 .082
Male 200 4.26 1.675 .118
Loyalty for Nike Female 388 3.44 1.588 .081
Male 204 5.04 .768 .054
Would recommend company
to a friend
Female 388 5.40 1.255 .064
Male 204 5.25 1.267 .089
14 | P a g e
Business statistics
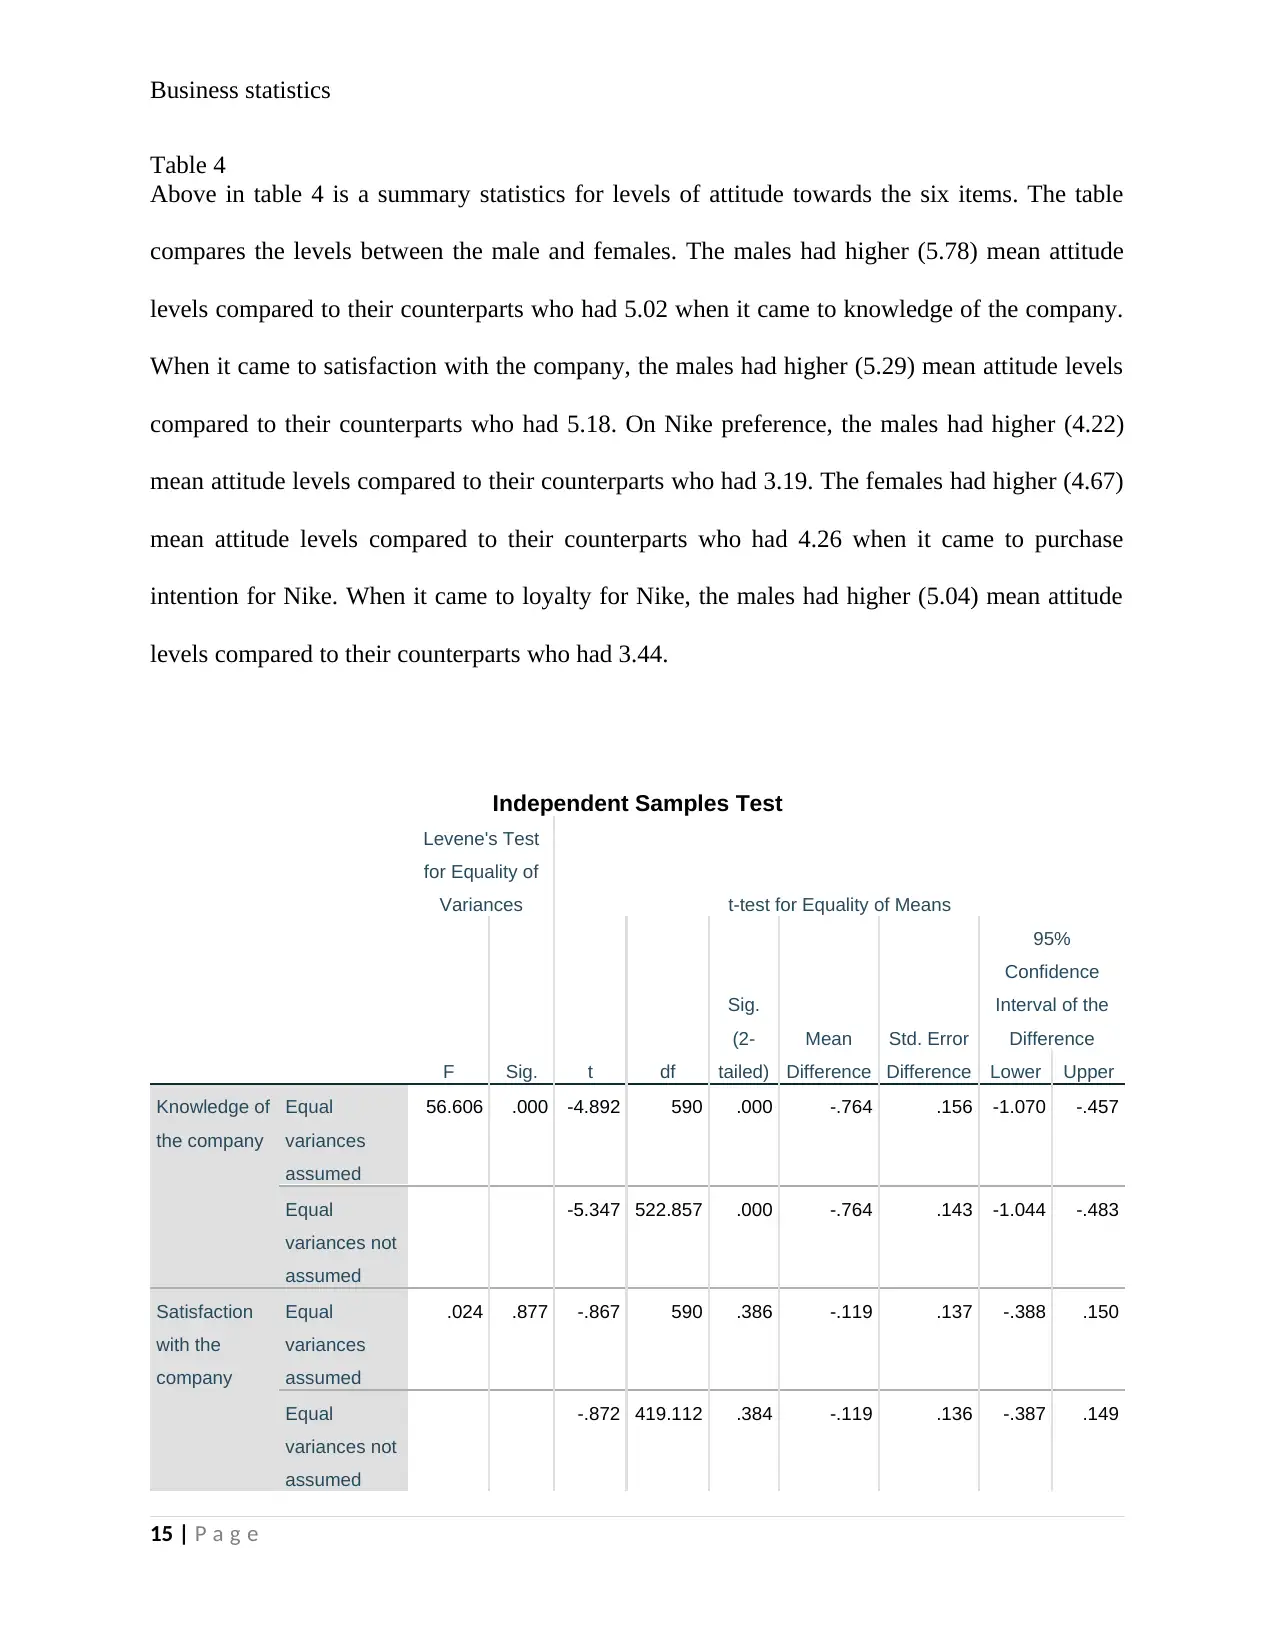
Table 4
Above in table 4 is a summary statistics for levels of attitude towards the six items. The table
compares the levels between the male and females. The males had higher (5.78) mean attitude
levels compared to their counterparts who had 5.02 when it came to knowledge of the company.
When it came to satisfaction with the company, the males had higher (5.29) mean attitude levels
compared to their counterparts who had 5.18. On Nike preference, the males had higher (4.22)
mean attitude levels compared to their counterparts who had 3.19. The females had higher (4.67)
mean attitude levels compared to their counterparts who had 4.26 when it came to purchase
intention for Nike. When it came to loyalty for Nike, the males had higher (5.04) mean attitude
levels compared to their counterparts who had 3.44.
Independent Samples Test
Levene's Test
for Equality of
Variances t-test for Equality of Means
F Sig. t df
Sig.
(2-
tailed)
Mean
Difference
Std. Error
Difference
95%
Confidence
Interval of the
Difference
Lower Upper
Knowledge of
the company
Equal
variances
assumed
56.606 .000 -4.892 590 .000 -.764 .156 -1.070 -.457
Equal
variances not
assumed
-5.347 522.857 .000 -.764 .143 -1.044 -.483
Satisfaction
with the
company
Equal
variances
assumed
.024 .877 -.867 590 .386 -.119 .137 -.388 .150
Equal
variances not
assumed
-.872 419.112 .384 -.119 .136 -.387 .149
15 | P a g e
Business statistics
Preference
for Nike
Equal
variances
assumed
14.901 .000 -6.765 590 .000 -1.030 .152 -1.329 -.731
Equal
variances not
assumed
-7.223 493.730 .000 -1.030 .143 -1.310 -.750
Purchase
Intention for
Nike
Equal
variances
assumed
2.724 .099 2.876 586 .004 .410 .143 .130 .690
Equal
variances not
assumed
2.845 390.123 .005 .410 .144 .127 .694
Loyalty for
Nike
Equal
variances
assumed
246.135 .000 -
13.543
590 .000 -1.596 .118 -1.827 -1.364
Equal
variances not
assumed
-
16.471
586.589 .000 -1.596 .097 -1.786 -1.406
Would
recommend
company to a
friend
Equal
variances
assumed
.157 .692 1.442 590 .150 .157 .109 -.057 .371
Equal
variances not
assumed
1.437 409.319 .151 .157 .109 -.058 .372
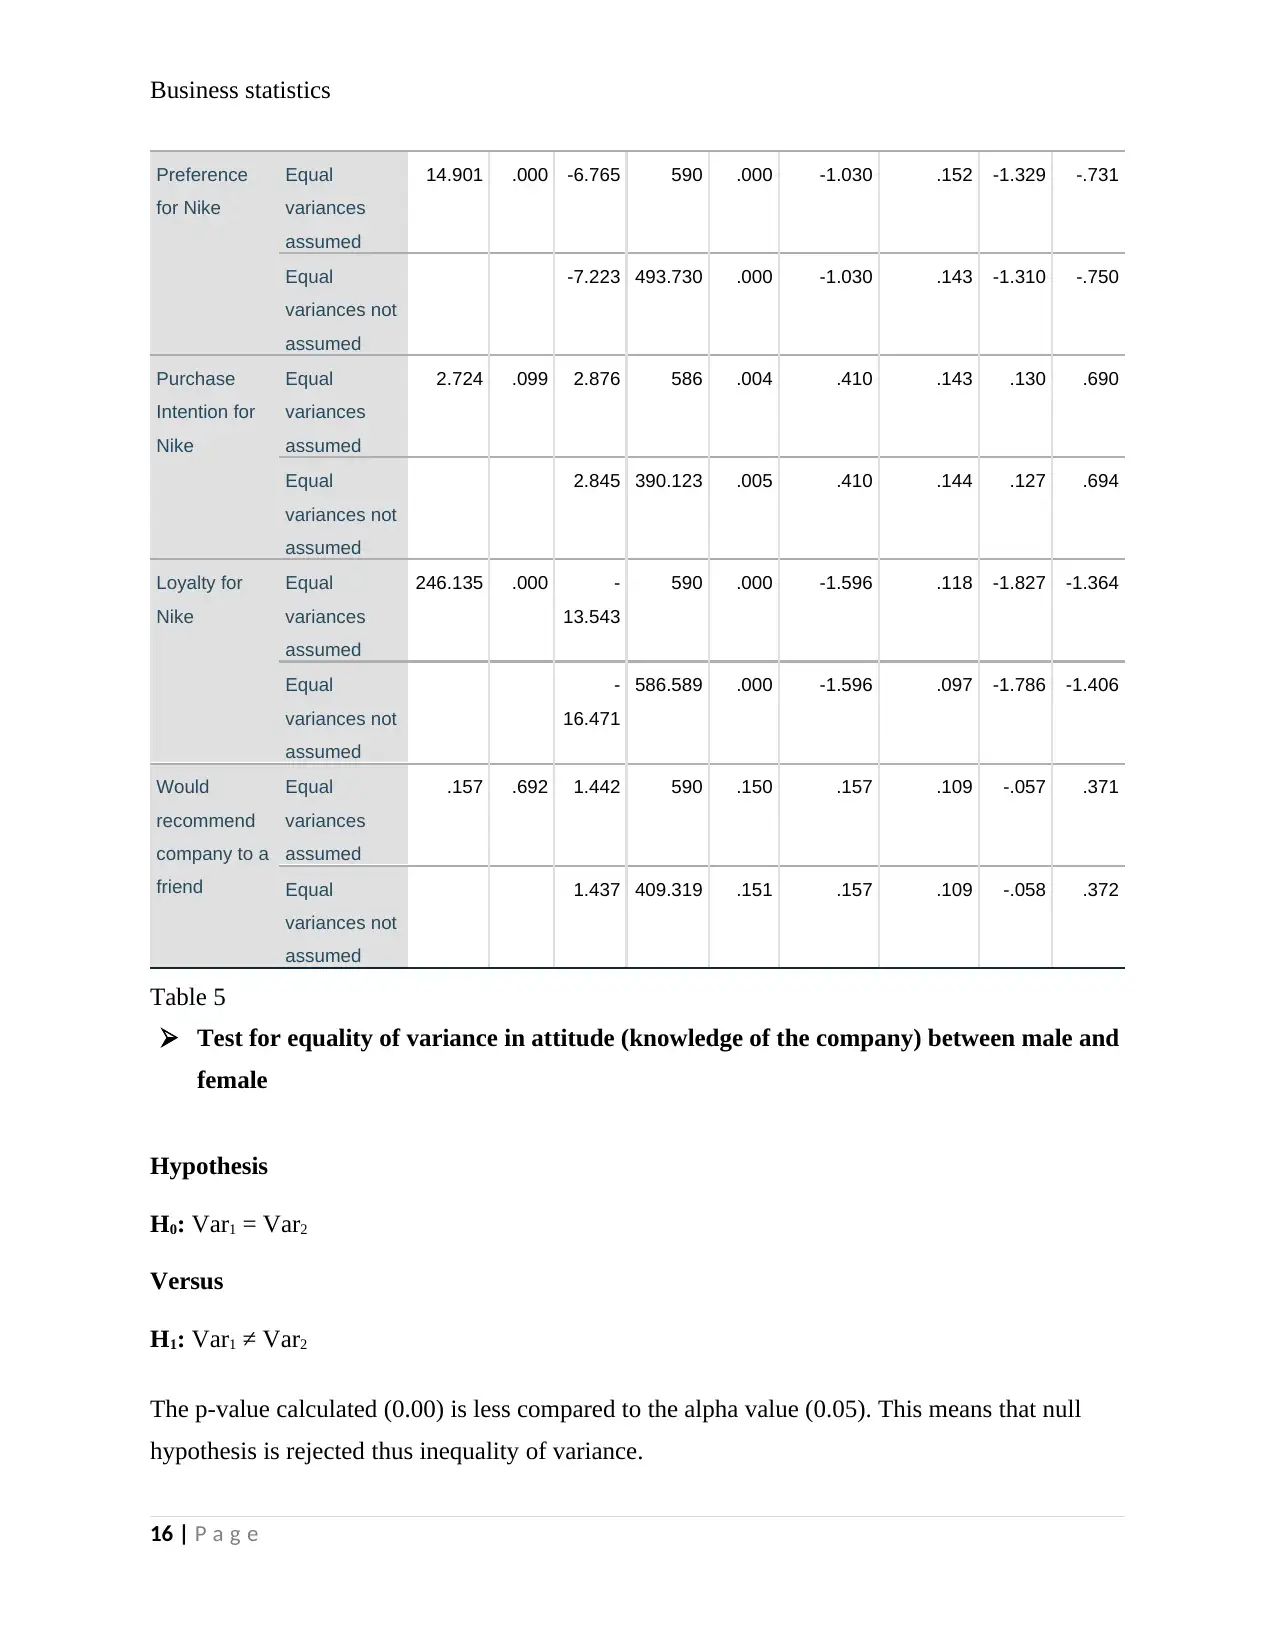
Table 5
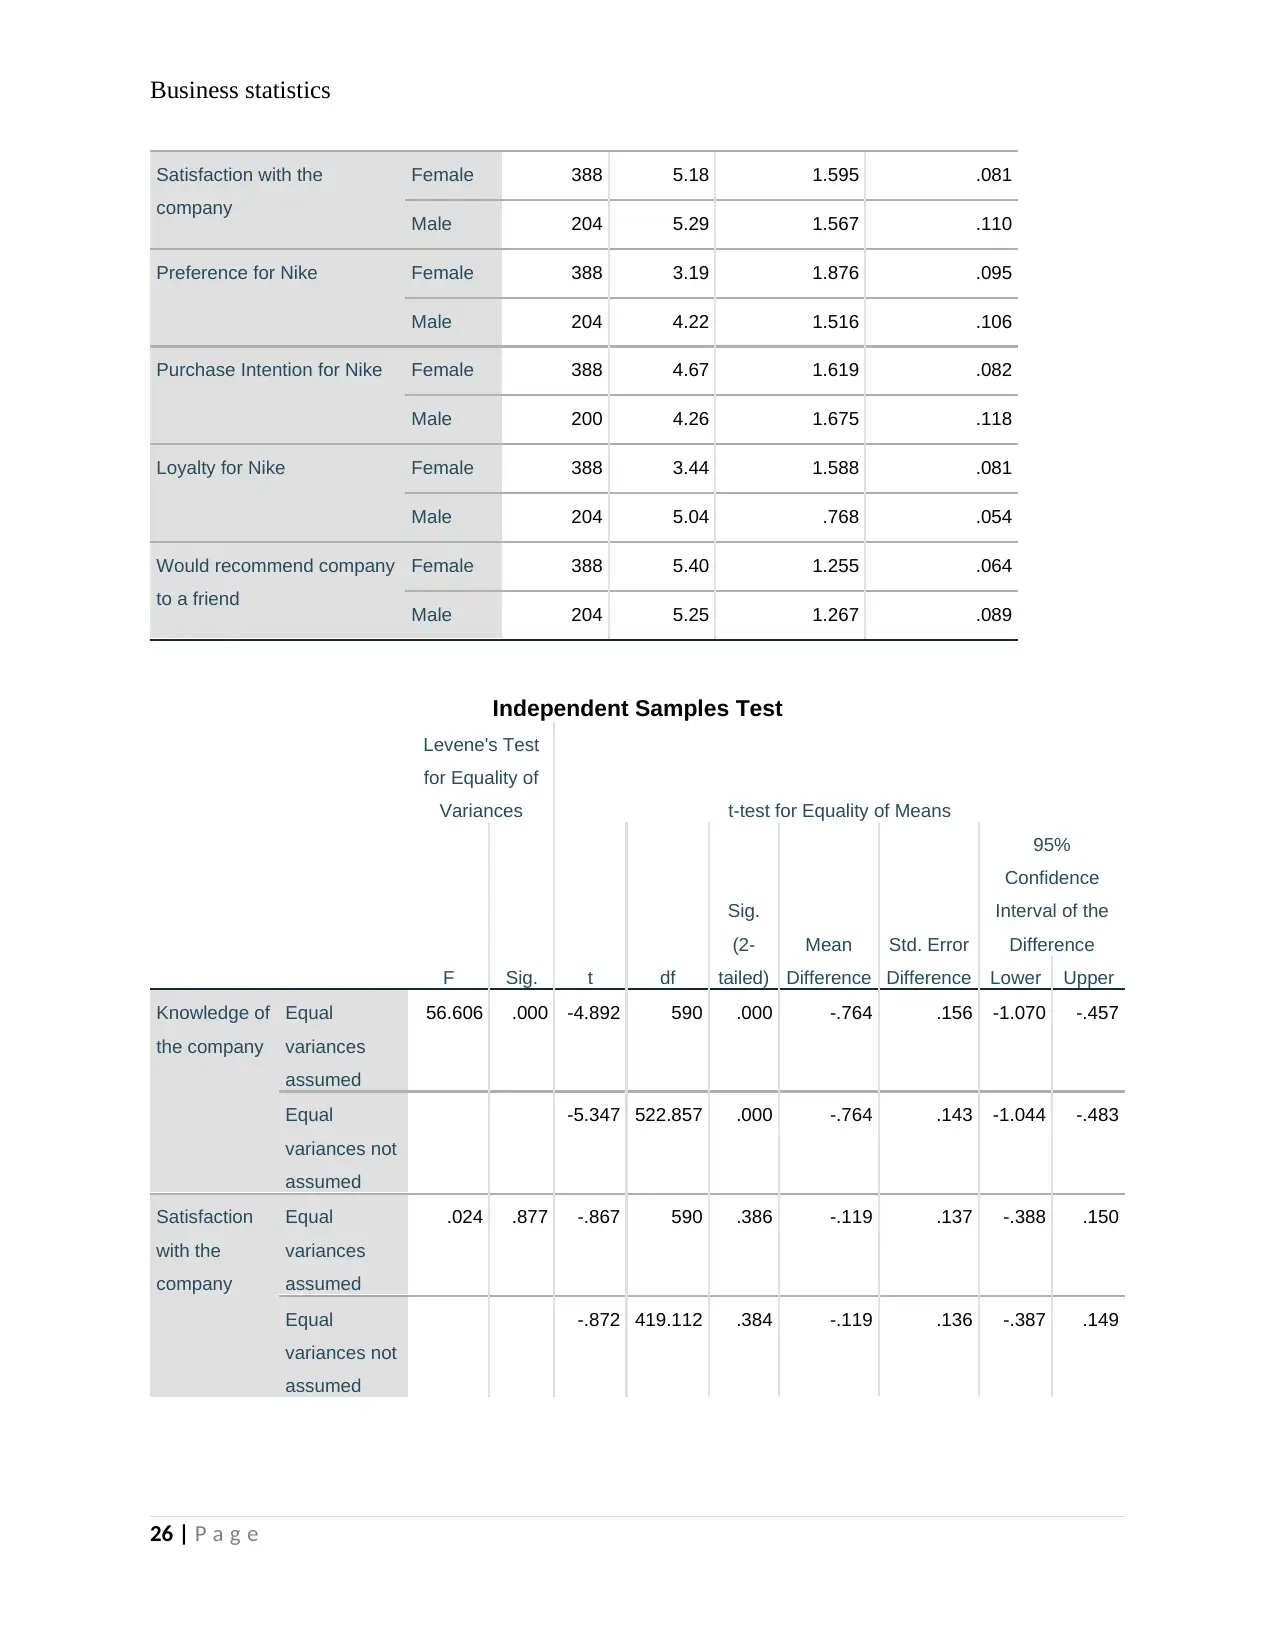
Test for equality of variance in attitude (knowledge of the company) between male and
female
Hypothesis
H0: Var1 = Var2
Versus
H1: Var1 ≠ Var2
The p-value calculated (0.00) is less compared to the alpha value (0.05). This means that null
hypothesis is rejected thus inequality of variance.
16 | P a g e
Preference
for Nike
Equal
variances
assumed
14.901 .000 -6.765 590 .000 -1.030 .152 -1.329 -.731
Equal
variances not
assumed
-7.223 493.730 .000 -1.030 .143 -1.310 -.750
Purchase
Intention for
Nike
Equal
variances
assumed
2.724 .099 2.876 586 .004 .410 .143 .130 .690
Equal
variances not
assumed
2.845 390.123 .005 .410 .144 .127 .694
Loyalty for
Nike
Equal
variances
assumed
246.135 .000 -
13.543
590 .000 -1.596 .118 -1.827 -1.364
Equal
variances not
assumed
-
16.471
586.589 .000 -1.596 .097 -1.786 -1.406
Would
recommend
company to a
friend
Equal
variances
assumed
.157 .692 1.442 590 .150 .157 .109 -.057 .371
Equal
variances not
assumed
1.437 409.319 .151 .157 .109 -.058 .372
Table 5
Test for equality of variance in attitude (knowledge of the company) between male and
female
Hypothesis
H0: Var1 = Var2
Versus
H1: Var1 ≠ Var2
The p-value calculated (0.00) is less compared to the alpha value (0.05). This means that null
hypothesis is rejected thus inequality of variance.
16 | P a g e
Secure Best Marks with AI Grader
Need help grading? Try our AI Grader for instant feedback on your assignments.
Business statistics
Test for equality of variance in attitude (satisfaction with the company) between male
and female
Hypothesis
H0: Var1 = Var2
Versus
H1: Var1 ≠ Var2
The p-value calculated (0.39) is less compared to the alpha value (0.05). This means that null
hypothesis is rejected thus equality of variance in attitude levels between the males and females.
Test for equality of variance in attitude (preference for Nike) between male and female
Hypothesis
H0: Var1 = Var2
Versus
H1: Var1 ≠ Var2
The p-value calculated (0.00) is less compared to the alpha value (0.05). This means that null
hypothesis is rejected thus inequality of variance.
Test for equality of variance in attitude (purchase intention for Nike) between male
and female
Hypothesis
H0: Var1 = Var2
Versus
H1: Var1 ≠ Var2
17 | P a g e
Business statistics
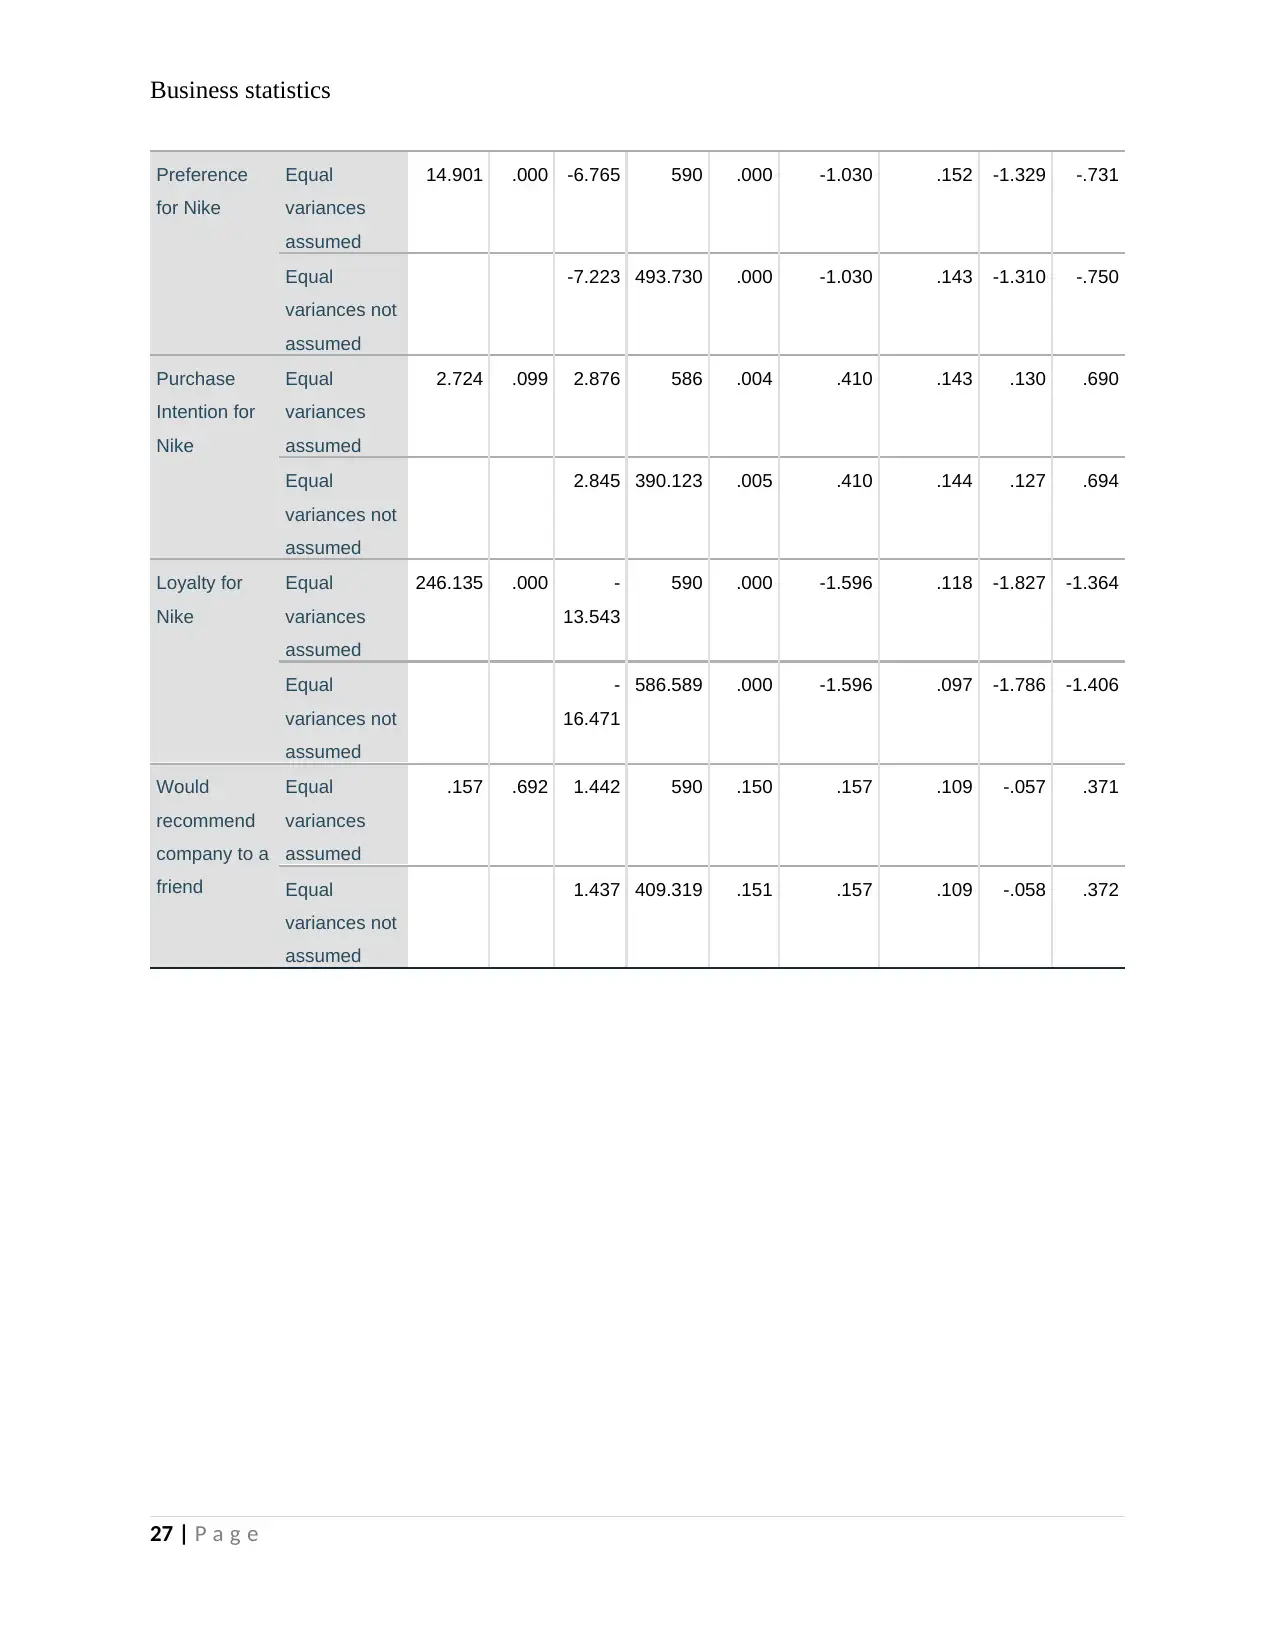
The p-value calculated (0.00) is less compared to the alpha value (0.05). This means that null
hypothesis is rejected thus inequality of variance in attitude levels between the males and
females.
Test for equality of variance in attitude (loyalty for Nike) between male and female
Hypothesis
H0: Var1 = Var2
Versus
H1: Var1 ≠ Var2
The p-value calculated (0.00) is less compared to the alpha value (0.05). This means that null
hypothesis is rejected thus inequality of variance in attitude levels between the males and
females.
Test for equality of variance in customer attitude (would recommend company to a
friend) between male and female
Hypothesis
H0: Var1 = Var2
Versus
H1: Var1 ≠ Var2
The p-value calculated (0.15) is great compared to the alpha value (0.05). This means that null
hypothesis is accepted thus equality of variance in attitude levels between the males and females.
One sample t-test for the mean satisfaction level (3.5)
Hypothesis
H0: Mean = 3.5
Versus
H1: Mean ≠ 3.5
18 | P a g e
The p-value calculated (0.00) is less compared to the alpha value (0.05). This means that null
hypothesis is rejected thus inequality of variance in attitude levels between the males and
females.
Test for equality of variance in attitude (loyalty for Nike) between male and female
Hypothesis
H0: Var1 = Var2
Versus
H1: Var1 ≠ Var2
The p-value calculated (0.00) is less compared to the alpha value (0.05). This means that null
hypothesis is rejected thus inequality of variance in attitude levels between the males and
females.
Test for equality of variance in customer attitude (would recommend company to a
friend) between male and female
Hypothesis
H0: Var1 = Var2
Versus
H1: Var1 ≠ Var2
The p-value calculated (0.15) is great compared to the alpha value (0.05). This means that null
hypothesis is accepted thus equality of variance in attitude levels between the males and females.
One sample t-test for the mean satisfaction level (3.5)
Hypothesis
H0: Mean = 3.5
Versus
H1: Mean ≠ 3.5
18 | P a g e
Business statistics
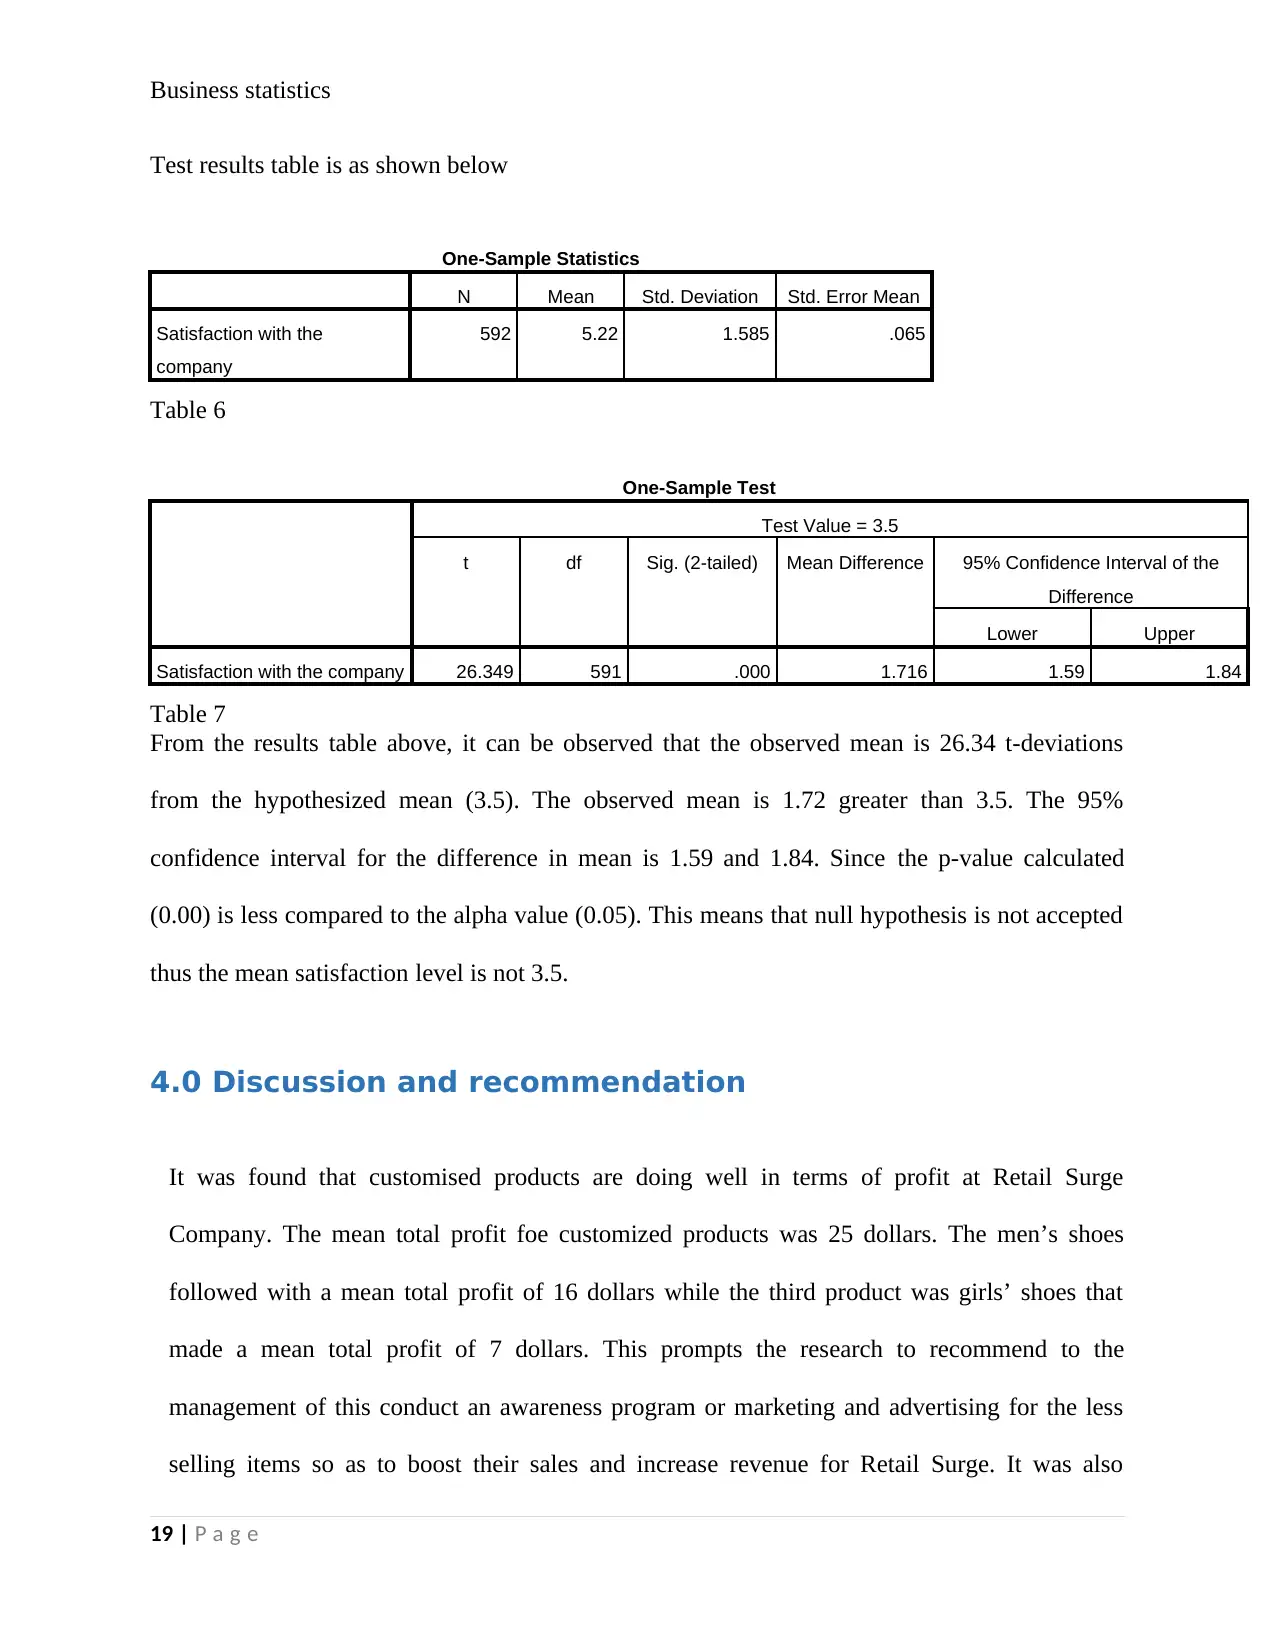
Test results table is as shown below
One-Sample Statistics
N Mean Std. Deviation Std. Error Mean
Satisfaction with the
company
592 5.22 1.585 .065
Table 6
One-Sample Test
Test Value = 3.5
t df Sig. (2-tailed) Mean Difference 95% Confidence Interval of the
Difference
Lower Upper
Satisfaction with the company 26.349 591 .000 1.716 1.59 1.84
Table 7
From the results table above, it can be observed that the observed mean is 26.34 t-deviations
from the hypothesized mean (3.5). The observed mean is 1.72 greater than 3.5. The 95%
confidence interval for the difference in mean is 1.59 and 1.84. Since the p-value calculated
(0.00) is less compared to the alpha value (0.05). This means that null hypothesis is not accepted
thus the mean satisfaction level is not 3.5.
4.0 Discussion and recommendation
It was found that customised products are doing well in terms of profit at Retail Surge
Company. The mean total profit foe customized products was 25 dollars. The men’s shoes
followed with a mean total profit of 16 dollars while the third product was girls’ shoes that
made a mean total profit of 7 dollars. This prompts the research to recommend to the
management of this conduct an awareness program or marketing and advertising for the less
selling items so as to boost their sales and increase revenue for Retail Surge. It was also
19 | P a g e
Paraphrase This Document
Need a fresh take? Get an instant paraphrase of this document with our AI Paraphraser
Business statistics
observed from the results in the bar graph previously that customised products are doing well
in terms of mean cost of goods. The mean cost of goods for customized products was about 10
dollars. The girls’ shoes followed with a mean cost of goods of 8 dollars while the third
product was women’s shoes that made a mean cost of goods of 5 dollars. The company is
therefore advised to balance the less costly goods and the highly costly goods so as to widen
the profit margin of the Retail Surge company.
Reference
20 | P a g e
Business statistics
Derrick, B., Toher, D., & White, P. (2017). How to compare the mean of two samples that
include paired observations and independent observations. Quantitative methods for
Psychology, 13(2), 120 - 126.
Gelman, A. (2005). Analysis of variance? Why it is more important than ever. The anals of
Statistics, 33, 1 - 53.
Hinkelmann, K., & Kempthorne, O. (2010). Design and analysis of experiments (5 ed., Vol. 8).
Howell, D. C. (2007). Statistical methods for Psychology (3 ed., Vol. 5).
Leigh, E. S. (2008). Consumer rites. Selling of American Holidays, 6(3), 106 - 191.
21 | P a g e
Business statistics
Appendix
22 | P a g e
Appendix
22 | P a g e
Secure Best Marks with AI Grader
Need help grading? Try our AI Grader for instant feedback on your assignments.
Business statistics
Descriptives
N Mean
Std.
Deviation
Std.
Error
95% Confidence
Interval for Mean
Minimum Maximum
Lower
Bound
Upper
Bound
Knowledge of the
company
Light
Users
104 2.85 1.711 .168 2.51 3.18 1 6
Medium
Users
204 4.90 1.664 .116 4.67 5.13 2 7
Heavy
Users
284 6.45 .601 .036 6.38 6.52 5 7
Total 592 5.28 1.840 .076 5.14 5.43 1 7
Satisfaction with
the company
Light
Users
104 2.54 1.157 .113 2.31 2.76 1 6
Medium
Users
204 5.39 1.033 .072 5.25 5.53 2 7
Heavy
Users
284 6.07 .776 .046 5.98 6.16 2 7
Total 592 5.22 1.585 .065 5.09 5.34 1 7
Preference for
Nike
Light
Users
104 2.46 1.507 .148 2.17 2.75 1 6
23 | P a g e
Business statistics
Medium
Users
204 2.82 1.572 .110 2.61 3.04 1 5
Heavy
Users
284 4.45 1.654 .098 4.26 4.64 1 7
Total 592 3.54 1.826 .075 3.39 3.69 1 7
Purchase Intention
for Nike
Light
Users
100 4.16 1.835 .184 3.80 4.52 1 7
Medium
Users
204 4.04 1.893 .133 3.78 4.30 2 7
Heavy
Users
284 5.01 1.195 .071 4.87 5.15 3 7
Total 588 4.53 1.648 .068 4.40 4.66 1 7
Would recommend
company to a
friend
Light
Users
104 3.46 1.131 .111 3.24 3.68 2 6
Medium
Users
204 4.92 .494 .035 4.85 4.98 4 6
Heavy
Users
284 6.35 .477 .028 6.29 6.40 6 7
Total 592 5.35 1.260 .052 5.25 5.45 2 7
Loyalty for Nike Light
Users
104 3.92 1.499 .147 3.63 4.21 2 6
Medium
Users
204 4.14 1.563 .109 3.92 4.35 2 6
Heavy
Users
284 3.92 1.575 .093 3.73 4.10 2 7
Total 592 3.99 1.559 .064 3.87 4.12 2 7
Multiple Comparisons
Bonferroni
Dependent Variable
(I) Webiste User
Group
(J) Webiste User
Group
Mean
Difference
(I-J)
Std.
Error Sig.
95% Confidence
Interval
Lower
Bound
Upper
Bound
Knowledge of the
company
Light Users Medium Users -2.056* .154 .000 -2.43 -1.69
Heavy Users -3.605* .147 .000 -3.96 -3.25
Medium Users Light Users 2.056* .154 .000 1.69 2.43
Heavy Users -1.549* .118 .000 -1.83 -1.27
Heavy Users Light Users 3.605* .147 .000 3.25 3.96
24 | P a g e
Medium
Users
204 2.82 1.572 .110 2.61 3.04 1 5
Heavy
Users
284 4.45 1.654 .098 4.26 4.64 1 7
Total 592 3.54 1.826 .075 3.39 3.69 1 7
Purchase Intention
for Nike
Light
Users
100 4.16 1.835 .184 3.80 4.52 1 7
Medium
Users
204 4.04 1.893 .133 3.78 4.30 2 7
Heavy
Users
284 5.01 1.195 .071 4.87 5.15 3 7
Total 588 4.53 1.648 .068 4.40 4.66 1 7
Would recommend
company to a
friend
Light
Users
104 3.46 1.131 .111 3.24 3.68 2 6
Medium
Users
204 4.92 .494 .035 4.85 4.98 4 6
Heavy
Users
284 6.35 .477 .028 6.29 6.40 6 7
Total 592 5.35 1.260 .052 5.25 5.45 2 7
Loyalty for Nike Light
Users
104 3.92 1.499 .147 3.63 4.21 2 6
Medium
Users
204 4.14 1.563 .109 3.92 4.35 2 6
Heavy
Users
284 3.92 1.575 .093 3.73 4.10 2 7
Total 592 3.99 1.559 .064 3.87 4.12 2 7
Multiple Comparisons
Bonferroni
Dependent Variable
(I) Webiste User
Group
(J) Webiste User
Group
Mean
Difference
(I-J)
Std.
Error Sig.
95% Confidence
Interval
Lower
Bound
Upper
Bound
Knowledge of the
company
Light Users Medium Users -2.056* .154 .000 -2.43 -1.69
Heavy Users -3.605* .147 .000 -3.96 -3.25
Medium Users Light Users 2.056* .154 .000 1.69 2.43
Heavy Users -1.549* .118 .000 -1.83 -1.27
Heavy Users Light Users 3.605* .147 .000 3.25 3.96
24 | P a g e
Business statistics
Medium Users 1.549* .118 .000 1.27 1.83
Satisfaction with the
company
Light Users Medium Users -2.854* .114 .000 -3.13 -2.58
Heavy Users -3.532* .108 .000 -3.79 -3.27
Medium Users Light Users 2.854* .114 .000 2.58 3.13
Heavy Users -.678* .087 .000 -.89 -.47
Heavy Users Light Users 3.532* .108 .000 3.27 3.79
Medium Users .678* .087 .000 .47 .89
Preference for Nike Light Users Medium Users -.362 .193 .183 -.83 .10
Heavy Users -1.989* .184 .000 -2.43 -1.55
Medium Users Light Users .362 .193 .183 -.10 .83
Heavy Users -1.627* .147 .000 -1.98 -1.27
Heavy Users Light Users 1.989* .184 .000 1.55 2.43
Medium Users 1.627* .147 .000 1.27 1.98
Purchase Intention
for Nike
Light Users Medium Users .121 .193 1.000 -.34 .58
Heavy Users -.854* .184 .000 -1.30 -.41
Medium Users Light Users -.121 .193 1.000 -.58 .34
Heavy Users -.975* .145 .000 -1.32 -.63
Heavy Users Light Users .854* .184 .000 .41 1.30
Medium Users .975* .145 .000 .63 1.32
Would recommend
company to a friend
Light Users Medium Users -1.455* .078 .000 -1.64 -1.27
Heavy Users -2.887* .074 .000 -3.06 -2.71
Medium Users Light Users 1.455* .078 .000 1.27 1.64
Heavy Users -1.432* .059 .000 -1.57 -1.29
Heavy Users Light Users 2.887* .074 .000 2.71 3.06
Medium Users 1.432* .059 .000 1.29 1.57
Loyalty for Nike Light Users Medium Users -.214 .188 .763 -.66 .24
Heavy Users .008 .179 1.000 -.42 .44
Medium Users Light Users .214 .188 .763 -.24 .66
Heavy Users .222 .143 .364 -.12 .57
Heavy Users Light Users -.008 .179 1.000 -.44 .42
Medium Users -.222 .143 .364 -.57 .12
*. The mean difference is significant at the 0.05 level.
Group Statistics
Gender N Mean Std. Deviation Std. Error Mean
Knowledge of the company Female 388 5.02 1.961 .100
Male 204 5.78 1.463 .102
25 | P a g e
Paraphrase This Document
Need a fresh take? Get an instant paraphrase of this document with our AI Paraphraser
Business statistics
Satisfaction with the
company
Female 388 5.18 1.595 .081
Male 204 5.29 1.567 .110
Preference for Nike Female 388 3.19 1.876 .095
Male 204 4.22 1.516 .106
Purchase Intention for Nike Female 388 4.67 1.619 .082
Male 200 4.26 1.675 .118
Loyalty for Nike Female 388 3.44 1.588 .081
Male 204 5.04 .768 .054
Would recommend company
to a friend
Female 388 5.40 1.255 .064
Male 204 5.25 1.267 .089
Independent Samples Test
Levene's Test
for Equality of
Variances t-test for Equality of Means
F Sig. t df
Sig.
(2-
tailed)
Mean
Difference
Std. Error
Difference
95%
Confidence
Interval of the
Difference
Lower Upper
Knowledge of
the company
Equal
variances
assumed
56.606 .000 -4.892 590 .000 -.764 .156 -1.070 -.457
Equal
variances not
assumed
-5.347 522.857 .000 -.764 .143 -1.044 -.483
Satisfaction
with the
company
Equal
variances
assumed
.024 .877 -.867 590 .386 -.119 .137 -.388 .150
Equal
variances not
assumed
-.872 419.112 .384 -.119 .136 -.387 .149
26 | P a g e
Business statistics
Preference
for Nike
Equal
variances
assumed
14.901 .000 -6.765 590 .000 -1.030 .152 -1.329 -.731
Equal
variances not
assumed
-7.223 493.730 .000 -1.030 .143 -1.310 -.750
Purchase
Intention for
Nike
Equal
variances
assumed
2.724 .099 2.876 586 .004 .410 .143 .130 .690
Equal
variances not
assumed
2.845 390.123 .005 .410 .144 .127 .694
Loyalty for
Nike
Equal
variances
assumed
246.135 .000 -
13.543
590 .000 -1.596 .118 -1.827 -1.364
Equal
variances not
assumed
-
16.471
586.589 .000 -1.596 .097 -1.786 -1.406
Would
recommend
company to a
friend
Equal
variances
assumed
.157 .692 1.442 590 .150 .157 .109 -.057 .371
Equal
variances not
assumed
1.437 409.319 .151 .157 .109 -.058 .372
27 | P a g e
1 out of 27
Related Documents


Your All-in-One AI-Powered Toolkit for Academic Success.
+13062052269
info@desklib.com
Available 24*7 on WhatsApp / Email
![[object Object]](/_next/static/media/star-bottom.7253800d.svg)
Unlock your academic potential
© 2024 | Zucol Services PVT LTD | All rights reserved.