ITC 516 Data Mining: Performance Analysis of Algorithms Report
VerifiedAdded on 2024/05/31
|16
|2019
|331
Report
AI Summary
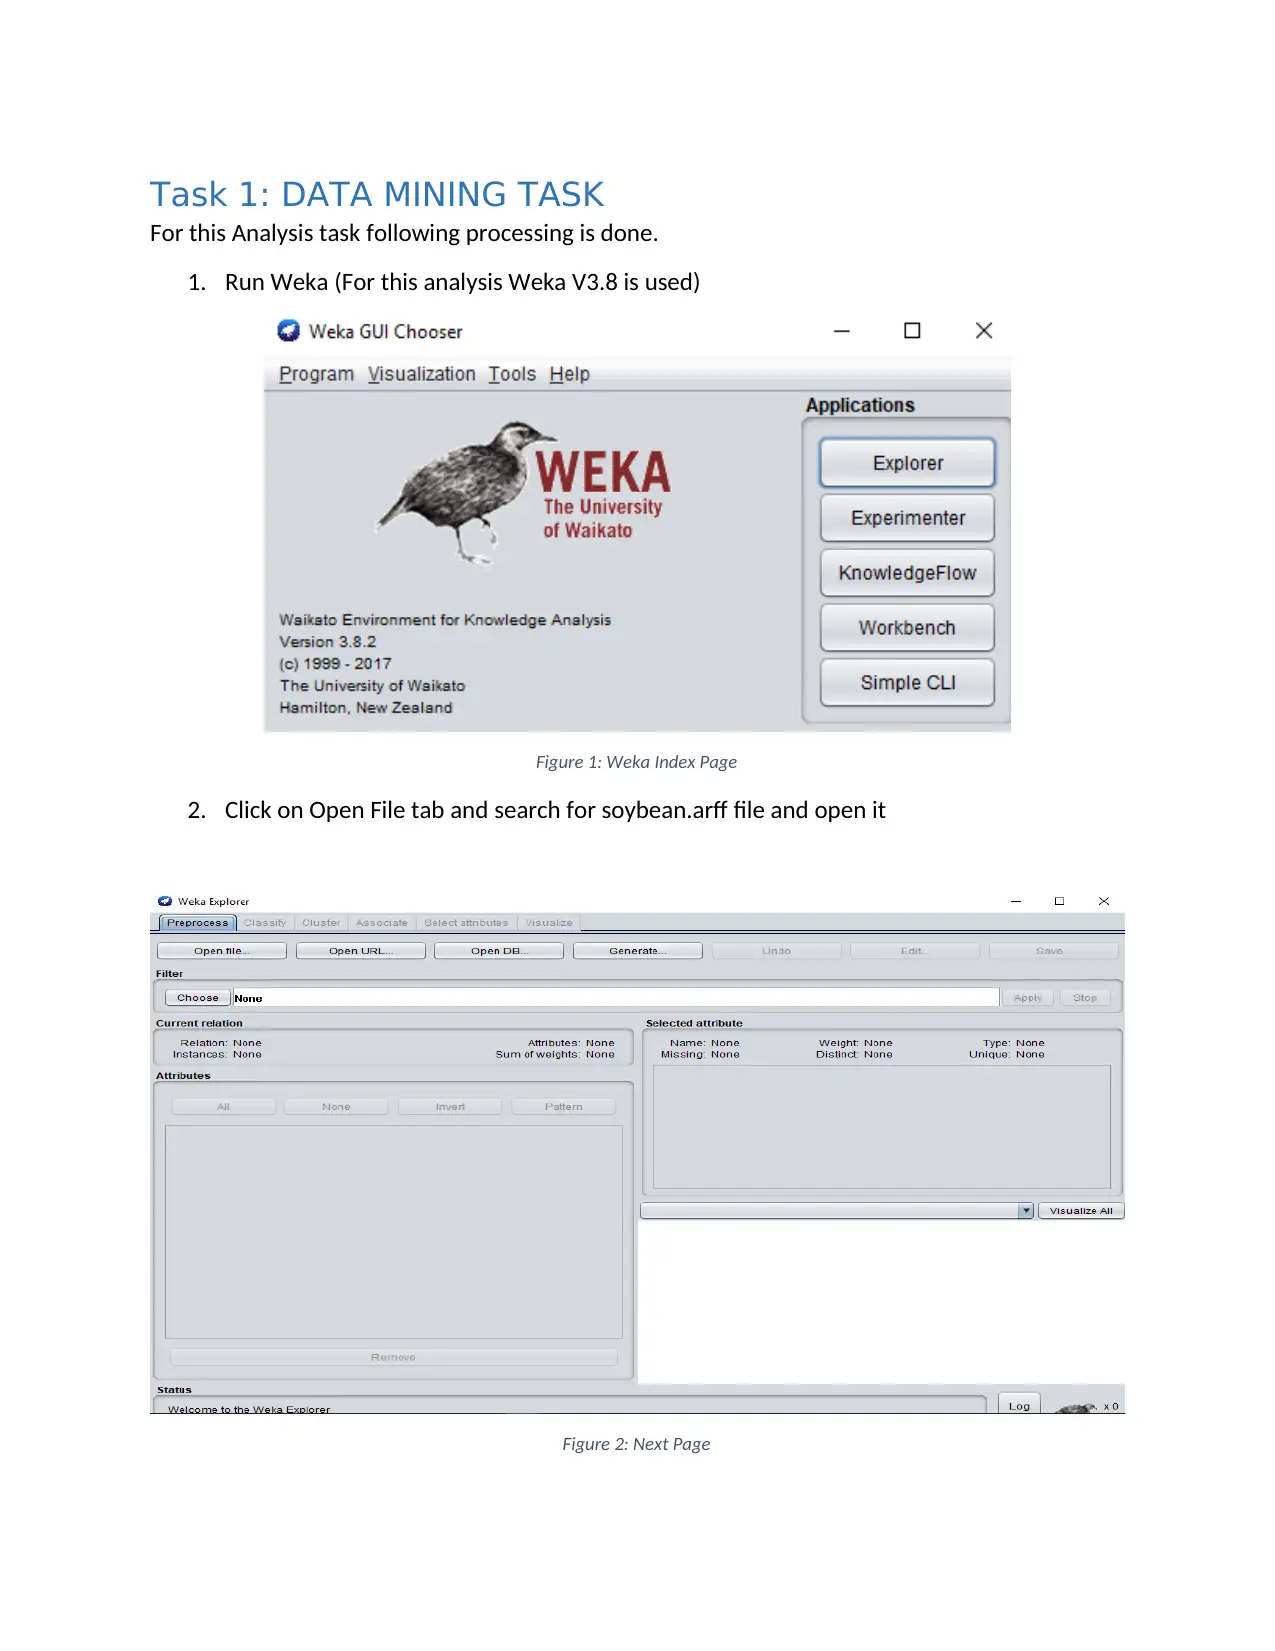
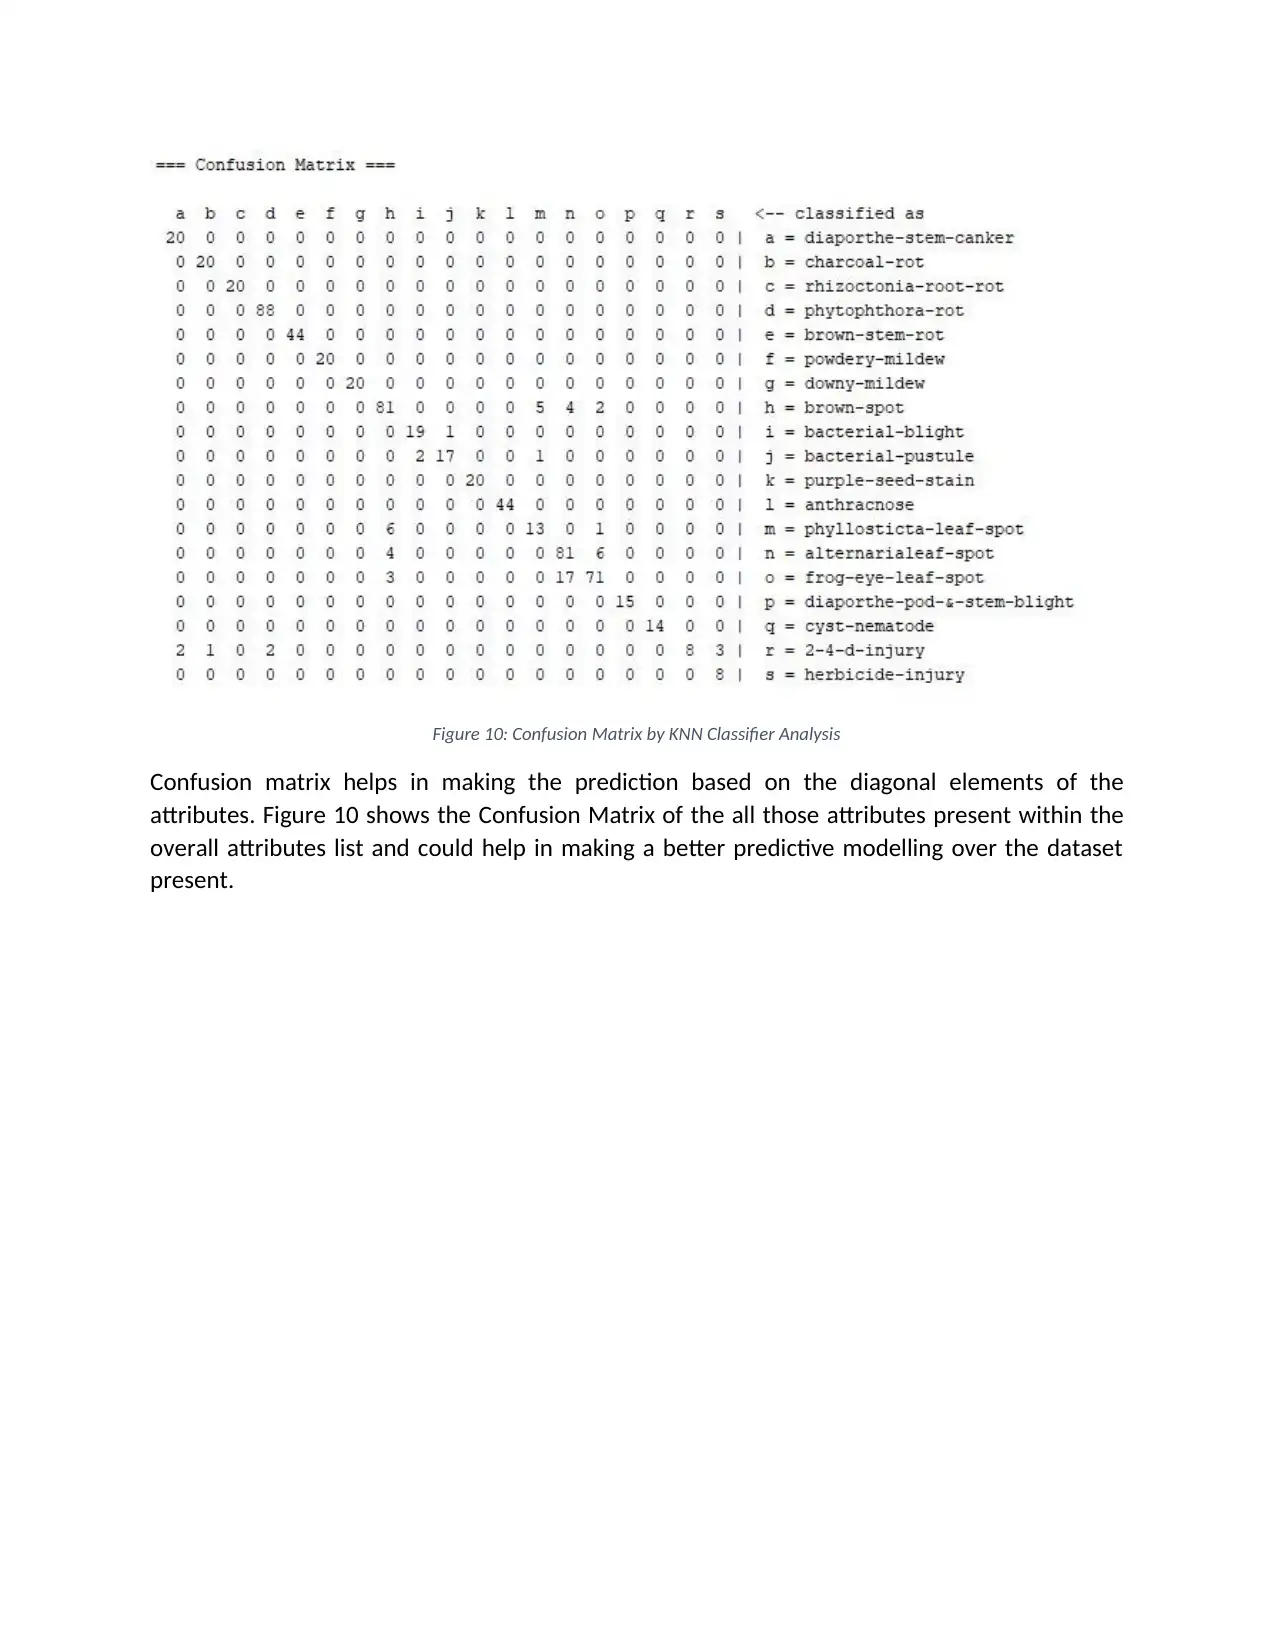
This report provides a comprehensive analysis of data mining techniques, specifically focusing on the application and comparison of Decision Tree, Naive Bayes, and K-Nearest Neighbor (KNN) algorithms using the Weka software. The analysis is performed on a soybean dataset (ARFF format) to evaluate the performance of each algorithm based on metrics such as accuracy, precision, and confusion matrix analysis. The report details the steps involved in data loading, algorithm execution, and result interpretation within the Weka environment. Furthermore, it discusses the strengths and weaknesses of each algorithm, considering factors like computational cost, scalability, and sensitivity to data characteristics, ultimately concluding on the suitability of each algorithm for different data mining tasks. The document is contributed by a student and is available on Desklib, a platform offering study tools and resources for students.


1 out of 16
Related Documents


Your All-in-One AI-Powered Toolkit for Academic Success.
+13062052269
info@desklib.com
Available 24*7 on WhatsApp / Email
![[object Object]](/_next/static/media/star-bottom.7253800d.svg)
Copyright © 2020–2026 A2Z Services. All Rights Reserved. Developed and managed by ZUCOL.