logo

Data Analysis and Visualization

16 Pages2350 Words88 Views
   

Added on  2023-01-04

About This Document

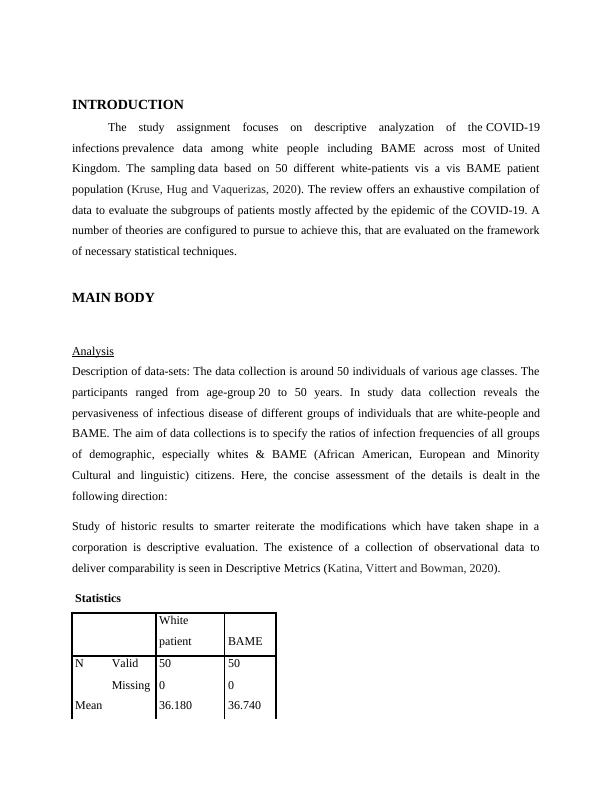
This study assignment focuses on the descriptive analysis of COVID-19 infections prevalence data among white people including BAME in the UK. The data collection includes 50 individuals and aims to specify the ratios of infection frequencies among different demographic groups. The analysis techniques used include one-sample t-test and correlations.

Data Analysis and Visualization

   Added on 2023-01-04

ShareRelated Documents
Data Analysis and Visualization
Data Analysis and Visualization_1
Contents
INTRODUCTION.......................................................................................................................................3
MAIN BODY..............................................................................................................................................3
Analysis...................................................................................................................................................3
Practical application and deployment......................................................................................................9
CONCLUSION.........................................................................................................................................15
REFERENCES..........................................................................................................................................16
Data Analysis and Visualization_2
INTRODUCTION
The study assignment focuses on descriptive analyzation of the COVID-19
infections prevalence data among white people including BAME across most of United
Kingdom. The sampling data based on 50 different white-patients vis a vis BAME patient
population (Kruse, Hug and Vaquerizas, 2020). The review offers an exhaustive compilation of
data to evaluate the subgroups of patients mostly affected by the epidemic of the COVID-19. A
number of theories are configured to pursue to achieve this, that are evaluated on the framework
of necessary statistical techniques.
MAIN BODY
Analysis
Description of data-sets: The data collection is around 50 individuals of various age classes. The
participants ranged from age-group 20 to 50 years. In study data collection reveals the
pervasiveness of infectious disease of different groups of individuals that are white-people and
BAME. The aim of data collections is to specify the ratios of infection frequencies of all groups
of demographic, especially whites & BAME (African American, European and Minority
Cultural and linguistic) citizens. Here, the concise assessment of the details is dealt in the
following direction:
Study of historic results to smarter reiterate the modifications which have taken shape in a
corporation is descriptive evaluation. The existence of a collection of observational data to
deliver comparability is seen in Descriptive Metrics (Katina, Vittert and Bowman, 2020).
Statistics
White
patient BAME
N Valid 50 50
Missing 0 0
Mean 36.180 36.740
Data Analysis and Visualization_3
Median 36.000 34.500
Mode 20.0a 50.0
Std. Deviation 9.4192 9.3171
Variance 88.722 86.809
a. Multiple modes exist. The smallest
value is shown
White patient
Frequency Percent
Valid
Percent
Cumulative
Percent
Valid 20.0 4 8.0 8.0 8.0
22.0 2 4.0 4.0 12.0
25.0 2 4.0 4.0 16.0
26.0 1 2.0 2.0 18.0
27.0 2 4.0 4.0 22.0
28.0 1 2.0 2.0 24.0
29.0 1 2.0 2.0 26.0
30.0 2 4.0 4.0 30.0
32.0 1 2.0 2.0 32.0
33.0 4 8.0 8.0 40.0
34.0 2 4.0 4.0 44.0
35.0 3 6.0 6.0 50.0
37.0 2 4.0 4.0 54.0
38.0 2 4.0 4.0 58.0
40.0 4 8.0 8.0 66.0
42.0 1 2.0 2.0 68.0
43.0 4 8.0 8.0 76.0
44.0 3 6.0 6.0 82.0
Data Analysis and Visualization_4

End of preview

Want to access all the pages? Upload your documents or become a member.

Related Documents
Analysis of Infection Rate of COVID-19 in White and BAME Patients
|16
|2302
|76

Data Analysis and Visualization
|16
|2415
|97

Data Analysis and Visualization
|16
|2397
|97

Importance of quality Frequency Percent Valid Percent Cumulative Percent Valid Peculiar Peculiar Peculiar Peculiar Peculiar Peculiar Peculiar Peculiar Peculiar Peculiar Peculiar Peculiar Peculiar Pecu
|34
|6315
|487

Consumer Decision Making Style Inventory
|34
|6315
|228

Importance of Quality Frequency Percent
|44
|8014
|536