Research Methodology in Tourism Industry
VerifiedAdded on 2022/11/26
|74
|11906
|300
AI Summary
This article discusses the research methodology used in the tourism industry to understand the factors influencing destination choices of university students. It covers topics such as research philosophy, approach, design, strategy, sampling techniques, data collection, and analysis.
Contribute Materials
Your contribution can guide someone’s learning journey. Share your
documents today.

Running head: DISSERTATION
DISSERTATION
Name of the Student
Name of the University
Author Note
DISSERTATION
Name of the Student
Name of the University
Author Note
Secure Best Marks with AI Grader
Need help grading? Try our AI Grader for instant feedback on your assignments.
1DISSERTATION
Chapter 3: Research Methodology
3.1 Overview
The tourism industry can be understood to be functioning on the quantitative data which
is widely available and the related information which then makes it considerably easier to apply
the theoretical frameworks and understand the overall manner in which the practitioners will be
able to arrive at conclusion regarding the data (Alvesson and Sköldberg 2017). The Quantitative
methods can be understood to be a set of processes and related procedures which help in
processing the data and to help in arriving a conclusion from the data which is collected. The
Quantitative method can be understood to be widely accepted and used by the different authors
as present around the globe. The survey experts as present in the given field have found that, the
data collection method pertaining the quantitative method can be understood to be considerably
useful because it contributes essentially towards the overall understanding of the phenomenon as
present in the industry (Barnham 2015). The reason why it is successful is because, it helps in
understanding the customer point of view without placing the researcher’s point of view. Hence,
with respect to the given field of study which aims at investigating the different factors which
have the overall capability in affecting the destination choice of the local University students in
Hong Kong while they are making choices in regard to the overseas holidays. The study will
make use of a questionnaire and therefore, their view will be attained.
3.2 Research outline
The given research chapter can be understood to follow a comprehensive outline whereby
the section will outline the choice of the research philosophy to be made use of, the research
approach, the research design, the research strategy, the Sampling techniques, the manner in
2DISSERTATION
which the data for the research shall be collected adequately and also the overall manner in
which the Data will be analyzed in order to arrive at a viable conclusion.
3.3 Research Philosophy
The research philosophy can be understood to be the primary reason for which a research
is generally undertaken and states the different beliefs as well as the assumptions which are the
base of the paper (Brannen 2017). The data collection and the analysis of the data is based on
the kind of philosophy which is adopted for the paper and hence, identifying the research
philosophy is very crucial. In the given dissertation, the research philosophy which can be
largely adopted for the research can be understood to be the positivist research philosophy. This
indicates that the use of a survey will be made for the paper. The reason why the philosophy is
being used is because, evidence with respect to the collection of the data will be required (Hoy
and Adams 2015). The positivism approach will help in collecting the factual data required for
the scope of the study. This approach will assist in making the study more comprehensive in
nature and the role of the researcher will be limited to the collection and the interpretation of the
data (Bresler and Stake 2017).
Justification of the research philosophy
The reason why the positivist research philosophy has been adopted for the purpose of
the study can be contributed to the fact that it shall be relevantly appropriate to carry out the
quantitative research which has to be conducted in the tourism field result and the different
factors influencing the University students present in Hong Kong to make a decision regarding
the leisure trip destination which is required to be adopted by them.
3DISSERTATION
3.4 Research Approach
The research approach can be understood to be a plan and procedure which consists of
the various assumptions which have to be undertaken in terms of the overall data collection as
well as the data analysis process. It helps in understanding the nature of the research problem
being addressed. The research approach which has been adopted for the purpose of the study can
be understood to be the deductive research approach. In this research approach, the approach will
be based on the aims as well as the testing theories which is usually started with a hypothesis and
then lays emphasis on the causality (Brannen 2017). It is for this reason that the study shall be
primarily inclined towards the quantitative approach. The data to be collected and analyzed will
be based on the hypothesis available. Various frameworks as well as models will be made use of
so as to find the results with respect to the same. This research approach will support the
quantitative analysis as a medium and will assist in ensuring that the Factors affecting the
University student decision can be examined (Hoy and Adams 2015).
Justification of the chosen research approach
The primary reason why the deductive research approach shall be adopted for the purpose
of the study is because, the collection of raw data which will be conducted, and then information
can be deduced from it. Hence, this will assist in deriving information regarding the factors
which influence the different students to make a decision regarding the travelling.
3.5 Research Design
The Research Design can be taken to be a framework of techniques as well as the
methods which are popularly chosen by the researcher in order to ensure that the various
components which are present within the scope of the research can be arranged in a logical
manner and that the research problem is handled effectively (Creswell, and Creswell 2017).
Secure Best Marks with AI Grader
Need help grading? Try our AI Grader for instant feedback on your assignments.
4DISSERTATION
The research design describes the manner in which the methods and the procedures which are
used in analyzing the measures and collecting of the variables can be done in a comprehensive
manner. For the particular study, the research design which shall be adopted for the purpose of
the objective can be understood to be the descriptive research design. In this kind of research
design, the factors influencing the overall decision to choose a place to travel can be determined
adequately. Moreover, the factors present in the workplace can also be decided upon adequately
(Hoy and Adams 2015).
Justification for the chosen research design
The reason why the descriptive research design can be deemed to be appropriate for the
procedure of the research can be understood to be with respect to the fact that, the descriptive
research design will assist in identifying the relationship which exists between the factors which
have an overall impact on the decision making of the young University students who are present.
3.6 Research Strategy
The research strategy can be understood to be the overall step by step plan which is
usually adopted by the organization in order to determine the manner in which the research will
be carried out. In addition to this, it also enables the different researchers to schedule the research
in a manner such that the quality of the research can be maintained accordingly and in addition to
this, the overall research objectives can be achieved accordingly (Kumar 2019). The research
strategy which has been planned to be adopted in the particular case can be stated to be the
Primary Quantitative Strategy. The Primary Quantitative Strategy can be understood to be the
strategy whereby the Data collection is carried out using the Primary technique (Brannen 2017).
This means that the researcher will be collecting the data on his own using various mediums and
the data which is collected shall be deduced and analyzed by using a Quantitative strategy. The
5DISSERTATION
primary reason why such a strategy is suitable is because, in the field of the tourism studies, the
opinion of the different tourists can be considered to be very important and in relation to this, the
measure will assist in finding a solution to the research questions (Bresler and Stake 2017).
Justification for the Research Strategy Adopted
The reason why the research strategy has been adopted can be understood to be because
the study requires the collection of consumer and travelers response based on which the
hypothesis for the study will be undertaken and additionally the objectives can be met with
(Bryman 2017). As the given study aims to find the factors which affect the University student
decision making, it can be considered to be relatively important for the researcher to adopt this
medium as a whole. Moreover, through the Primary approach to the study, the researcher will be
ensuring that, the study is successfully able to outline the factors from the point of view of the
different tourists who are present (Flick 2015). It is through this approach that the researcher
biasness in the field of the study will not be involved and additionally the overall objective can
be attained by the researcher as present.
3.7 Sampling Techniques
The sampling strategy or the technique which is adopted by the researcher can be
understood to be the strategy which the researcher sets forward in the study in order to represent
the population which has been drawn from the sample. The different types of sampling tends to
comprise of the convenience sampling, accidental sampling, purposive sampling, quota sampling
and the cluster sampling (Bresler and Stake 2017). As the quantitative approach has been
adopted as the appropriate method in order to find the different factors which have an impact on
the destination choice which the different local university students in Hong Kong tend to make.
Hence, it is with respect to this the sampling technique which has been adopted for the purpose
6DISSERTATION
of the research can be understood to be the Non probability sampling technique (Creswell, and
Creswell 2017). In this sampling technique, the different participants from the universities will
be given equal chances of getting selected. This will help in adopting the right method for the
research and also assist in seeing to it that, the research will outline the appropriate measures to
influence the decisions (Hoy and Adams 2015). The target population is the student above 18
years of age. The frame of sampling which has been selected is a total of 385 participants which
shall fairly represent the overall University population.
Justification for the Sampling technique
The main reason why the Simple random non probability sampling technique has been
adopted is because it will help in selecting the different participants as present for the purpose of
the research in a random manner which provides all the different University students with an
equal opportunity to be a part of the research and determine the factors which tend to influence
them. Moreover, as the research is based on the University students and their related responses, it
becomes very crucial for the researcher to keep this criteria in mind and be able to select the
sample on that basis itself. This shall help in achieving the research objectives and assist in
determining the overall study factors (Bryman 2017). These students are based in Hong Kong
Universities and the destination is Hong Kong University - Hong Kong Polytechnic University.
The sample size of 385 students has been chosen with a population of 7000000 students.
3.8 Data Collection Techniques
The Data collection process can be understood to be the manner in which the data for the
analysis is usually collected. The Data collection determines the overall medium which has been
adopted for the purpose of the study (Flick 2015). In line of this, it becomes considerably
important for the researcher to ensure that, they align the Data collection techniques with the
Paraphrase This Document
Need a fresh take? Get an instant paraphrase of this document with our AI Paraphraser
7DISSERTATION
overall research objectives and the research questions which have been determined for the
purpose of the study. For the purpose of the paper, the data collection method which has been
adopted can be understood to be the Primary Data collection technique whereby the use of the
survey has been made to collect the responses from the different participants (Creswell, and
Creswell 2017). This provides a firsthand view of the opinions of the participants and also
ensures that, the research aim is fulfilled accordingly. For the purpose of the data collection, the
questionnaire was broken down into several sections whereby aspects related to the
demographics of the research, travel patterns, factors influencing the respondent decision and
elements of the tourist destination have been stated. The use of the Likert scale has been adopted
in order to collect the responses of the different respondents (Kumar 2019). The Likert scale
have had responses from 1 to 5 and each has a specific attribute and importance. It is through the
quantitative data analysis method that the data which has been collected will be analyzed
accordingly (Bresler and Stake 2017).
Justification for the Data collection Method
The reason why the Primary method of Data collection has been taken into consideration
for the purpose of the research is to determine the manner in which the different factors affecting
the decision of the different university students is affected and changed. Hence, it is with respect
to this that the primary method of Data collection can be useful because it will help in
understanding the overall viewpoint of the different university students who are the primary
target for the analysis which will be carried out effectively.
3.9 Data analysis techniques
The Data analysis technique can be understood to be the technique which will be used in
analyzing the data which has been collected in the prior step. It is in relation to this that, the
8DISSERTATION
overall outcomes and the findings of the study will be based on. Hence, the Data analysis
technique which will be adopted for the purpose of the research can be understood to be the
Quantitative data analysis technique. In the quantitative data analysis technique, it has to be
understood that, the data which will be collected for the research shall be analyzed by making
use of the different Statistical tools which are present with respect to the study (Kumar 2019).
The different statistical tools will be carried out by making use of the SPSS as a medium and it is
in relation to this that, the statistical tools of Correlation Analysis, Regression analysis and other
such tools will be made use of.
Justification for the Data analysis adopted
The reason why the Quantitative Data analysis has been adopted for the purpose of the
study is because, it assists in ensuring that, and overall study can be carried out adequately. In
addition to this, it will help in understanding the weightage of each factors on the overall
decision making which is adopted by them. The correlation and regression analysis will assist in
ensuring that, the relationship which exists between the various variables can be determined
accordingly. The SPSS software can be understood to be a comprehensive software which can be
applied in the field of research analysis. It is with the help of the SPSS software, that the
regression and the correlation analysis have been carried out in the research paper.
3.10 Ethical considerations
All researchers are required to follow a strict guideline which ensures that all
requirements have been met with ethically and that the personal rights as well as the overall
space of the different participants is maintained. In line of this, the information which is obtained
from the secondary sources is referenced and those obtained from the primary sources are
authentic in nature. The name and other private information relating to the different participants
9DISSERTATION
is kept private. Moreover, any opinion which is expressed regarding the firm and its operations
where the employee is involved needs to be set out accordingly and no data leak should take
place (Kumar 2019). The environment of the data collection and the survey needs to be set in a
manner such that, the respondents feel comfortable. The prior consent of the respondents is
required to be collected accordingly. No discrimination with respect to the participants on the
basis of the age, gender, income and related aspects has to be made.
3.11 Foreseen limitations
The limitations which exist with the study can be understood to be relating to the fact that
the data collection procedure is a time consuming one because of the fact that the opinions and
views of 285 respondents have to be collected accordingly. Moreover, the prior permissions and
related aspects which need to be considered for the data collection also needs to be determined
accordingly. Therefore, to reduce the limitations, a few statistical methods will be adopted so
that the researcher is able to save on the costs and the time involved.
3.12 Summary
The given chapter based on the Research Methodology outlined the various research
techniques which have been adopted for the study and the justification for the use of them have
also been outlined.
Secure Best Marks with AI Grader
Need help grading? Try our AI Grader for instant feedback on your assignments.
10DISSERTATION
Chapter 4: Findings , Analysis and Discussion
4.0 Overview
The Data analysis tends to form an integral part of any research study which tends to take
place and goes a long way in assisting the researcher to find the impact of the Independent
Variable on the Dependent Variable. Hence, in regard to this, it can be understood that the
Analysis chapter forms a crucial part of the study and assists the researcher in undertaking the
decisions regarding the data reliability and contributed towards understanding the results of the
study. Hence, the section will be divided into various parts which will range from Analysis,
Findings and Discussion. The first section will analyze the statistical and descriptive results
which have been retrieved from the data and additionally, this will be followed by the chapter on
Findings which shall assist in understanding the overall outcome of the study which was
undertaken. This will then be followed by the Discussion on the data which shall assist in
aligning the research objectives with the outcomes of the study.
4.1 Analysis
The analysis is the most integral part of the study which is generally undertaken which
tends to represent the results of the statistical analysis which was performed on the data. In
relation to this, the overall outcomes of the survey needs to be represented in a comprehensive
manner as it contributes towards the understanding of the result of the entire study outcome. The
data was collected from 385 respondents and therefore, in this section the Descriptive Statistics
and the inferential statistics will be the primary medium of the study. The Descriptive Statistics
will present the overall findings by making use of the charts and graphs whereas in the inferential
statistics, the medium of the Correlation Analysis and the Regression Analysis will be adopted as
the medium of study.
11DISSERTATION
4.1.1 Descriptive Statistics
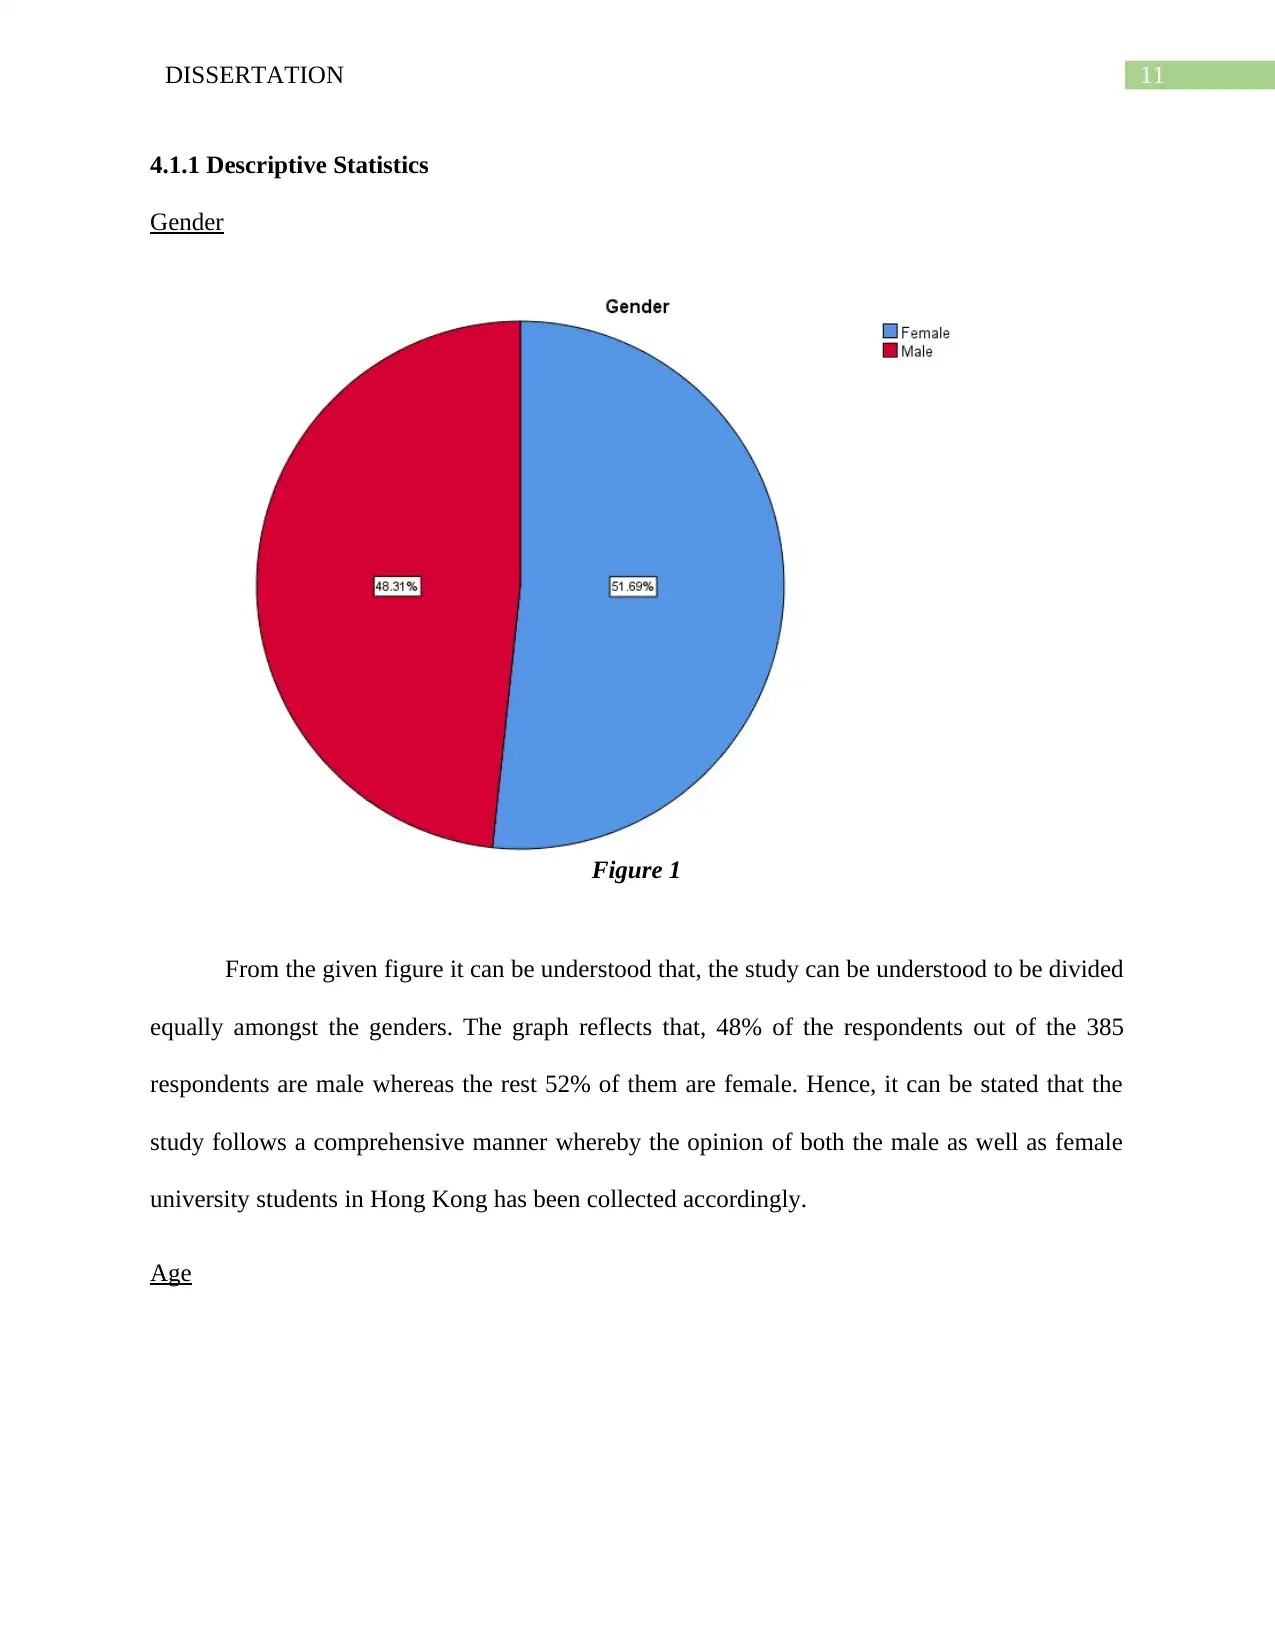
Gender
Figure 1
From the given figure it can be understood that, the study can be understood to be divided
equally amongst the genders. The graph reflects that, 48% of the respondents out of the 385
respondents are male whereas the rest 52% of them are female. Hence, it can be stated that the
study follows a comprehensive manner whereby the opinion of both the male as well as female
university students in Hong Kong has been collected accordingly.
Age
4.1.1 Descriptive Statistics
Gender
Figure 1
From the given figure it can be understood that, the study can be understood to be divided
equally amongst the genders. The graph reflects that, 48% of the respondents out of the 385
respondents are male whereas the rest 52% of them are female. Hence, it can be stated that the
study follows a comprehensive manner whereby the opinion of both the male as well as female
university students in Hong Kong has been collected accordingly.
Age
12DISSERTATION
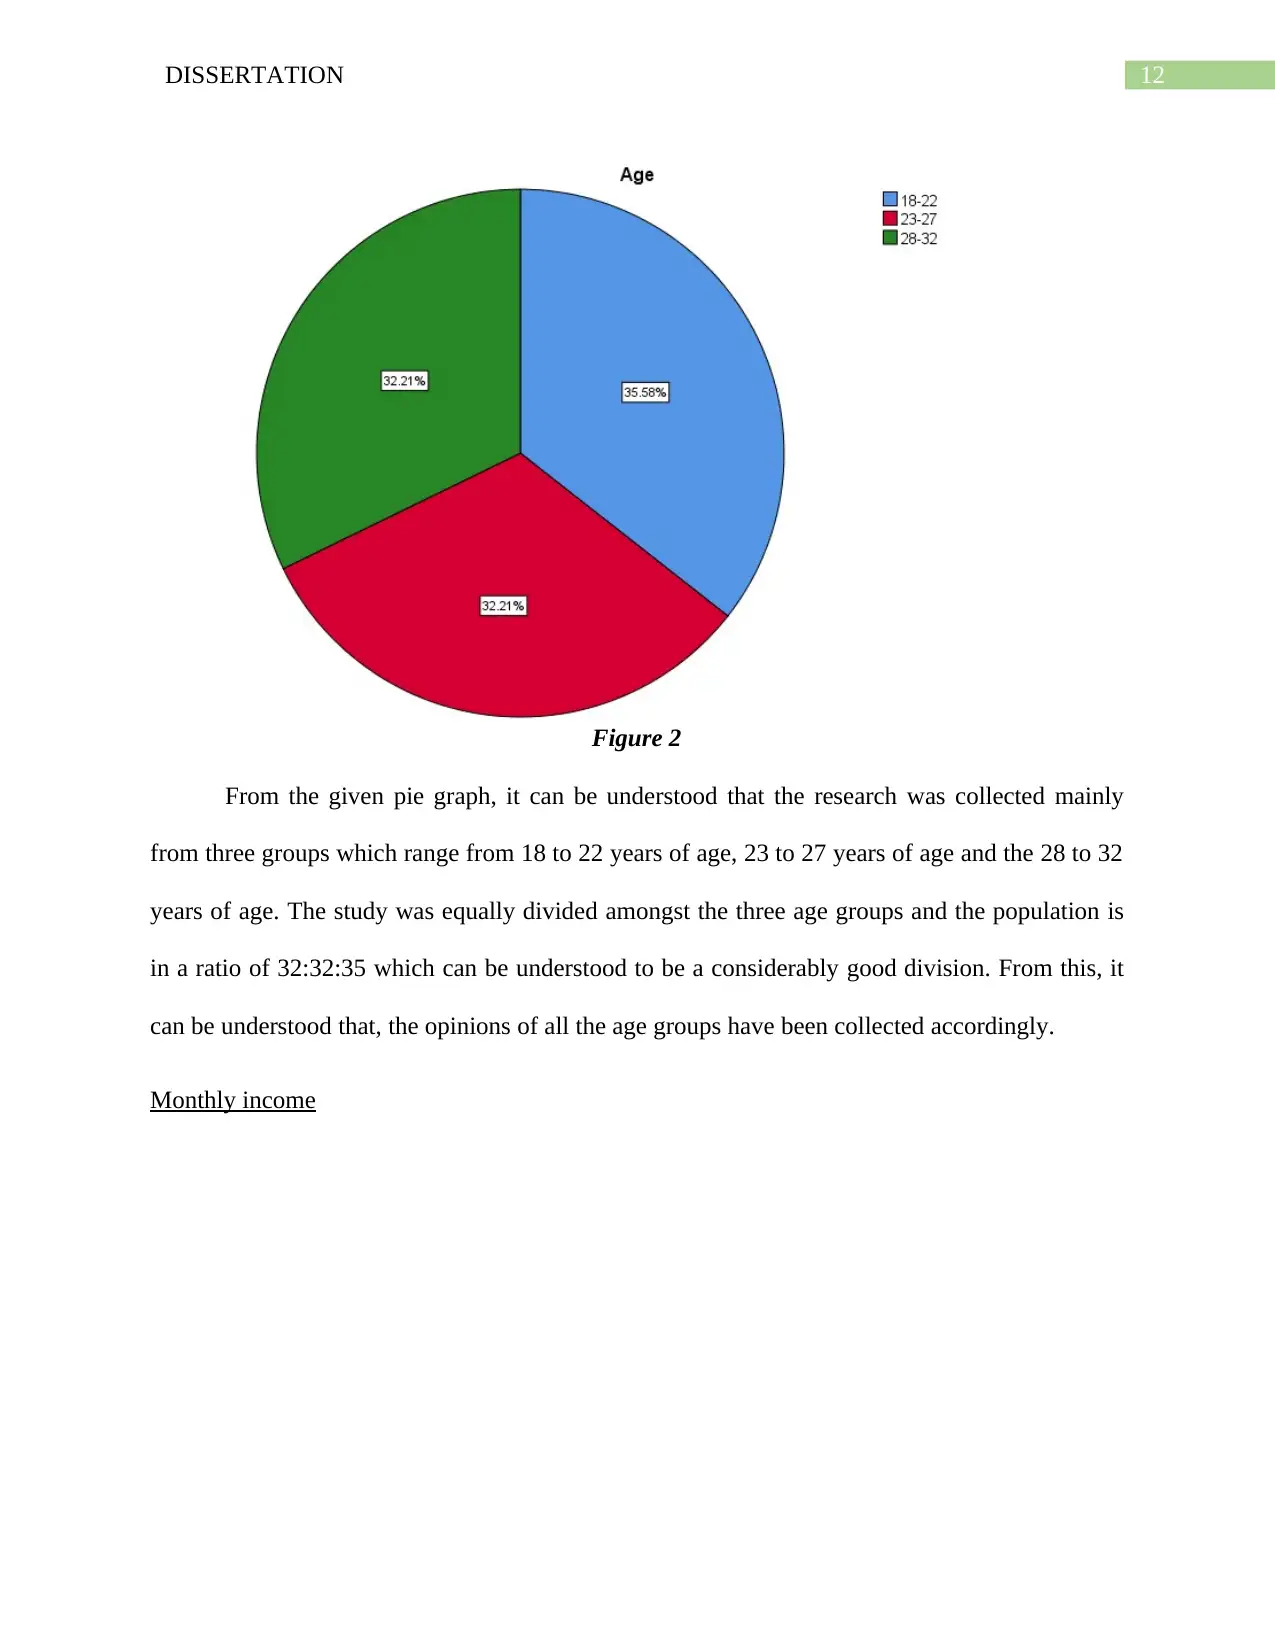
Figure 2
From the given pie graph, it can be understood that the research was collected mainly
from three groups which range from 18 to 22 years of age, 23 to 27 years of age and the 28 to 32
years of age. The study was equally divided amongst the three age groups and the population is
in a ratio of 32:32:35 which can be understood to be a considerably good division. From this, it
can be understood that, the opinions of all the age groups have been collected accordingly.
Monthly income
Paraphrase This Document
Need a fresh take? Get an instant paraphrase of this document with our AI Paraphraser
13DISSERTATION
42%
15%
11%0%
0%
21%
10%
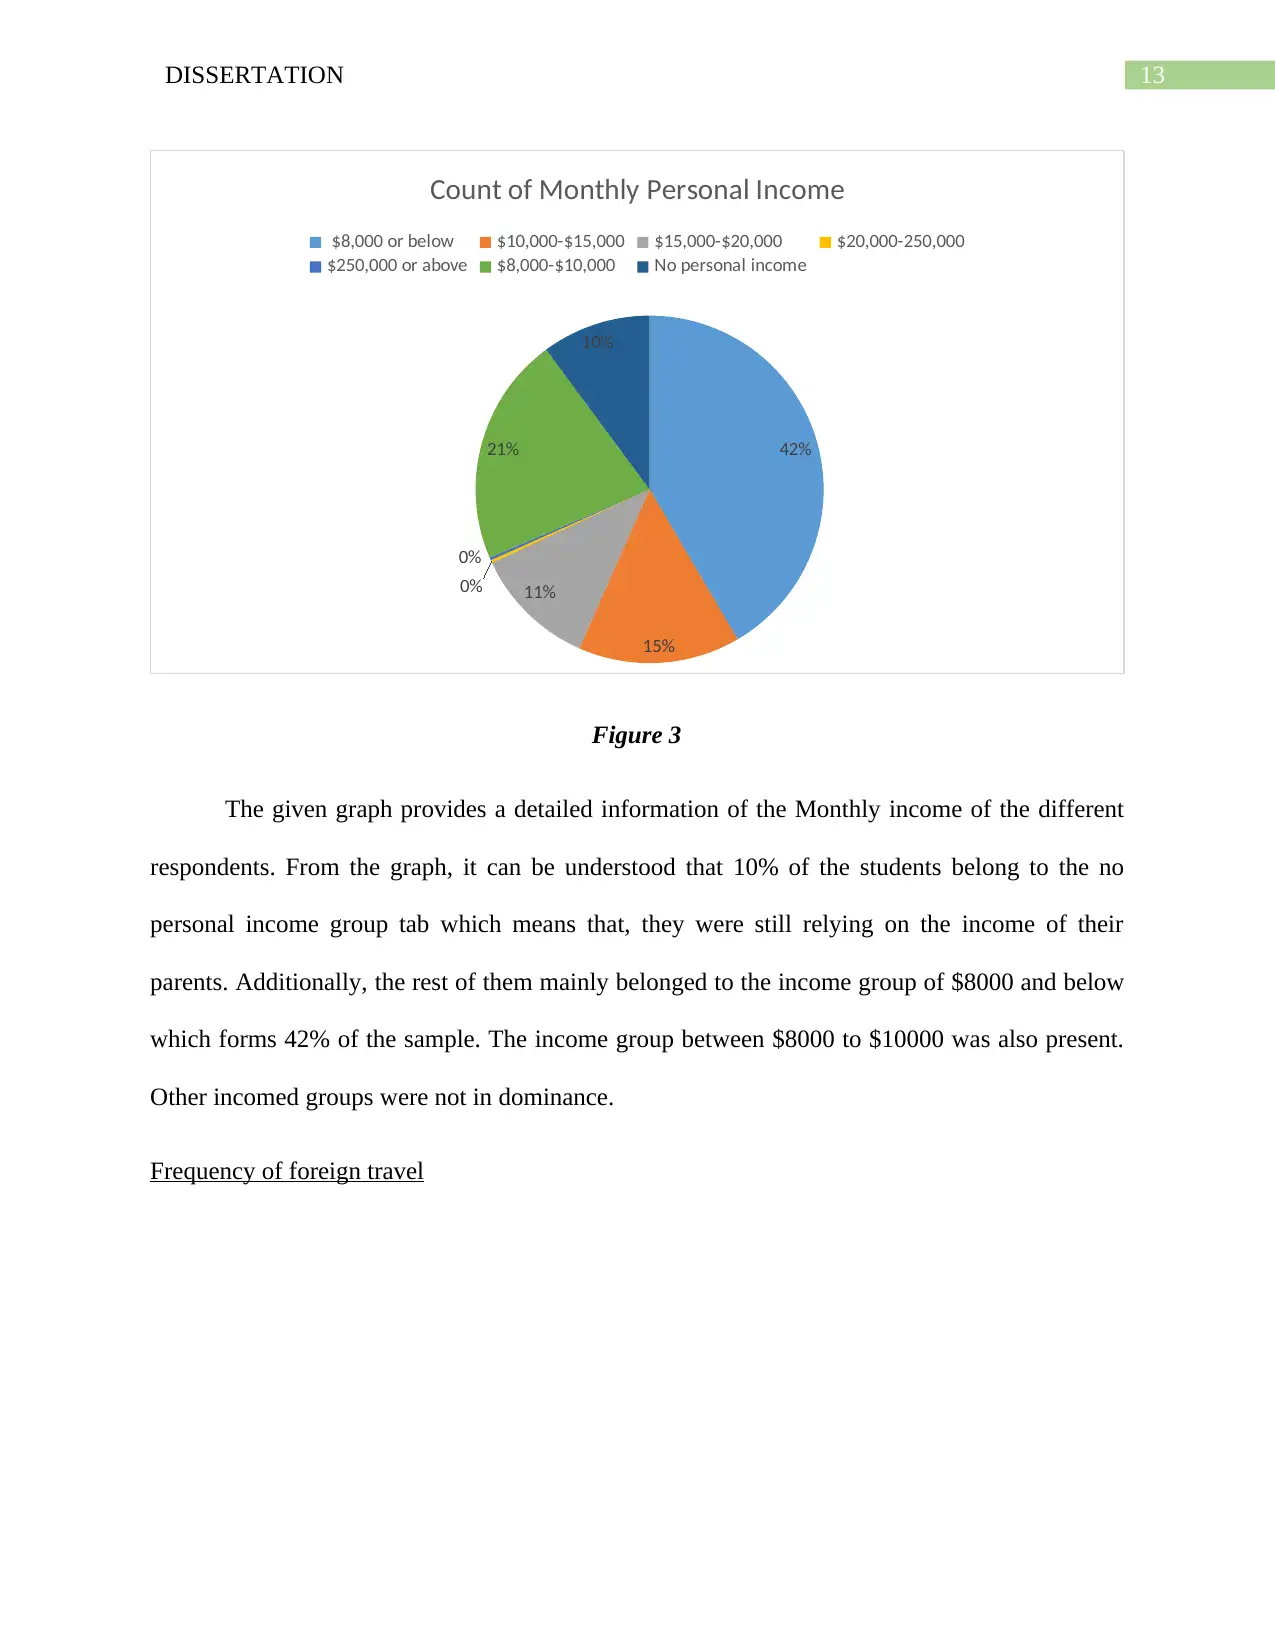
Count of Monthly Personal Income
$8,000 or below $10,000-$15,000 $15,000-$20,000 $20,000-250,000
$250,000 or above $8,000-$10,000 No personal income
Figure 3
The given graph provides a detailed information of the Monthly income of the different
respondents. From the graph, it can be understood that 10% of the students belong to the no
personal income group tab which means that, they were still relying on the income of their
parents. Additionally, the rest of them mainly belonged to the income group of $8000 and below
which forms 42% of the sample. The income group between $8000 to $10000 was also present.
Other incomed groups were not in dominance.
Frequency of foreign travel
42%
15%
11%0%
0%
21%
10%
Count of Monthly Personal Income
$8,000 or below $10,000-$15,000 $15,000-$20,000 $20,000-250,000
$250,000 or above $8,000-$10,000 No personal income
Figure 3
The given graph provides a detailed information of the Monthly income of the different
respondents. From the graph, it can be understood that 10% of the students belong to the no
personal income group tab which means that, they were still relying on the income of their
parents. Additionally, the rest of them mainly belonged to the income group of $8000 and below
which forms 42% of the sample. The income group between $8000 to $10000 was also present.
Other incomed groups were not in dominance.
Frequency of foreign travel

14DISSERTATION
Figure 4
From the given graph, information regarding the Frequency of the Foreign Travel can be
gathered and from the pie graph it can be seen that the frequency of their travel can be
understood to be equally divided whereby 22% of the sample travels at least once a month,
whereby 25% of them travel few times in one year. Additionally, a majority of them which
formed up to 31% of the sample travelled once in three years whereas 21% of the population
travelled even less frequently than that. Hence, the opinions of all the different types of travelers
can be understood to have been taken.
Medium of planning the trip
15DISSERTATION
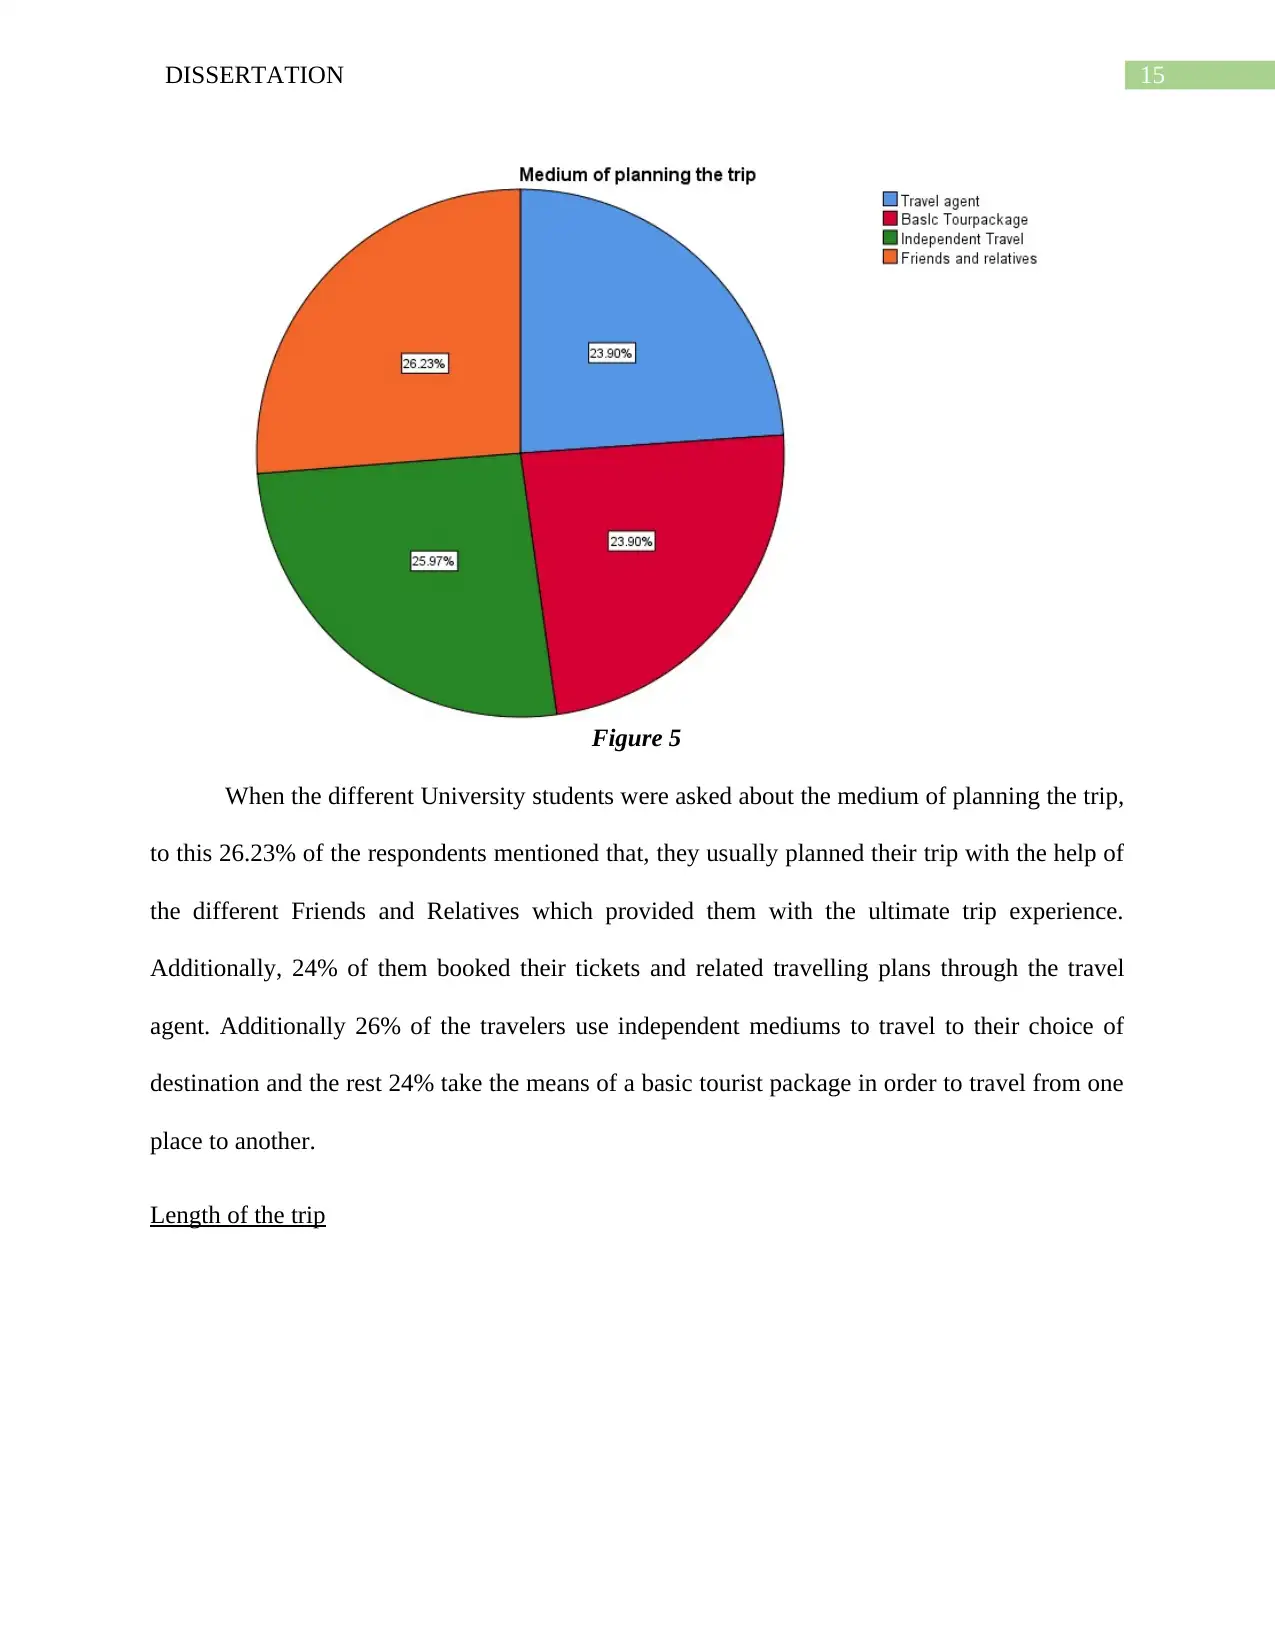
Figure 5
When the different University students were asked about the medium of planning the trip,
to this 26.23% of the respondents mentioned that, they usually planned their trip with the help of
the different Friends and Relatives which provided them with the ultimate trip experience.
Additionally, 24% of them booked their tickets and related travelling plans through the travel
agent. Additionally 26% of the travelers use independent mediums to travel to their choice of
destination and the rest 24% take the means of a basic tourist package in order to travel from one
place to another.
Length of the trip
Secure Best Marks with AI Grader
Need help grading? Try our AI Grader for instant feedback on your assignments.
16DISSERTATION
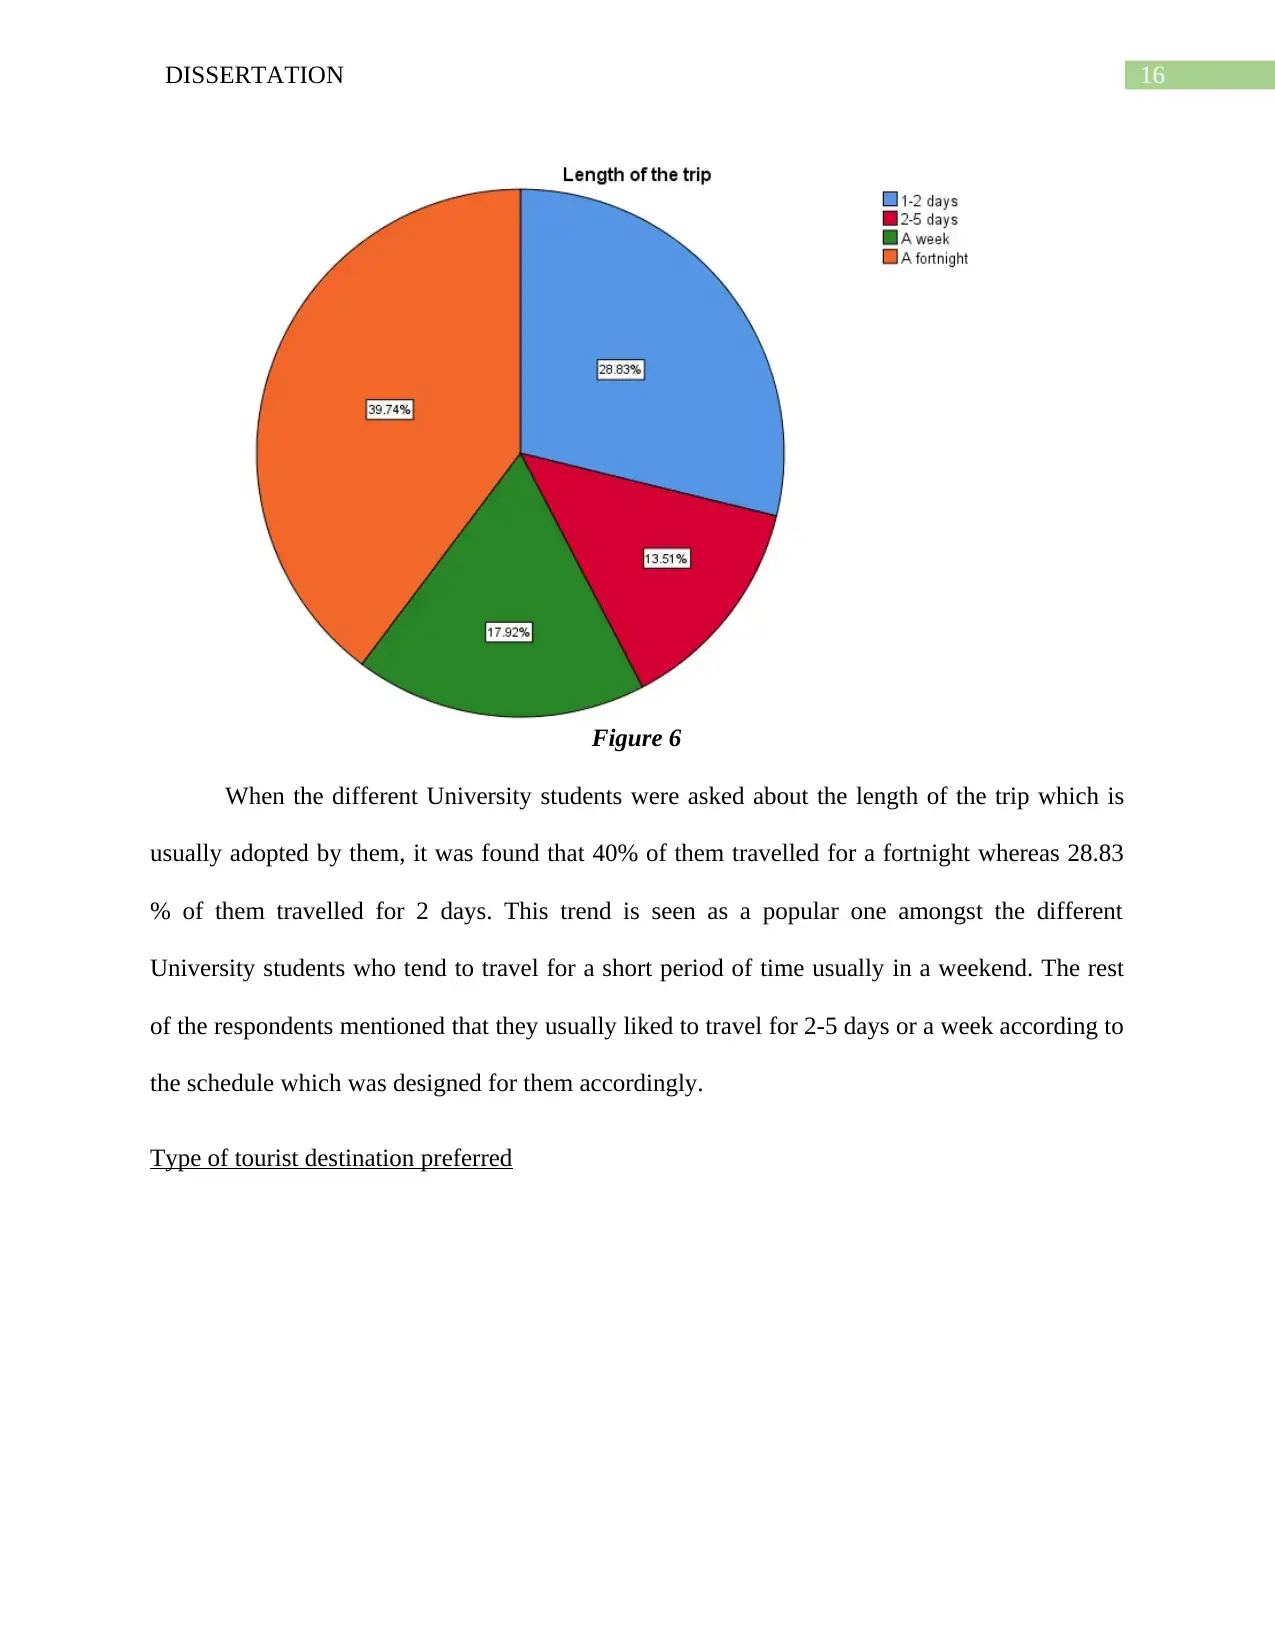
Figure 6
When the different University students were asked about the length of the trip which is
usually adopted by them, it was found that 40% of them travelled for a fortnight whereas 28.83
% of them travelled for 2 days. This trend is seen as a popular one amongst the different
University students who tend to travel for a short period of time usually in a weekend. The rest
of the respondents mentioned that they usually liked to travel for 2-5 days or a week according to
the schedule which was designed for them accordingly.
Type of tourist destination preferred
17DISSERTATION
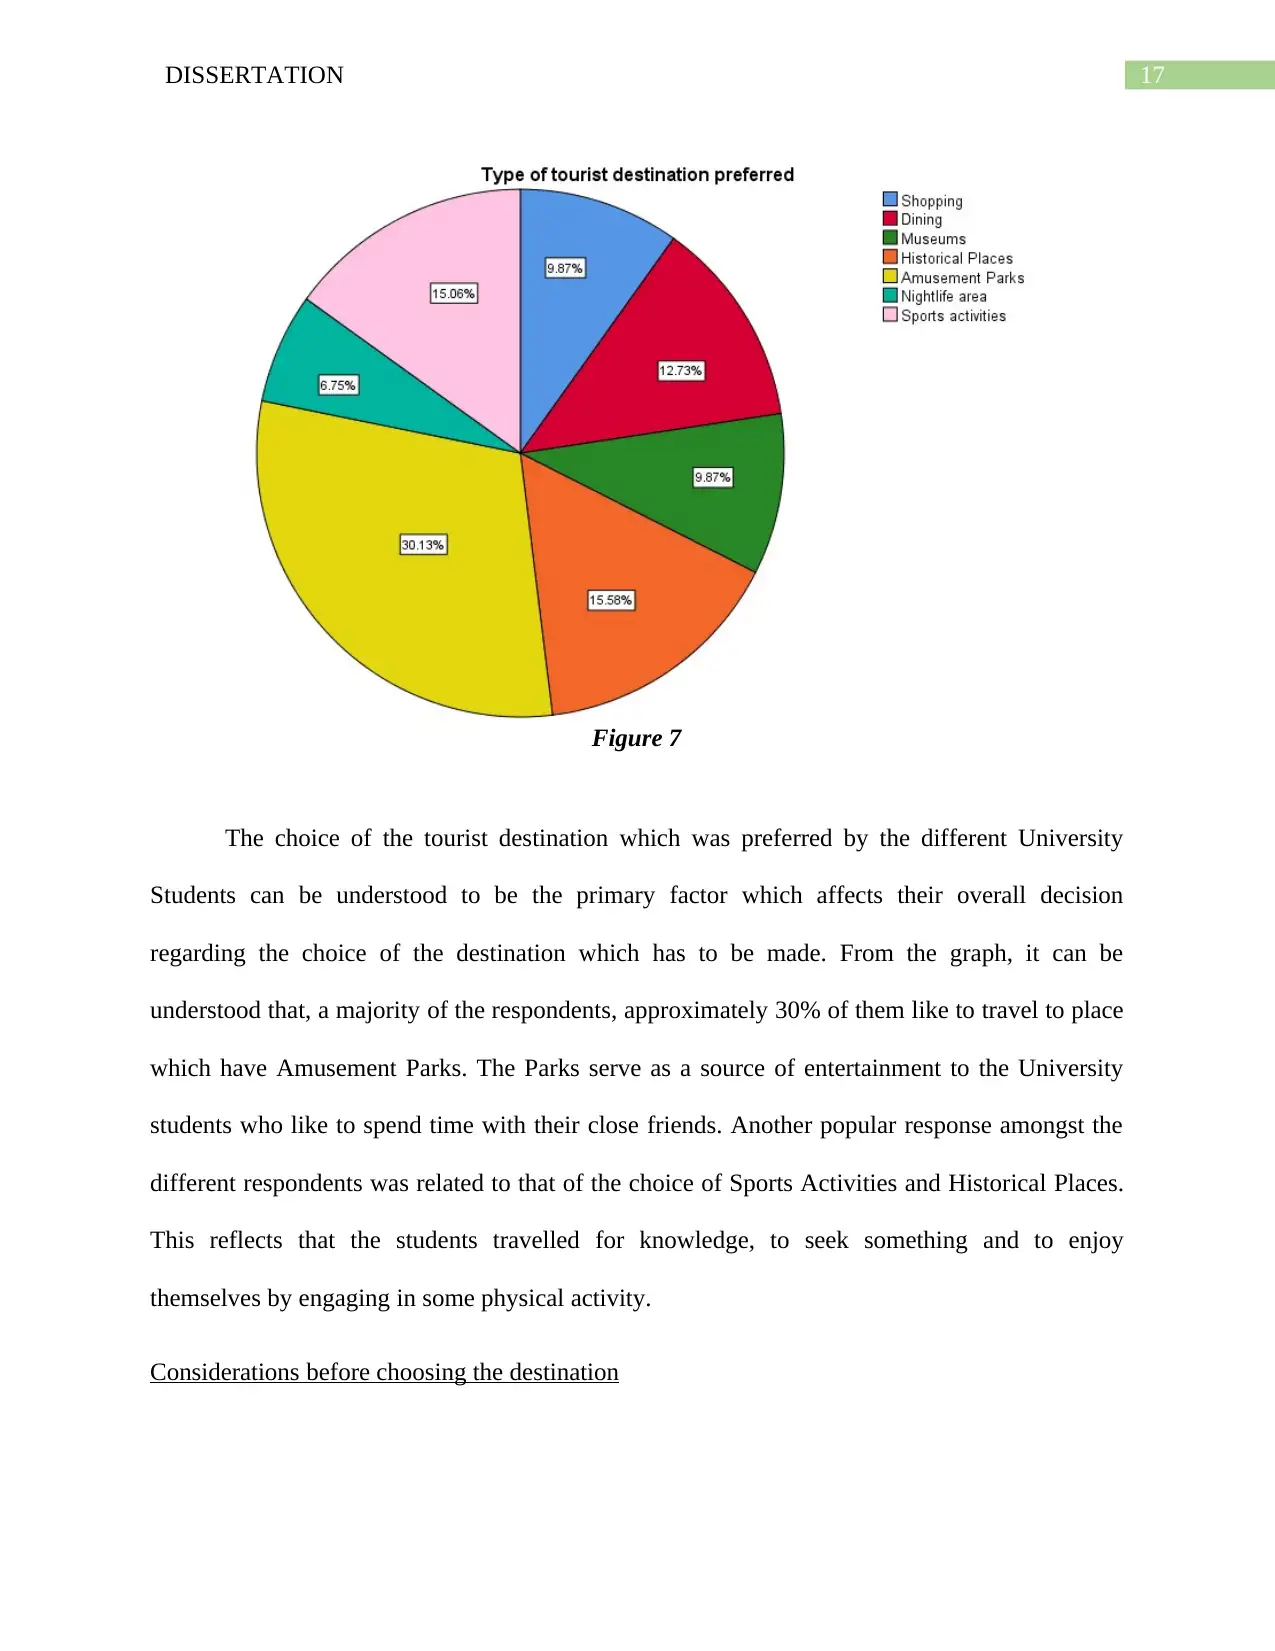
Figure 7
The choice of the tourist destination which was preferred by the different University
Students can be understood to be the primary factor which affects their overall decision
regarding the choice of the destination which has to be made. From the graph, it can be
understood that, a majority of the respondents, approximately 30% of them like to travel to place
which have Amusement Parks. The Parks serve as a source of entertainment to the University
students who like to spend time with their close friends. Another popular response amongst the
different respondents was related to that of the choice of Sports Activities and Historical Places.
This reflects that the students travelled for knowledge, to seek something and to enjoy
themselves by engaging in some physical activity.
Considerations before choosing the destination
18DISSERTATION
Figure 7
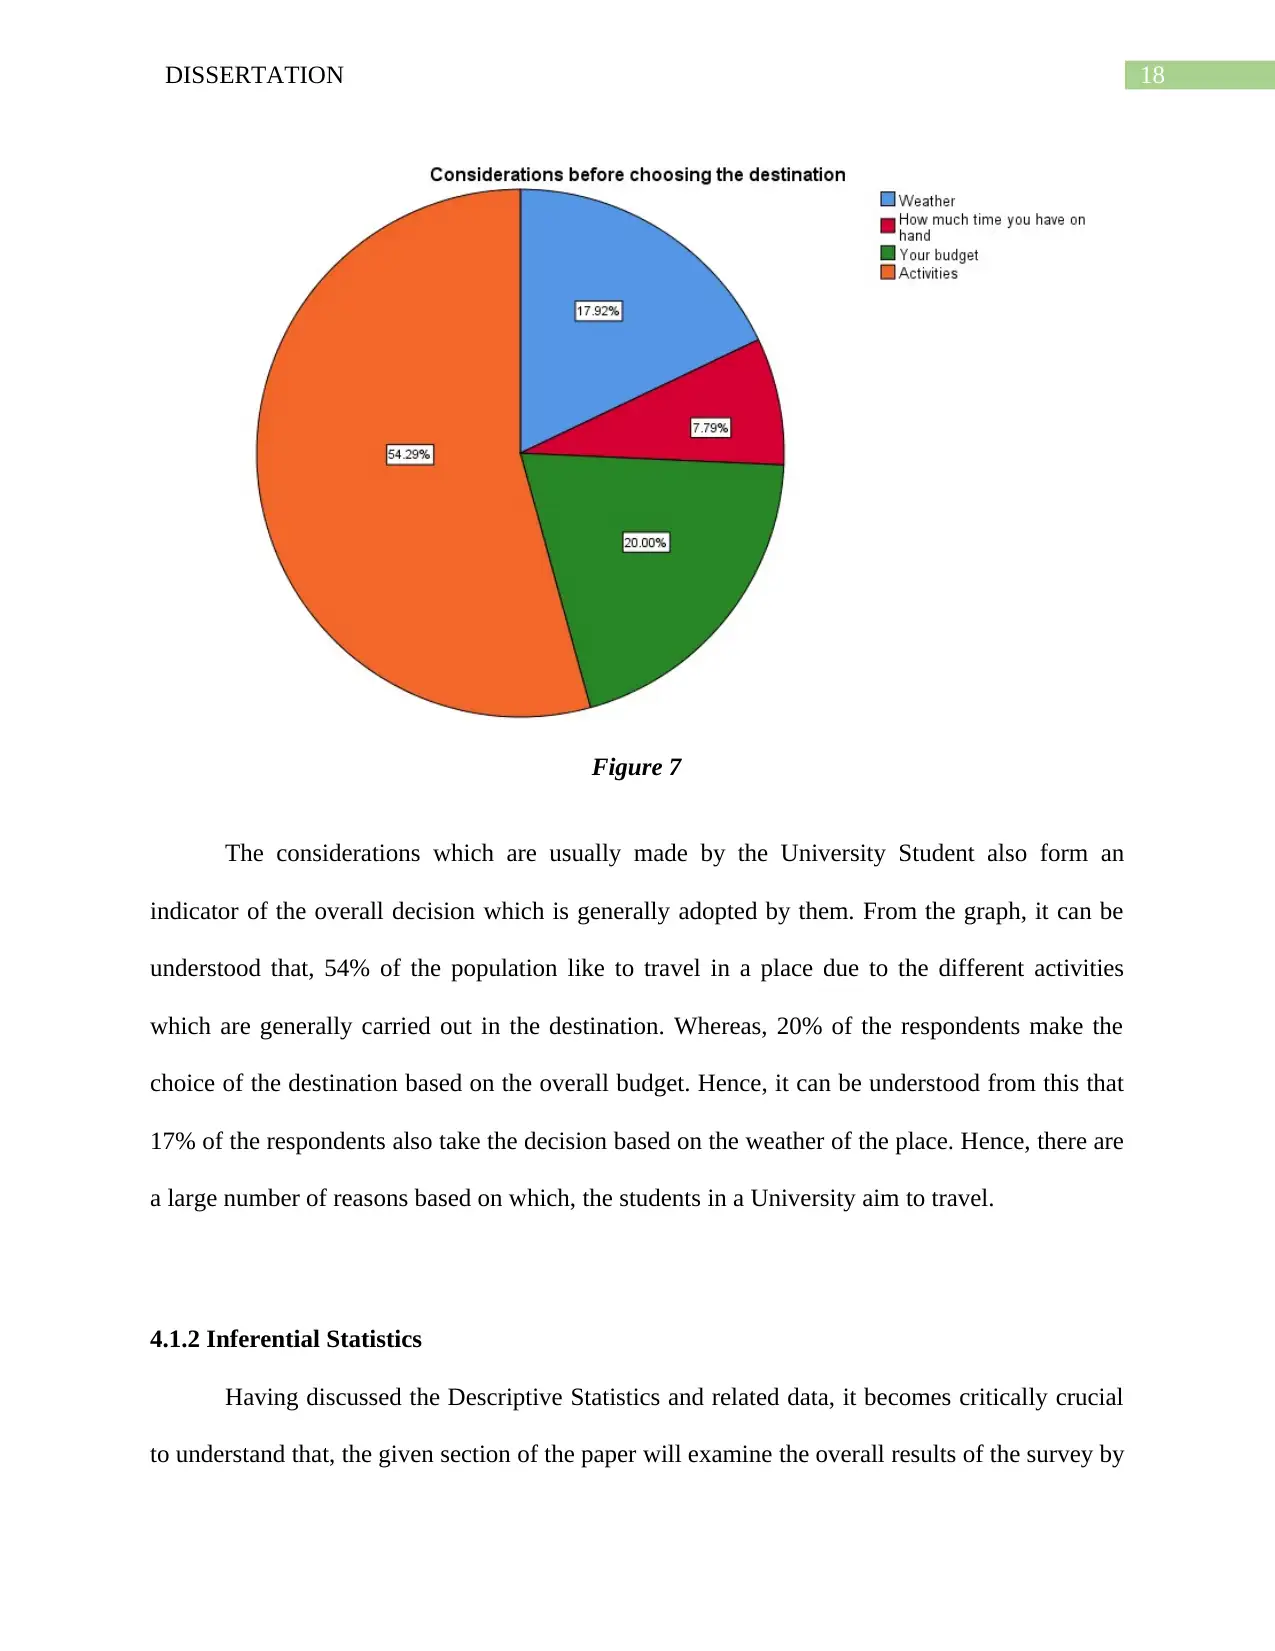
The considerations which are usually made by the University Student also form an
indicator of the overall decision which is generally adopted by them. From the graph, it can be
understood that, 54% of the population like to travel in a place due to the different activities
which are generally carried out in the destination. Whereas, 20% of the respondents make the
choice of the destination based on the overall budget. Hence, it can be understood from this that
17% of the respondents also take the decision based on the weather of the place. Hence, there are
a large number of reasons based on which, the students in a University aim to travel.
4.1.2 Inferential Statistics
Having discussed the Descriptive Statistics and related data, it becomes critically crucial
to understand that, the given section of the paper will examine the overall results of the survey by
Figure 7
The considerations which are usually made by the University Student also form an
indicator of the overall decision which is generally adopted by them. From the graph, it can be
understood that, 54% of the population like to travel in a place due to the different activities
which are generally carried out in the destination. Whereas, 20% of the respondents make the
choice of the destination based on the overall budget. Hence, it can be understood from this that
17% of the respondents also take the decision based on the weather of the place. Hence, there are
a large number of reasons based on which, the students in a University aim to travel.
4.1.2 Inferential Statistics
Having discussed the Descriptive Statistics and related data, it becomes critically crucial
to understand that, the given section of the paper will examine the overall results of the survey by
Paraphrase This Document
Need a fresh take? Get an instant paraphrase of this document with our AI Paraphraser
19DISSERTATION
making use of the medium of Regression Analysis and the Correlation Analysis. The correlation
and regression analysis can be taken to be the statistical tools which are essentially required to
analyze the impact of the Independent variable on the Dependent variable. The aim of the study
is to examine the impact of the University Student Characteristics on the Decision making which
they undertake regarding the choice of the destination.
Correlation Analysis
The correlation analysis can be taken to be a statistical technique which is made use of in
order to determine the overall relationship which exists between two variables and understanding
the manner in which these variables are connected to one another (Ledford and Gast 2018). The
range of correlation relationship is generally understood to be lying between -1 to 1 and this
tends to highlight the overall values of the correlation between the two variables. In case the
value of the correlation lies between 0 to -1 then in such a case, there exists a negative
association between the different variables whereas, if the value is between 0 to +1 then in such a
case, there exists a positive correlation between the variables. In such a case, the value 0 reflects
that there does not exist any relationship between the dependent and the independent variable. In
case the value of the correlation is above 0.7 then there exists a strong and positive correlation
between the variables and the impact of the independent variable on the dependent variable can
also be understood to be considerably high. Hence, in the following sections, the correlation
between the different variables of the Factors influencing consumer choice and the variables of
the Traveler characteristics shall be tested and presented.
Correlation among the variables of the Independent Variable- Characteristics of the University
Student Travelers
20DISSERTATION
Table 1
Correlations
SpendingAttitud
e
Expectationsandattitud
es
TravelMod
e
TravelMotivatio
n
Demographic
s
SpendingAttitude Pearson
Correlatio
n
1 .442** .180** .346** .512**
Sig. (2-
tailed)
.000 .000 .000 .000
N 385 385 385 385 385
Expectationsandattitud
es
Pearson
Correlatio
n
.442** 1 .436** .055 .805**
Sig. (2-
tailed)
.000 .000 .283 .000
N 385 385 385 385 385
TravelMode Pearson
Correlatio
n
.180** .436** 1 .161** .520**
Sig. (2-
tailed)
.000 .000 .002 .000
N 385 385 385 385 385
TravelMotivation Pearson
Correlatio
n
.346** .055 .161** 1 .040
Sig. (2-
tailed)
.000 .283 .002 .432
N 385 385 385 385 385
Demographics Pearson
Correlatio
n
.512** .805** .520** .040 1
Sig. (2-
tailed)
.000 .000 .000 .432
N 385 385 385 385 385
**. Correlation is significant at the 0.01 level (2-tailed).
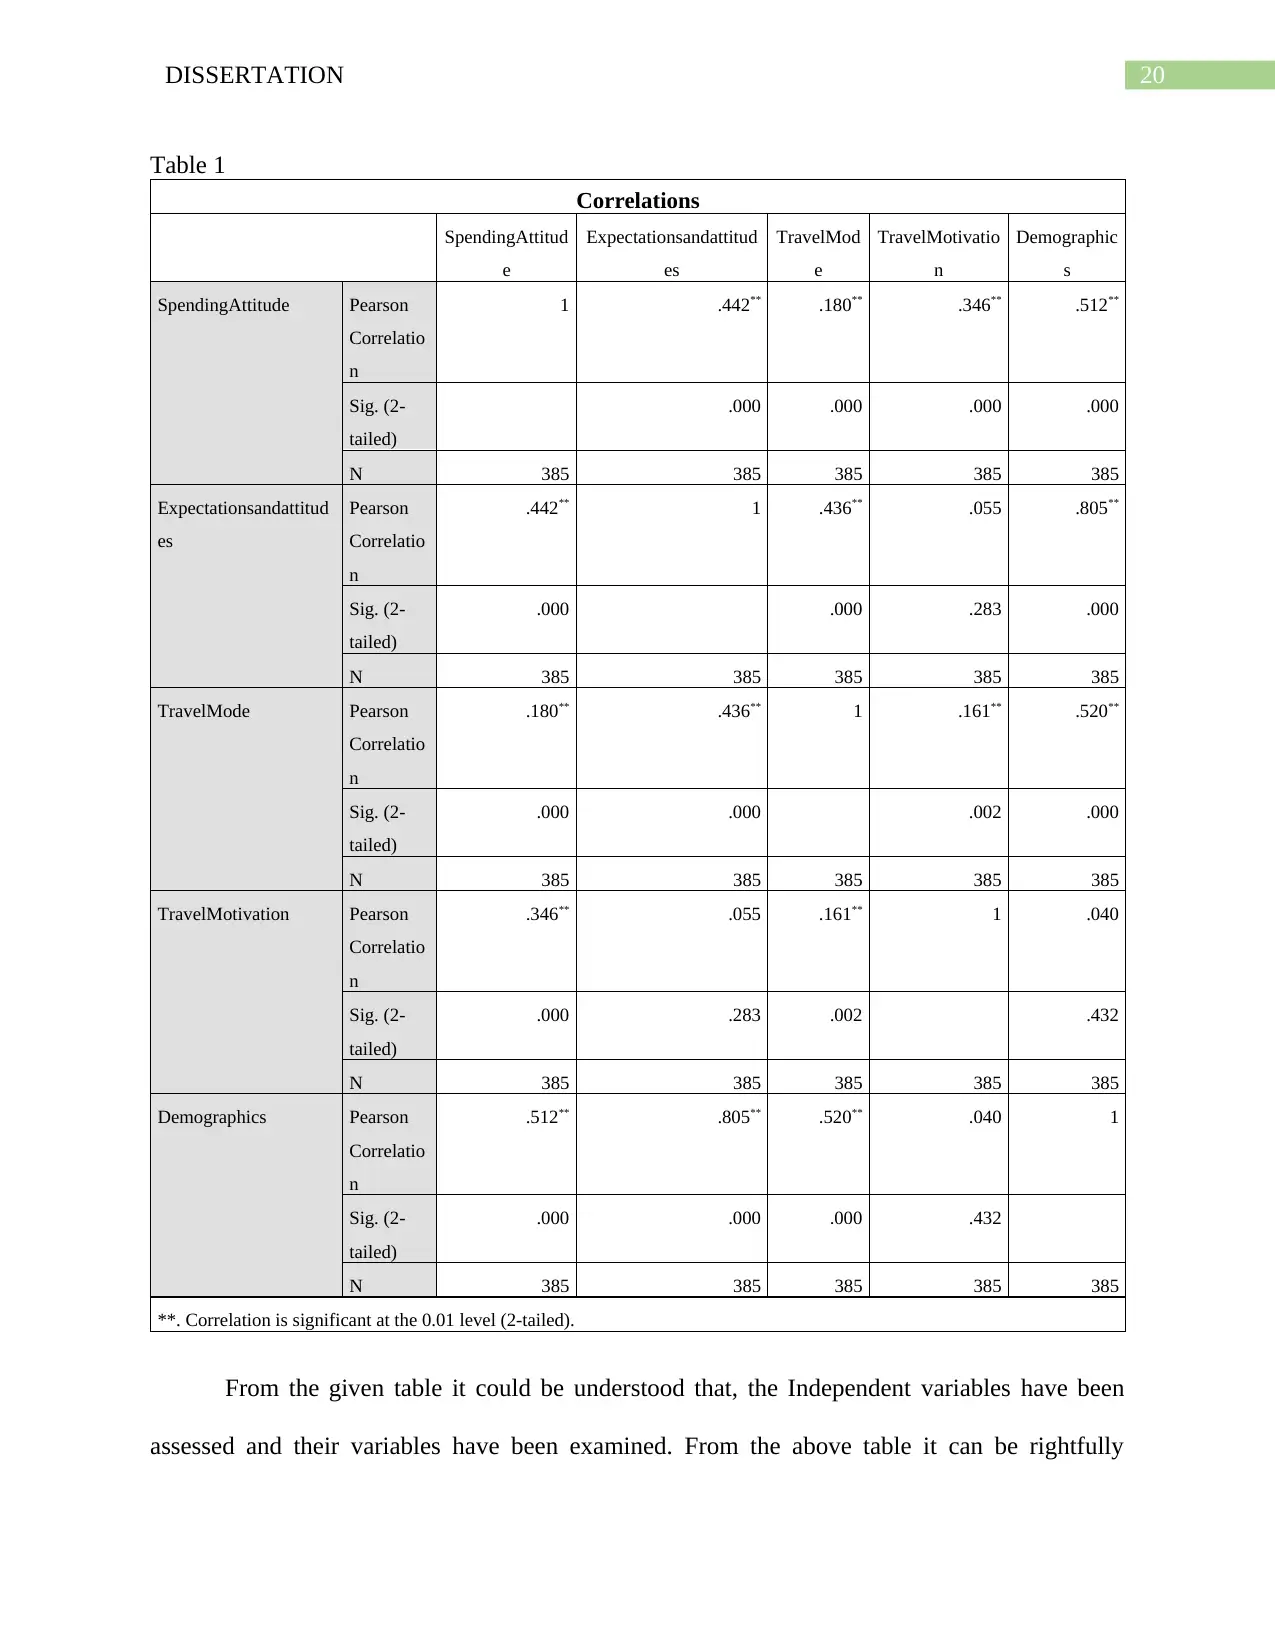
From the given table it could be understood that, the Independent variables have been
assessed and their variables have been examined. From the above table it can be rightfully
Table 1
Correlations
SpendingAttitud
e
Expectationsandattitud
es
TravelMod
e
TravelMotivatio
n
Demographic
s
SpendingAttitude Pearson
Correlatio
n
1 .442** .180** .346** .512**
Sig. (2-
tailed)
.000 .000 .000 .000
N 385 385 385 385 385
Expectationsandattitud
es
Pearson
Correlatio
n
.442** 1 .436** .055 .805**
Sig. (2-
tailed)
.000 .000 .283 .000
N 385 385 385 385 385
TravelMode Pearson
Correlatio
n
.180** .436** 1 .161** .520**
Sig. (2-
tailed)
.000 .000 .002 .000
N 385 385 385 385 385
TravelMotivation Pearson
Correlatio
n
.346** .055 .161** 1 .040
Sig. (2-
tailed)
.000 .283 .002 .432
N 385 385 385 385 385
Demographics Pearson
Correlatio
n
.512** .805** .520** .040 1
Sig. (2-
tailed)
.000 .000 .000 .432
N 385 385 385 385 385
**. Correlation is significant at the 0.01 level (2-tailed).
From the given table it could be understood that, the Independent variables have been
assessed and their variables have been examined. From the above table it can be rightfully
21DISSERTATION
understood that, the Correlation between all the variables within the Independent aspect can be
understood to be positive in nature. Amongst the chosen group of variables, the correlation
between the Demographics of the students and the Attitudes of the university students can be
understood to be very high with a coefficient of 0.8. From this, it can be understood that, the
Attitudes between the University students are greatly affected by the overall Demographics of
the University Students who are present. The lowest correlation coefficient was observed
between the Demographics of the University Student and the overall Travel motivations. In line
of this, it can be rightfully understood that, there does not exist a strong correlation between
Travel motivations of the Student and the University Student. All the different variables have a
moderate correlation between one another.
Correlation among the variables of the Dependent Variable- the factors affecting consumer
choice
Table 2
Correlations
Safety
Cultur
e
&
;
Histor
y
Accommodatio
n
Ease of
transportatio
n Food
Weathe
r
Cleanlines
s
Language
s
Budge
t
Safety Pearson
Correlatio
n
1 1.000*
*
.224** .044 -.012 .224** .044 -.012 .044
Sig. (2-
tailed)
.000 .000 .389 .815 .000 .389 .815 .389
N 385 385 385 385 385 385 385 385 385
Culture &
History
Pearson
Correlatio
n
1.000*
*
1 .224** .044 -.012 .224** .044 -.012 .044
Secure Best Marks with AI Grader
Need help grading? Try our AI Grader for instant feedback on your assignments.
22DISSERTATION
Sig. (2-
tailed)
.000 .000 .389 .815 .000 .389 .815 .389
N 385 385 385 385 385 385 385 385 385
Accommodatio
n
Pearson
Correlatio
n
.224** .224** 1 -.169** .121* 1.000** -.169** .121* -.169**
Sig. (2-
tailed)
.000 .000 .001 .018 .000 .001 .018 .001
N 385 385 385 385 385 385 385 385 385
Ease of
transportation
Pearson
Correlatio
n
.044 .044 -.169** 1 -.255** -.169** 1.000** -.255** 1.000*
*
Sig. (2-
tailed)
.389 .389 .001 .000 .001 .000 .000 .000
N 385 385 385 385 385 385 385 385 385
Food Pearson
Correlatio
n
-.012 -.012 .121* -.255** 1 .121* -.255** 1.000** -.255**
Sig. (2-
tailed)
.815 .815 .018 .000 .018 .000 .000 .000
N 385 385 385 385 385 385 385 385 385
Weather Pearson
Correlatio
n
.224** .224** 1.000** -.169** .121* 1 -.169** .121* -.169**
Sig. (2-
tailed)
.000 .000 .000 .001 .018 .001 .018 .001
N 385 385 385 385 385 385 385 385 385
Cleanliness Pearson
Correlatio
n
.044 .044 -.169** 1.000** -.255** -.169** 1 -.255** 1.000*
*
Sig. (2-
tailed)
.389 .389 .001 .000 .000 .001 .000 .000
N 385 385 385 385 385 385 385 385 385
Languages Pearson
Correlatio
n
-.012 -.012 .121* -.255** 1.000*
*
.1* -.255** 1 -.255**
Sig. (2-
tailed)
.815 .815 .018 .000 .000 .018 .000 .000
N 385 385 385 385 385 385 385 385 385
Sig. (2-
tailed)
.000 .000 .389 .815 .000 .389 .815 .389
N 385 385 385 385 385 385 385 385 385
Accommodatio
n
Pearson
Correlatio
n
.224** .224** 1 -.169** .121* 1.000** -.169** .121* -.169**
Sig. (2-
tailed)
.000 .000 .001 .018 .000 .001 .018 .001
N 385 385 385 385 385 385 385 385 385
Ease of
transportation
Pearson
Correlatio
n
.044 .044 -.169** 1 -.255** -.169** 1.000** -.255** 1.000*
*
Sig. (2-
tailed)
.389 .389 .001 .000 .001 .000 .000 .000
N 385 385 385 385 385 385 385 385 385
Food Pearson
Correlatio
n
-.012 -.012 .121* -.255** 1 .121* -.255** 1.000** -.255**
Sig. (2-
tailed)
.815 .815 .018 .000 .018 .000 .000 .000
N 385 385 385 385 385 385 385 385 385
Weather Pearson
Correlatio
n
.224** .224** 1.000** -.169** .121* 1 -.169** .121* -.169**
Sig. (2-
tailed)
.000 .000 .000 .001 .018 .001 .018 .001
N 385 385 385 385 385 385 385 385 385
Cleanliness Pearson
Correlatio
n
.044 .044 -.169** 1.000** -.255** -.169** 1 -.255** 1.000*
*
Sig. (2-
tailed)
.389 .389 .001 .000 .000 .001 .000 .000
N 385 385 385 385 385 385 385 385 385
Languages Pearson
Correlatio
n
-.012 -.012 .121* -.255** 1.000*
*
.1* -.255** 1 -.255**
Sig. (2-
tailed)
.815 .815 .018 .000 .000 .018 .000 .000
N 385 385 385 385 385 385 385 385 385
23DISSERTATION
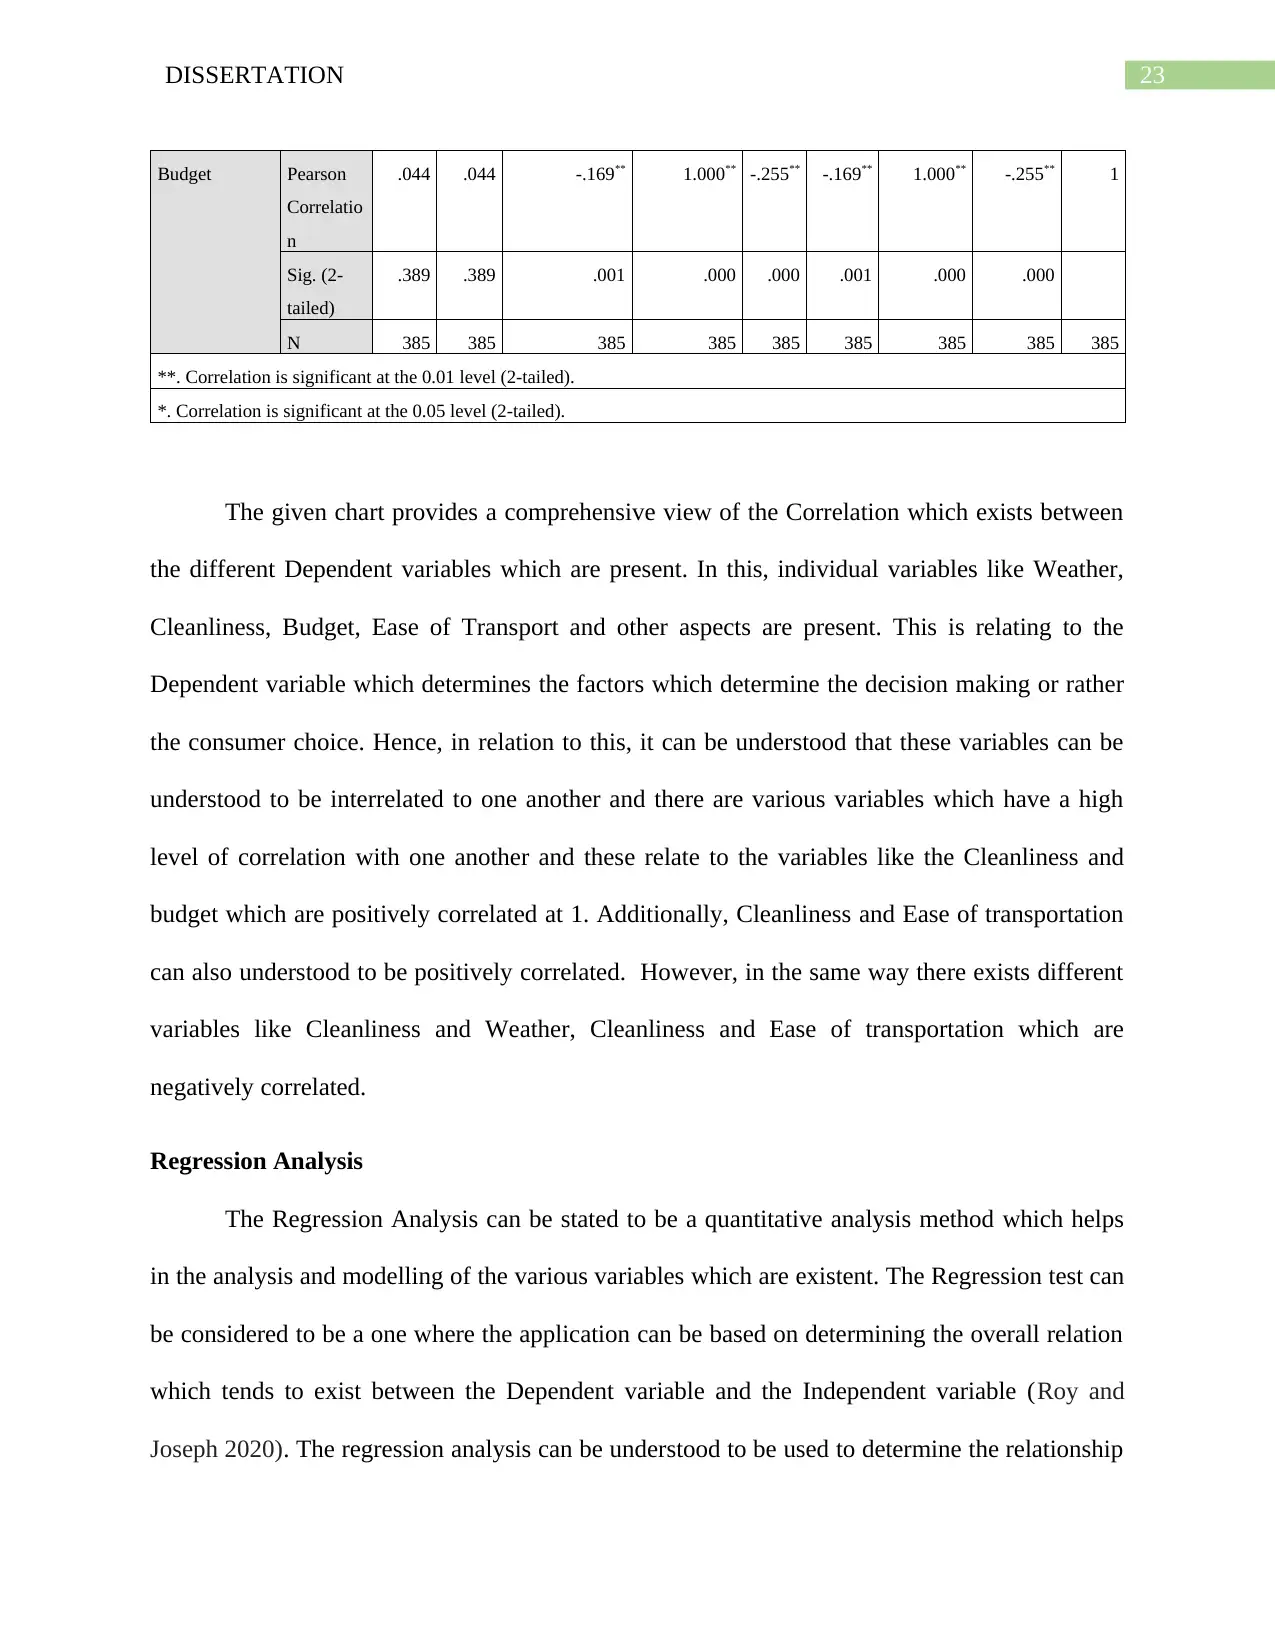
Budget Pearson
Correlatio
n
.044 .044 -.169** 1.000** -.255** -.169** 1.000** -.255** 1
Sig. (2-
tailed)
.389 .389 .001 .000 .000 .001 .000 .000
N 385 385 385 385 385 385 385 385 385
**. Correlation is significant at the 0.01 level (2-tailed).
*. Correlation is significant at the 0.05 level (2-tailed).
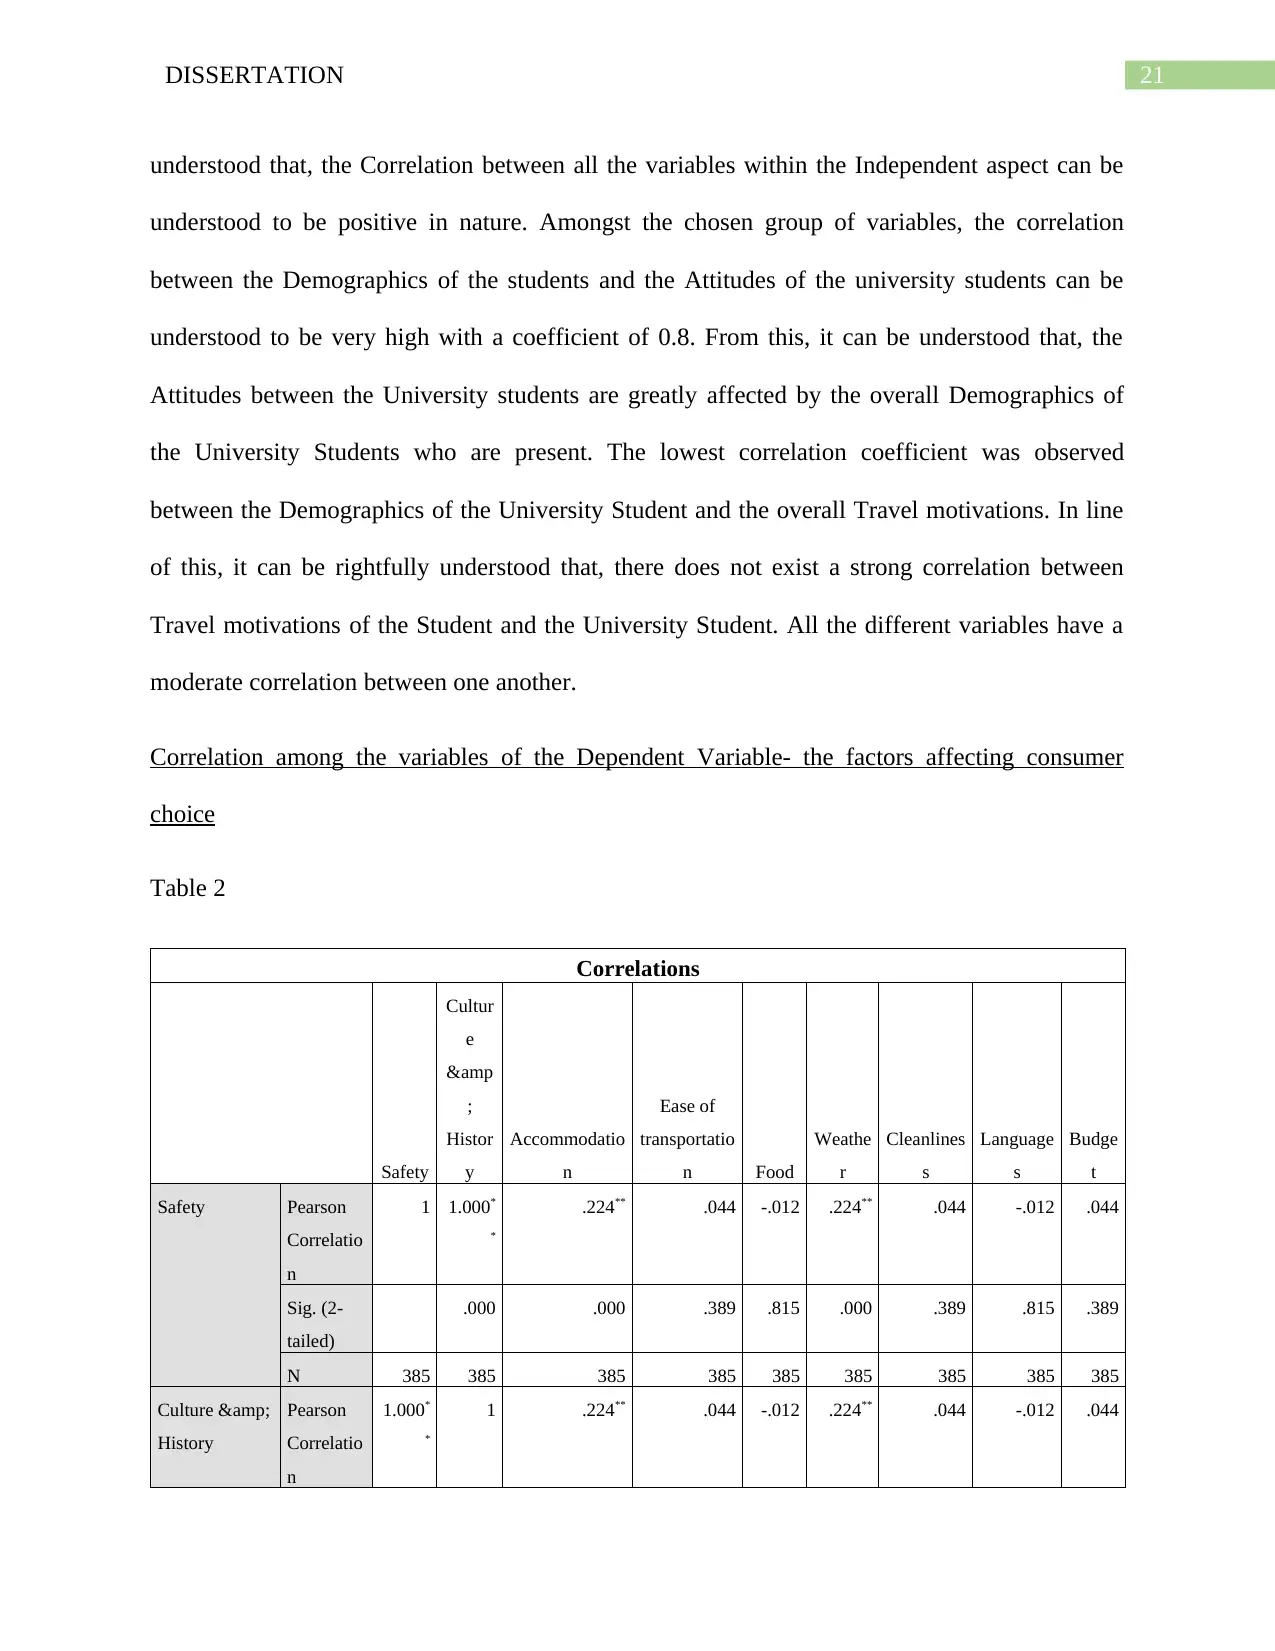
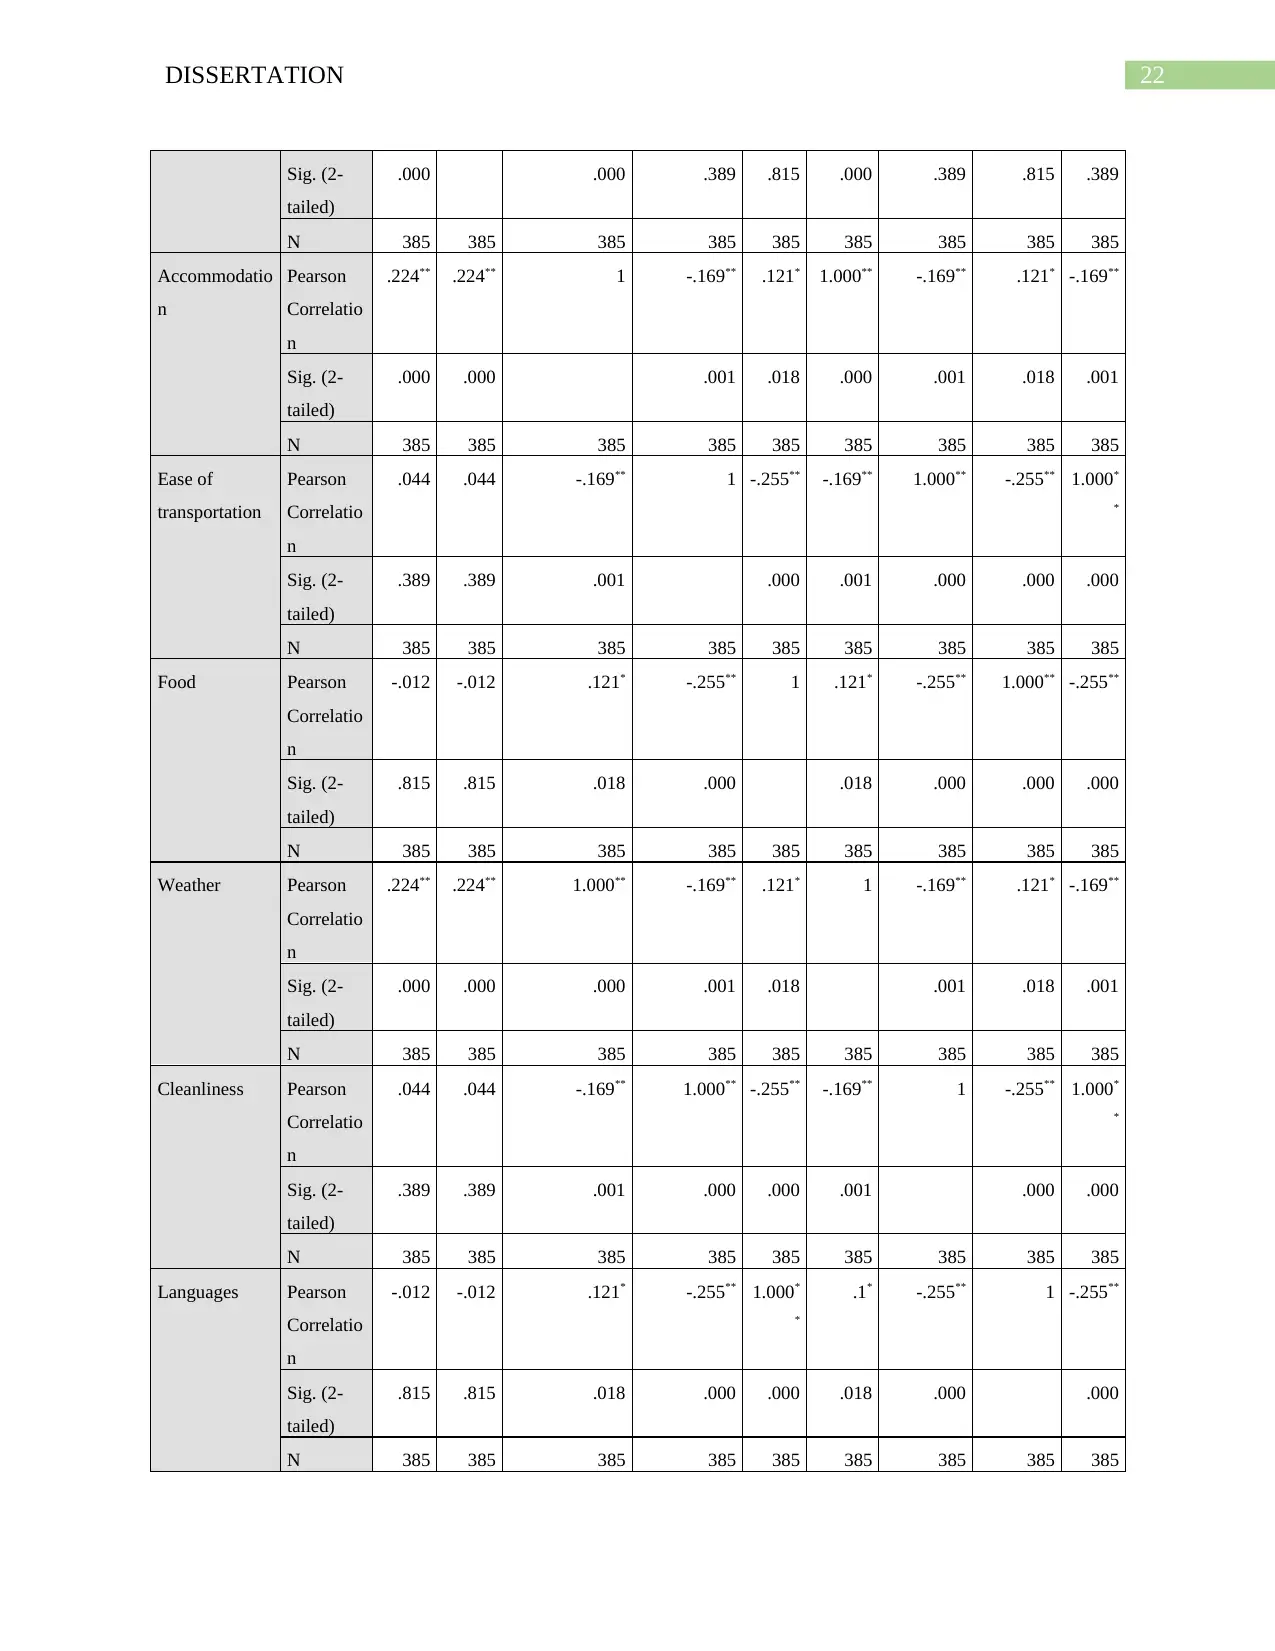
The given chart provides a comprehensive view of the Correlation which exists between
the different Dependent variables which are present. In this, individual variables like Weather,
Cleanliness, Budget, Ease of Transport and other aspects are present. This is relating to the
Dependent variable which determines the factors which determine the decision making or rather
the consumer choice. Hence, in relation to this, it can be understood that these variables can be
understood to be interrelated to one another and there are various variables which have a high
level of correlation with one another and these relate to the variables like the Cleanliness and
budget which are positively correlated at 1. Additionally, Cleanliness and Ease of transportation
can also understood to be positively correlated. However, in the same way there exists different
variables like Cleanliness and Weather, Cleanliness and Ease of transportation which are
negatively correlated.
Regression Analysis
The Regression Analysis can be stated to be a quantitative analysis method which helps
in the analysis and modelling of the various variables which are existent. The Regression test can
be considered to be a one where the application can be based on determining the overall relation
which tends to exist between the Dependent variable and the Independent variable (Roy and
Joseph 2020). The regression analysis can be understood to be used to determine the relationship
Budget Pearson
Correlatio
n
.044 .044 -.169** 1.000** -.255** -.169** 1.000** -.255** 1
Sig. (2-
tailed)
.389 .389 .001 .000 .000 .001 .000 .000
N 385 385 385 385 385 385 385 385 385
**. Correlation is significant at the 0.01 level (2-tailed).
*. Correlation is significant at the 0.05 level (2-tailed).
The given chart provides a comprehensive view of the Correlation which exists between
the different Dependent variables which are present. In this, individual variables like Weather,
Cleanliness, Budget, Ease of Transport and other aspects are present. This is relating to the
Dependent variable which determines the factors which determine the decision making or rather
the consumer choice. Hence, in relation to this, it can be understood that these variables can be
understood to be interrelated to one another and there are various variables which have a high
level of correlation with one another and these relate to the variables like the Cleanliness and
budget which are positively correlated at 1. Additionally, Cleanliness and Ease of transportation
can also understood to be positively correlated. However, in the same way there exists different
variables like Cleanliness and Weather, Cleanliness and Ease of transportation which are
negatively correlated.
Regression Analysis
The Regression Analysis can be stated to be a quantitative analysis method which helps
in the analysis and modelling of the various variables which are existent. The Regression test can
be considered to be a one where the application can be based on determining the overall relation
which tends to exist between the Dependent variable and the Independent variable (Roy and
Joseph 2020). The regression analysis can be understood to be used to determine the relationship
24DISSERTATION
which tends to exist between these variables and determines the extent to which predicting the
Independent can easily predict the dependent as well. In this section, the output of the Regression
Analysis which was undertaken with the help of the SPSS software has been examined.
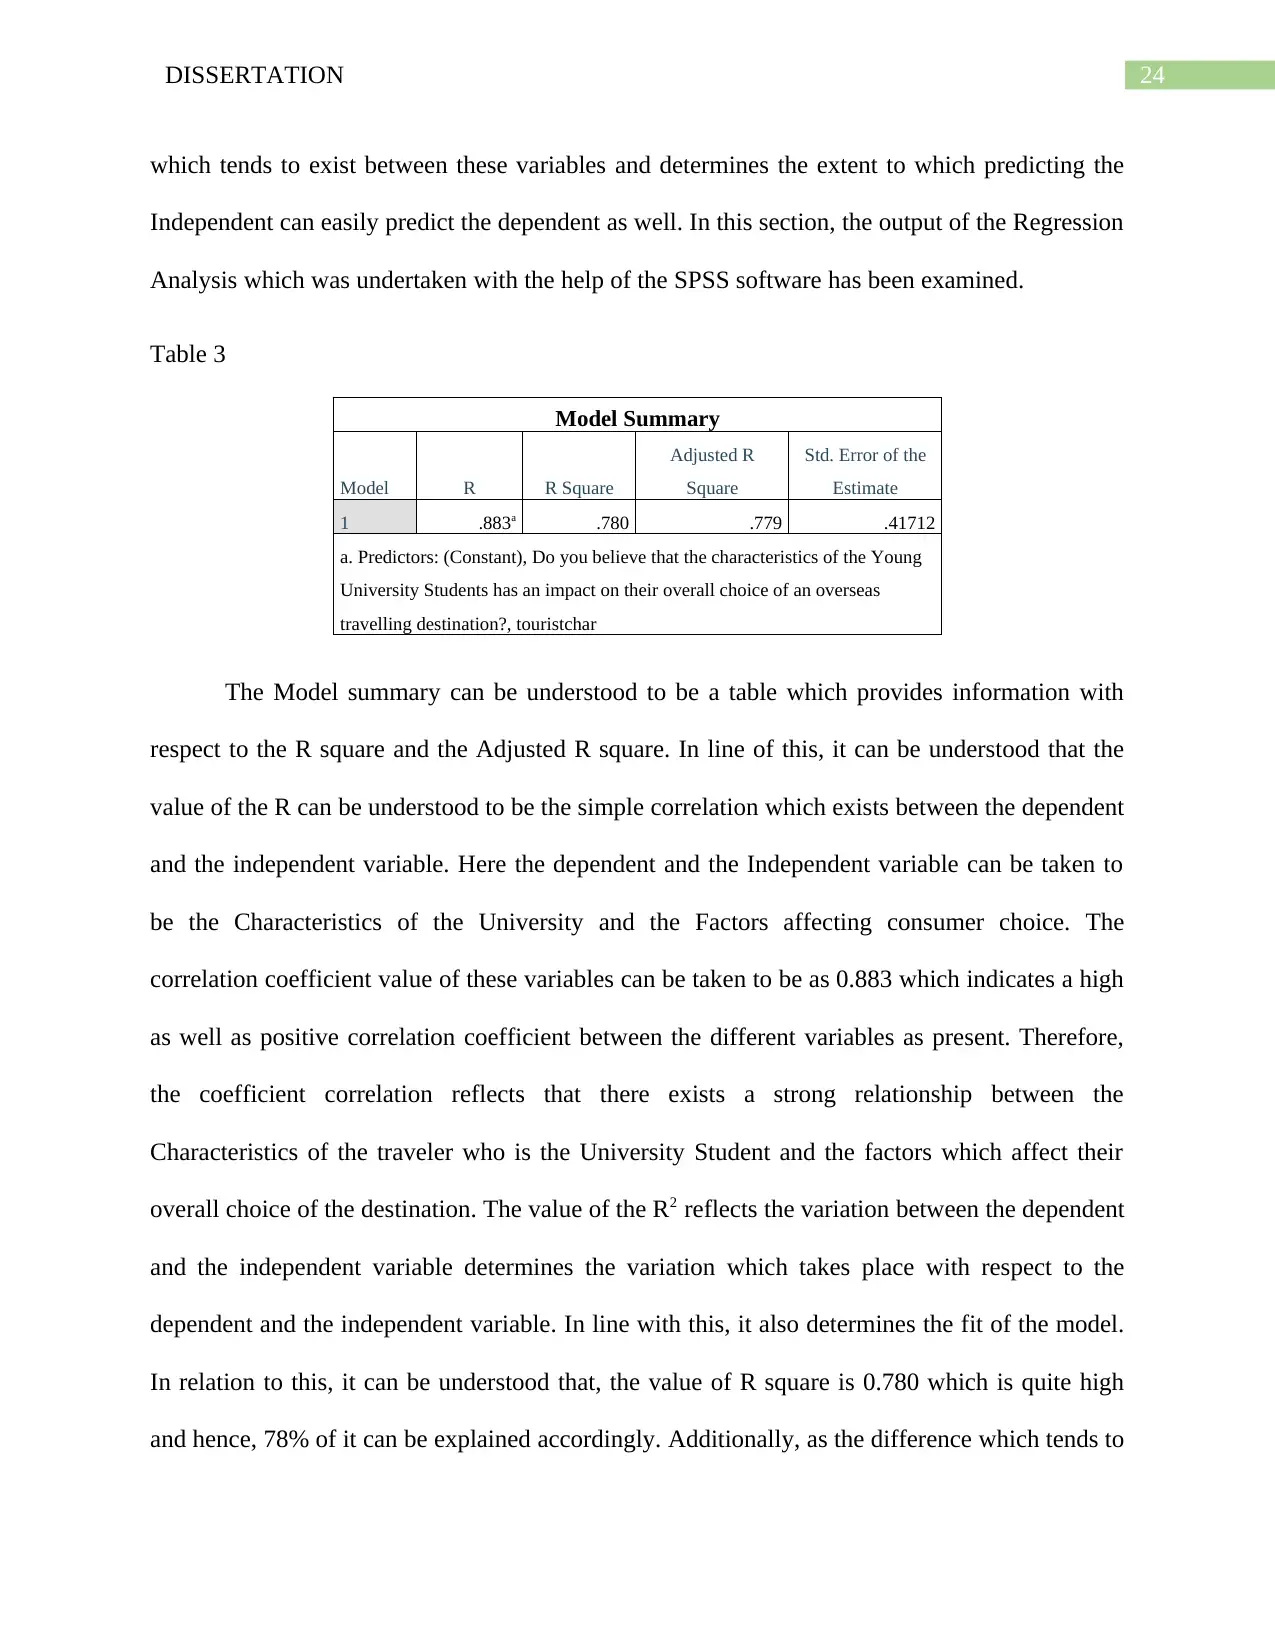
Table 3
Model Summary
Model R R Square
Adjusted R
Square
Std. Error of the
Estimate
1 .883a .780 .779 .41712
a. Predictors: (Constant), Do you believe that the characteristics of the Young
University Students has an impact on their overall choice of an overseas
travelling destination?, touristchar
The Model summary can be understood to be a table which provides information with
respect to the R square and the Adjusted R square. In line of this, it can be understood that the
value of the R can be understood to be the simple correlation which exists between the dependent
and the independent variable. Here the dependent and the Independent variable can be taken to
be the Characteristics of the University and the Factors affecting consumer choice. The
correlation coefficient value of these variables can be taken to be as 0.883 which indicates a high
as well as positive correlation coefficient between the different variables as present. Therefore,
the coefficient correlation reflects that there exists a strong relationship between the
Characteristics of the traveler who is the University Student and the factors which affect their
overall choice of the destination. The value of the R2 reflects the variation between the dependent
and the independent variable determines the variation which takes place with respect to the
dependent and the independent variable. In line with this, it also determines the fit of the model.
In relation to this, it can be understood that, the value of R square is 0.780 which is quite high
and hence, 78% of it can be explained accordingly. Additionally, as the difference which tends to
which tends to exist between these variables and determines the extent to which predicting the
Independent can easily predict the dependent as well. In this section, the output of the Regression
Analysis which was undertaken with the help of the SPSS software has been examined.
Table 3
Model Summary
Model R R Square
Adjusted R
Square
Std. Error of the
Estimate
1 .883a .780 .779 .41712
a. Predictors: (Constant), Do you believe that the characteristics of the Young
University Students has an impact on their overall choice of an overseas
travelling destination?, touristchar
The Model summary can be understood to be a table which provides information with
respect to the R square and the Adjusted R square. In line of this, it can be understood that the
value of the R can be understood to be the simple correlation which exists between the dependent
and the independent variable. Here the dependent and the Independent variable can be taken to
be the Characteristics of the University and the Factors affecting consumer choice. The
correlation coefficient value of these variables can be taken to be as 0.883 which indicates a high
as well as positive correlation coefficient between the different variables as present. Therefore,
the coefficient correlation reflects that there exists a strong relationship between the
Characteristics of the traveler who is the University Student and the factors which affect their
overall choice of the destination. The value of the R2 reflects the variation between the dependent
and the independent variable determines the variation which takes place with respect to the
dependent and the independent variable. In line with this, it also determines the fit of the model.
In relation to this, it can be understood that, the value of R square is 0.780 which is quite high
and hence, 78% of it can be explained accordingly. Additionally, as the difference which tends to
Paraphrase This Document
Need a fresh take? Get an instant paraphrase of this document with our AI Paraphraser
25DISSERTATION
exist between the R and Adjusted R square is considerably low, the model can be understood to
be a god fit model.
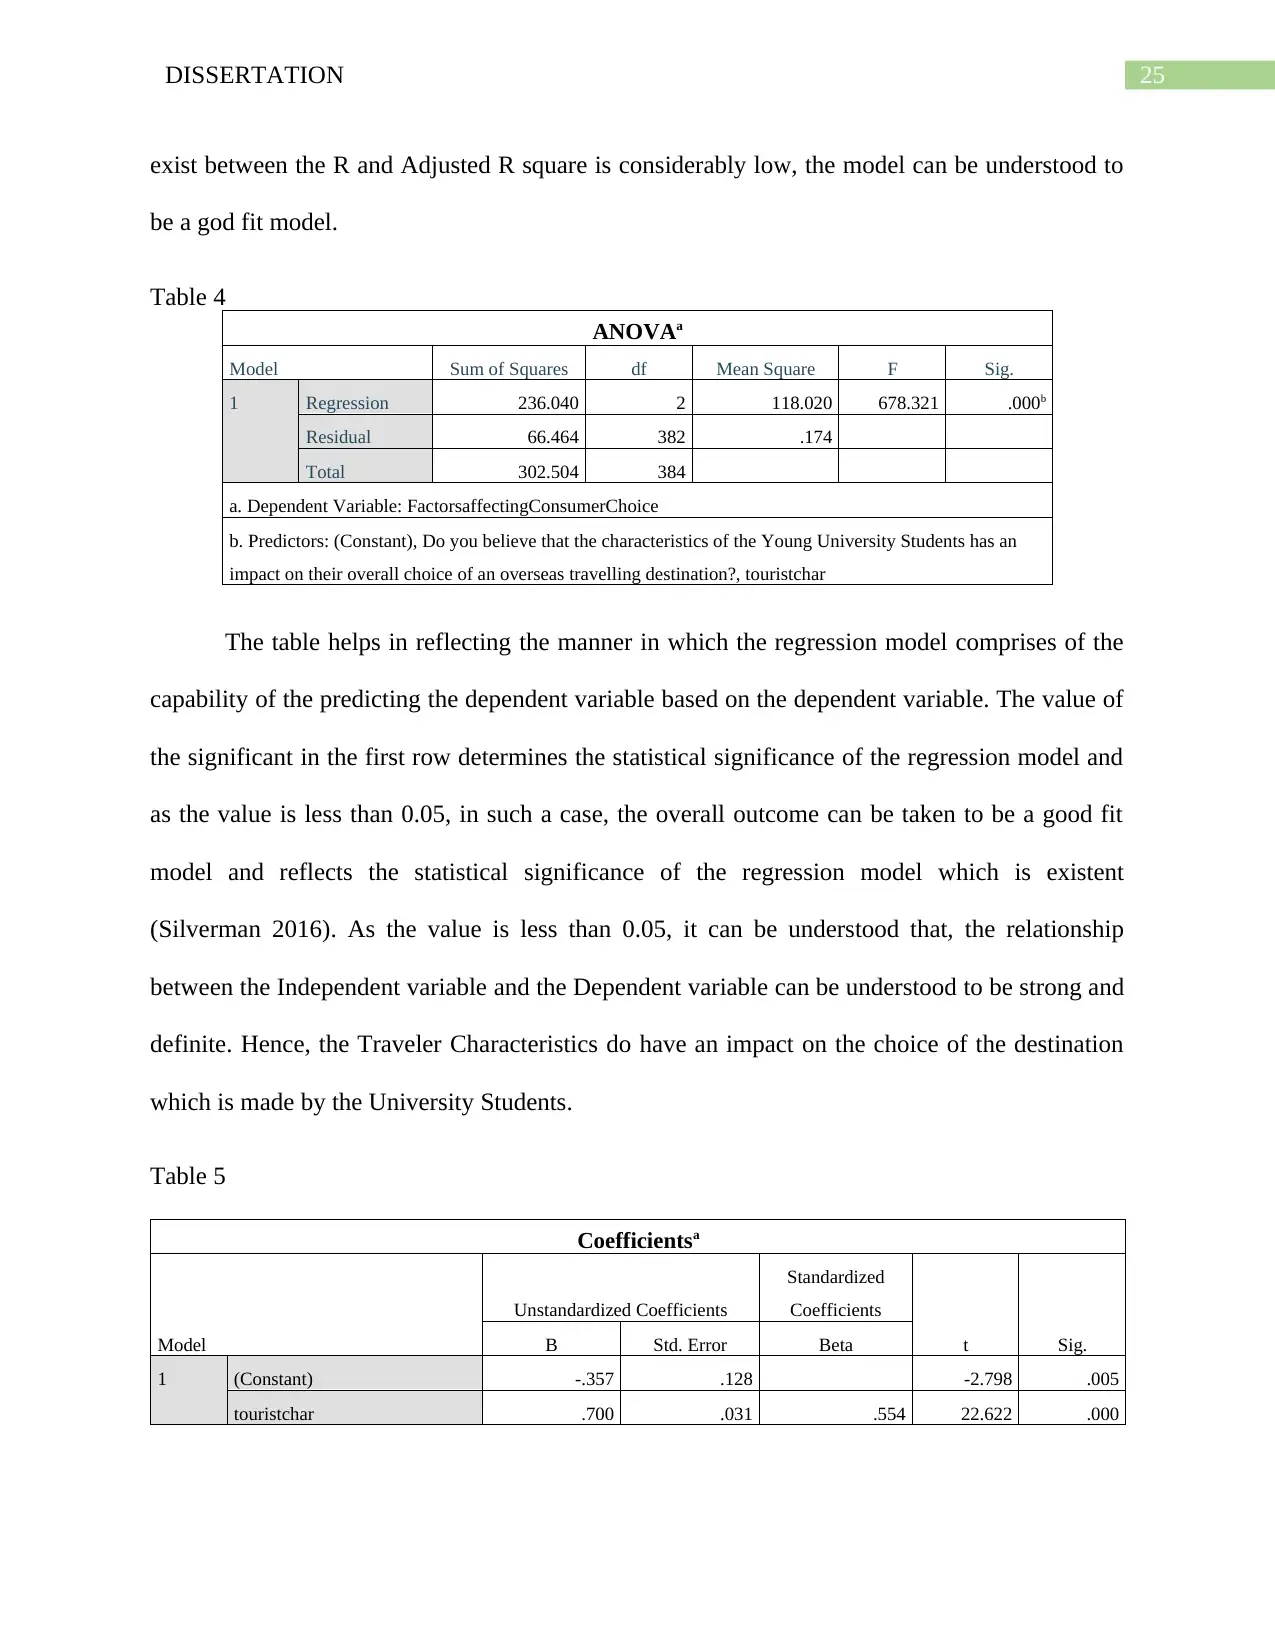
Table 4
ANOVAa
Model Sum of Squares df Mean Square F Sig.
1 Regression 236.040 2 118.020 678.321 .000b
Residual 66.464 382 .174
Total 302.504 384
a. Dependent Variable: FactorsaffectingConsumerChoice
b. Predictors: (Constant), Do you believe that the characteristics of the Young University Students has an
impact on their overall choice of an overseas travelling destination?, touristchar
The table helps in reflecting the manner in which the regression model comprises of the
capability of the predicting the dependent variable based on the dependent variable. The value of
the significant in the first row determines the statistical significance of the regression model and
as the value is less than 0.05, in such a case, the overall outcome can be taken to be a good fit
model and reflects the statistical significance of the regression model which is existent
(Silverman 2016). As the value is less than 0.05, it can be understood that, the relationship
between the Independent variable and the Dependent variable can be understood to be strong and
definite. Hence, the Traveler Characteristics do have an impact on the choice of the destination
which is made by the University Students.
Table 5
Coefficientsa
Model
Unstandardized Coefficients
Standardized
Coefficients
t Sig.B Std. Error Beta
1 (Constant) -.357 .128 -2.798 .005
touristchar .700 .031 .554 22.622 .000
exist between the R and Adjusted R square is considerably low, the model can be understood to
be a god fit model.
Table 4
ANOVAa
Model Sum of Squares df Mean Square F Sig.
1 Regression 236.040 2 118.020 678.321 .000b
Residual 66.464 382 .174
Total 302.504 384
a. Dependent Variable: FactorsaffectingConsumerChoice
b. Predictors: (Constant), Do you believe that the characteristics of the Young University Students has an
impact on their overall choice of an overseas travelling destination?, touristchar
The table helps in reflecting the manner in which the regression model comprises of the
capability of the predicting the dependent variable based on the dependent variable. The value of
the significant in the first row determines the statistical significance of the regression model and
as the value is less than 0.05, in such a case, the overall outcome can be taken to be a good fit
model and reflects the statistical significance of the regression model which is existent
(Silverman 2016). As the value is less than 0.05, it can be understood that, the relationship
between the Independent variable and the Dependent variable can be understood to be strong and
definite. Hence, the Traveler Characteristics do have an impact on the choice of the destination
which is made by the University Students.
Table 5
Coefficientsa
Model
Unstandardized Coefficients
Standardized
Coefficients
t Sig.B Std. Error Beta
1 (Constant) -.357 .128 -2.798 .005
touristchar .700 .031 .554 22.622 .000
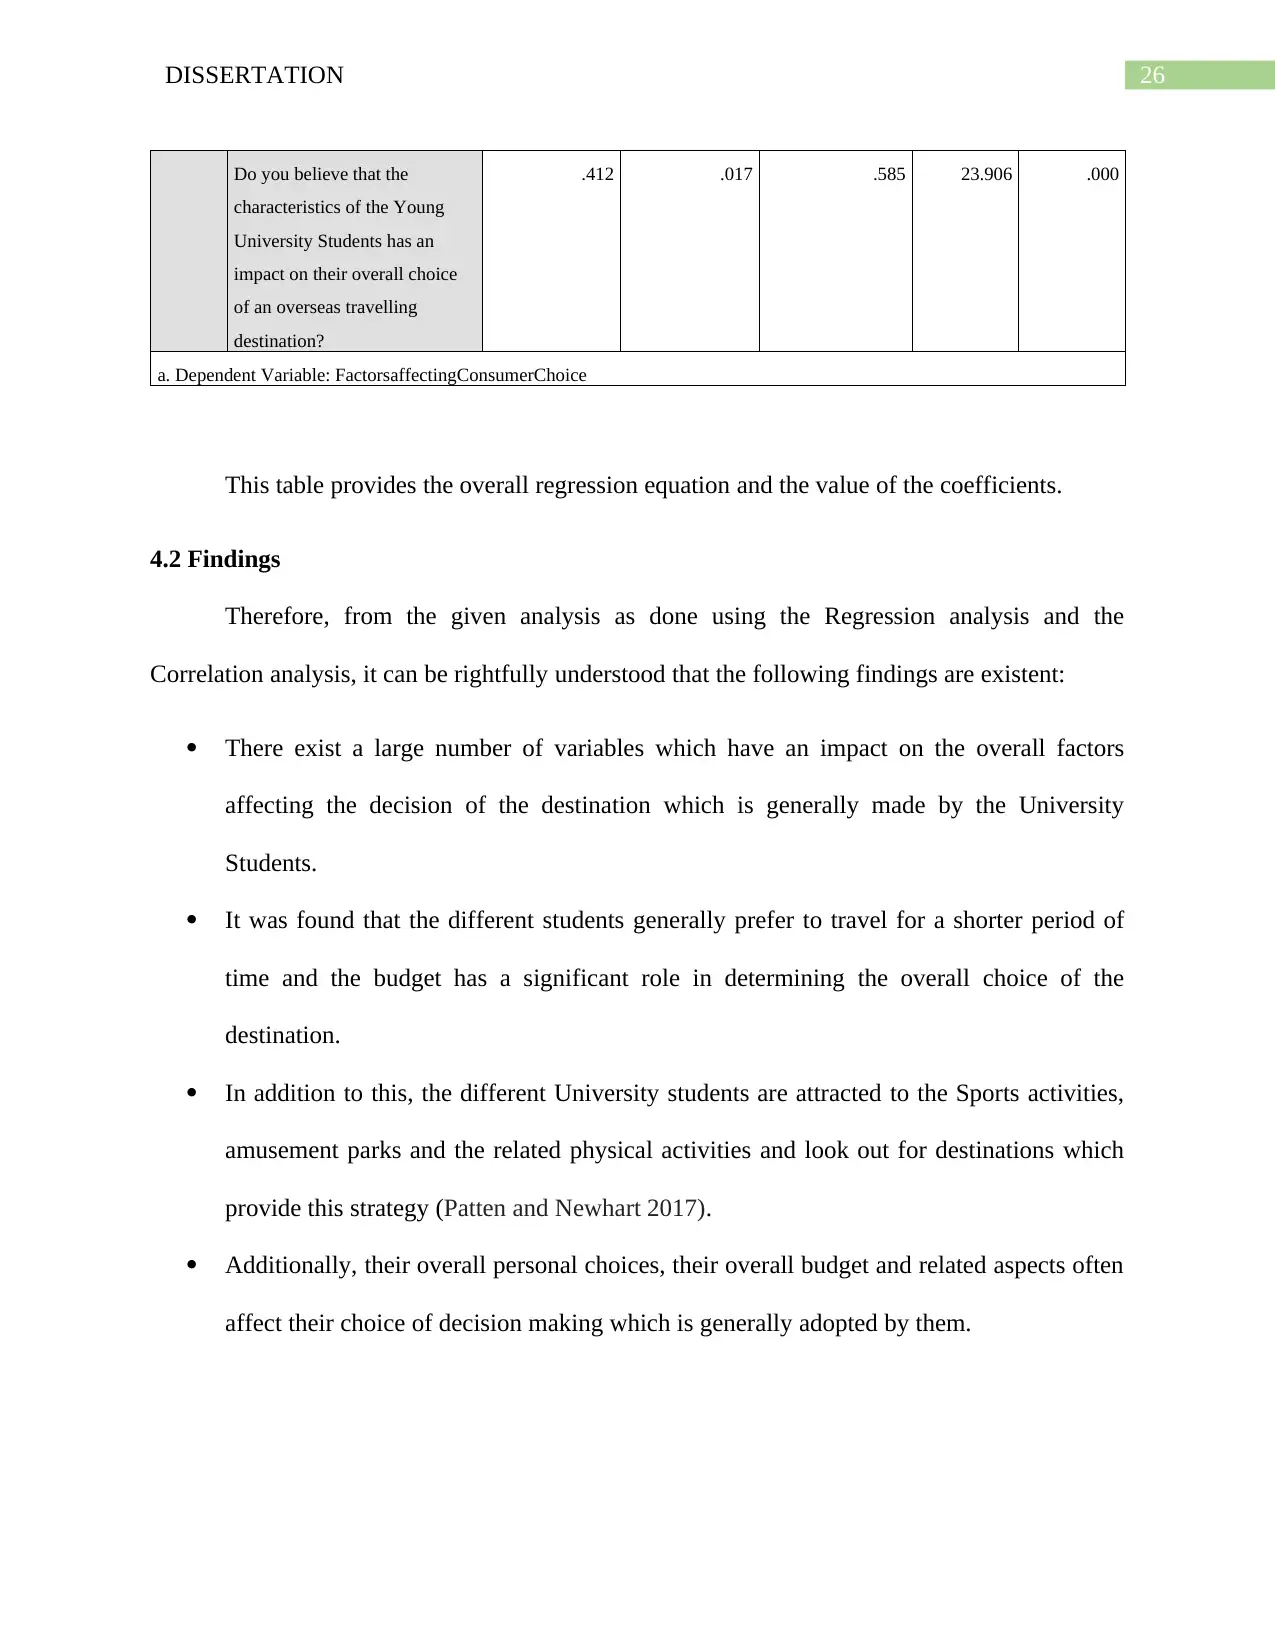
26DISSERTATION
Do you believe that the
characteristics of the Young
University Students has an
impact on their overall choice
of an overseas travelling
destination?
.412 .017 .585 23.906 .000
a. Dependent Variable: FactorsaffectingConsumerChoice
This table provides the overall regression equation and the value of the coefficients.
4.2 Findings
Therefore, from the given analysis as done using the Regression analysis and the
Correlation analysis, it can be rightfully understood that the following findings are existent:
There exist a large number of variables which have an impact on the overall factors
affecting the decision of the destination which is generally made by the University
Students.
It was found that the different students generally prefer to travel for a shorter period of
time and the budget has a significant role in determining the overall choice of the
destination.
In addition to this, the different University students are attracted to the Sports activities,
amusement parks and the related physical activities and look out for destinations which
provide this strategy (Patten and Newhart 2017).
Additionally, their overall personal choices, their overall budget and related aspects often
affect their choice of decision making which is generally adopted by them.
27DISSERTATION
4.3 Discussion
Hence, from the given analysis, it was found that, there are various factors which tend to
influence the choice of a foreign destination which is generally undertaken by the University
Student. Firstly, it can be stated that, the activities which the destination has to offer plays a
significant role in ensuring that the decision which is adopted by the University can be altered in
that manner. In line of this, it has to be understood that, the different tourist destinations in order
to ensure their overall welfare, would be required to see to it that, they offer adequate activities
to the different students so as to ensure long term competitive advantage of the workplace and
the overall success (Mackey and Gass 2015). Additionally, the next significant factor which
influences the student decision can be understood to be the Budget of the Student. The different
students in the Universities of Hong Kong generally function on a very strict budget and it is in
relation to this that it becomes considerably crucial for the different tourist destinations to ensure
that in order to engage in popularity, they would be required to engage in budget friendly
offerings because, students have to follow this strict budget in order to gain overall success (Lee
et al. 2018). Moreover, it was also found that the places with Amusement Parks were very
popular amongst the different students and they enjoyed the different activities which were
similar to the activities of an amusement park. In relation to this, they liked to travel in groups
which provides them with adequate convenience and additionally also provides them with
sufficient budgetary savings (Roy and Joseph 2020). Hence, the different student friendly
destinations can be understood to be the one which had a low budget facility, provided physical
activities as well as provided the different guests with other related opportunities.
Moreover, it is the overall personal characteristics of the different students that assist
them in making any specific choice in relation to a place. It is in regard of this, that it can be
Secure Best Marks with AI Grader
Need help grading? Try our AI Grader for instant feedback on your assignments.
28DISSERTATION
rightfully stated that, if any individual wants to choose a travel destination then they would be
influenced by their overall food choices, transportation choices, attitudes, willingness to travel
and other motivational aspects which would assist them in taking the right decision (Atadil et al.
2018). In line with this, it has to be understood that there are various factors affecting the overall
decision making of the different University students and their choice of destination.
The social media has a great role to play in this whereby they would be required to
undertake choices relating to the overall decision making which would assist the tourist
destinations attain long term popularity (Book, Tanford and Chen 2016). The social media can
be understood to be a medium which is usually adopted by the different students to make their
choices and hence, if any particular tourist destination wants to ensure that they are able to
become popular in the long run, then in this scenario, they would be required to advertise using
the social media marketing which would assist them in making the right consumer market.
29DISSERTATION
Chapter 5: Conclusion
5.1 Overview
Therefore, from the given analysis, it can be understood that the research report provided
a comprehensive view of the overall factors which influence the decision making of the different
University students regarding the overall choice of a tourist destination of the different students
present in Hong Kong. The paper presented a comprehensive approach to the different factors
which affect the overall decision making of the students. The paper followed a systematic format
which outlined the overall Introduction of the paper which provided the objectives and related
questions. The review of literate presented an overall view of the theoretical frameworks and
related theories relating to the overall decision making. The third chapter presented a
methodology framework which laid down the different research techniques which had been used
for the paper. The fourth chapter outlined the overall analysis and findings which have been
undertaken using the SPSS as a software. In line with this, the findings from that analysis and the
conclusions derived out of it were also analyzed and understood accordingly.
5.2 Linking to Objectives
Hence, the study provided an overall outline of the demographics of the different students
which are present in the particular field. In line with this, it was found that these students range
from the age group of 18 to 30, have an average income of $8000 per annum and prefer to travel
to places which have a high activity rate. Additionally, it can be understood that, the travel
motivation which lies amongst the different students can be understood to be the physical
activities, the motivation to remain in budget and related aspects. In line of this, it can be
rightfully mentioned that, it is due to this that the students are willing to take up trips which are
ranging from 2 days to a fortnight depending on the facilities provided to them.
30DISSERTATION
The different students expect the place to be clean, having adequate food options, having various
engaging activities and additionally also prefer it to be cost friendly. Moreover, the shopping
attitude amongst the students was witnessed to be extremely important for the students and was
largely related to the overall attractiveness of the place and the pricing which they offer.
5.3 Future scope
The given study can be understood to be limited to the overall factors which influence the
choice which is generally made by the different students in regard to the student destination. In
the future, the study can be understood to be taken forward in order to determine which factors
have an influence on the overall choice of decision and to which extent. This shall assist in
ensuring that the in-depth analysis for the study can be adopted easily.
Paraphrase This Document
Need a fresh take? Get an instant paraphrase of this document with our AI Paraphraser
31DISSERTATION
References
Alvesson, M. and Sköldberg, K., 2017. Reflexive methodology: New vistas for qualitative
research. Sage.
Atadil, H.A., Sirakaya-Turk, E., Meng, F. and Decrop, A., 2018. Exploring travelers’ decision-
making styles. International Journal of Contemporary Hospitality Management, 30(1), pp.618-
636.
Barnham, C., 2015. Quantitative and qualitative research: Perceptual foundations. International
Journal of Market Research, 57(6), pp.837-854.
Book, L.A., Tanford, S. and Chen, Y.S., 2016. Understanding the impact of negative and
positive traveler reviews: Social influence and price anchoring effects. Journal of Travel
Research, 55(8), pp.993-1007.
Brannen, J., 2017. Mixing methods: Qualitative and quantitative research. Routledge.
Bresler, L. and Stake, R.E., 2017. Qualitative research methodology in music education.
In Critical Essays in Music Education (pp. 113-128). Routledge.
Bryman, A., 2017. Quantitative and qualitative research: further reflections on their integration.
In Mixing methods: Qualitative and quantitative research (pp. 57-78). Routledge.
Creswell, J.W. and Creswell, J.D., 2017. Research design: Qualitative, quantitative, and mixed
methods approaches. Sage publications.
Flick, U., 2015. Introducing research methodology: A beginner's guide to doing a research
project. Sage.
32DISSERTATION
Hoy, W.K. and Adams, C.M., 2015. Quantitative research in education: A primer. Sage
Publications.
Kumar, R., 2019. Research methodology: A step-by-step guide for beginners. Sage Publications
Limited.
Ledford, J.R. and Gast, D.L., 2018. Single case research methodology: Applications in special
education and behavioral sciences. Routledge.
Lee, S., Song, H., Lee, C.K. and Petrick, J.F., 2018. An integrated model of pop culture fans’
travel decision-making processes. Journal of Travel Research, 57(5), pp.687-701.
Mackey, A. and Gass, S.M., 2015. Second language research: Methodology and design.
Routledge.
Patten, M.L. and Newhart, M., 2017. Understanding research methods: An overview of the
essentials. Routledge.
Roy, S. and Joseph, D., 2020. Traveler Decision Making in Online vs. Offline Buying Behavior:
A Contrasting Perspective. In Digital Marketing Strategies for Tourism, Hospitality, and Airline
Industries (pp. 23-48). IGI Global.
Silverman, D. ed., 2016. Qualitative research. Sage.
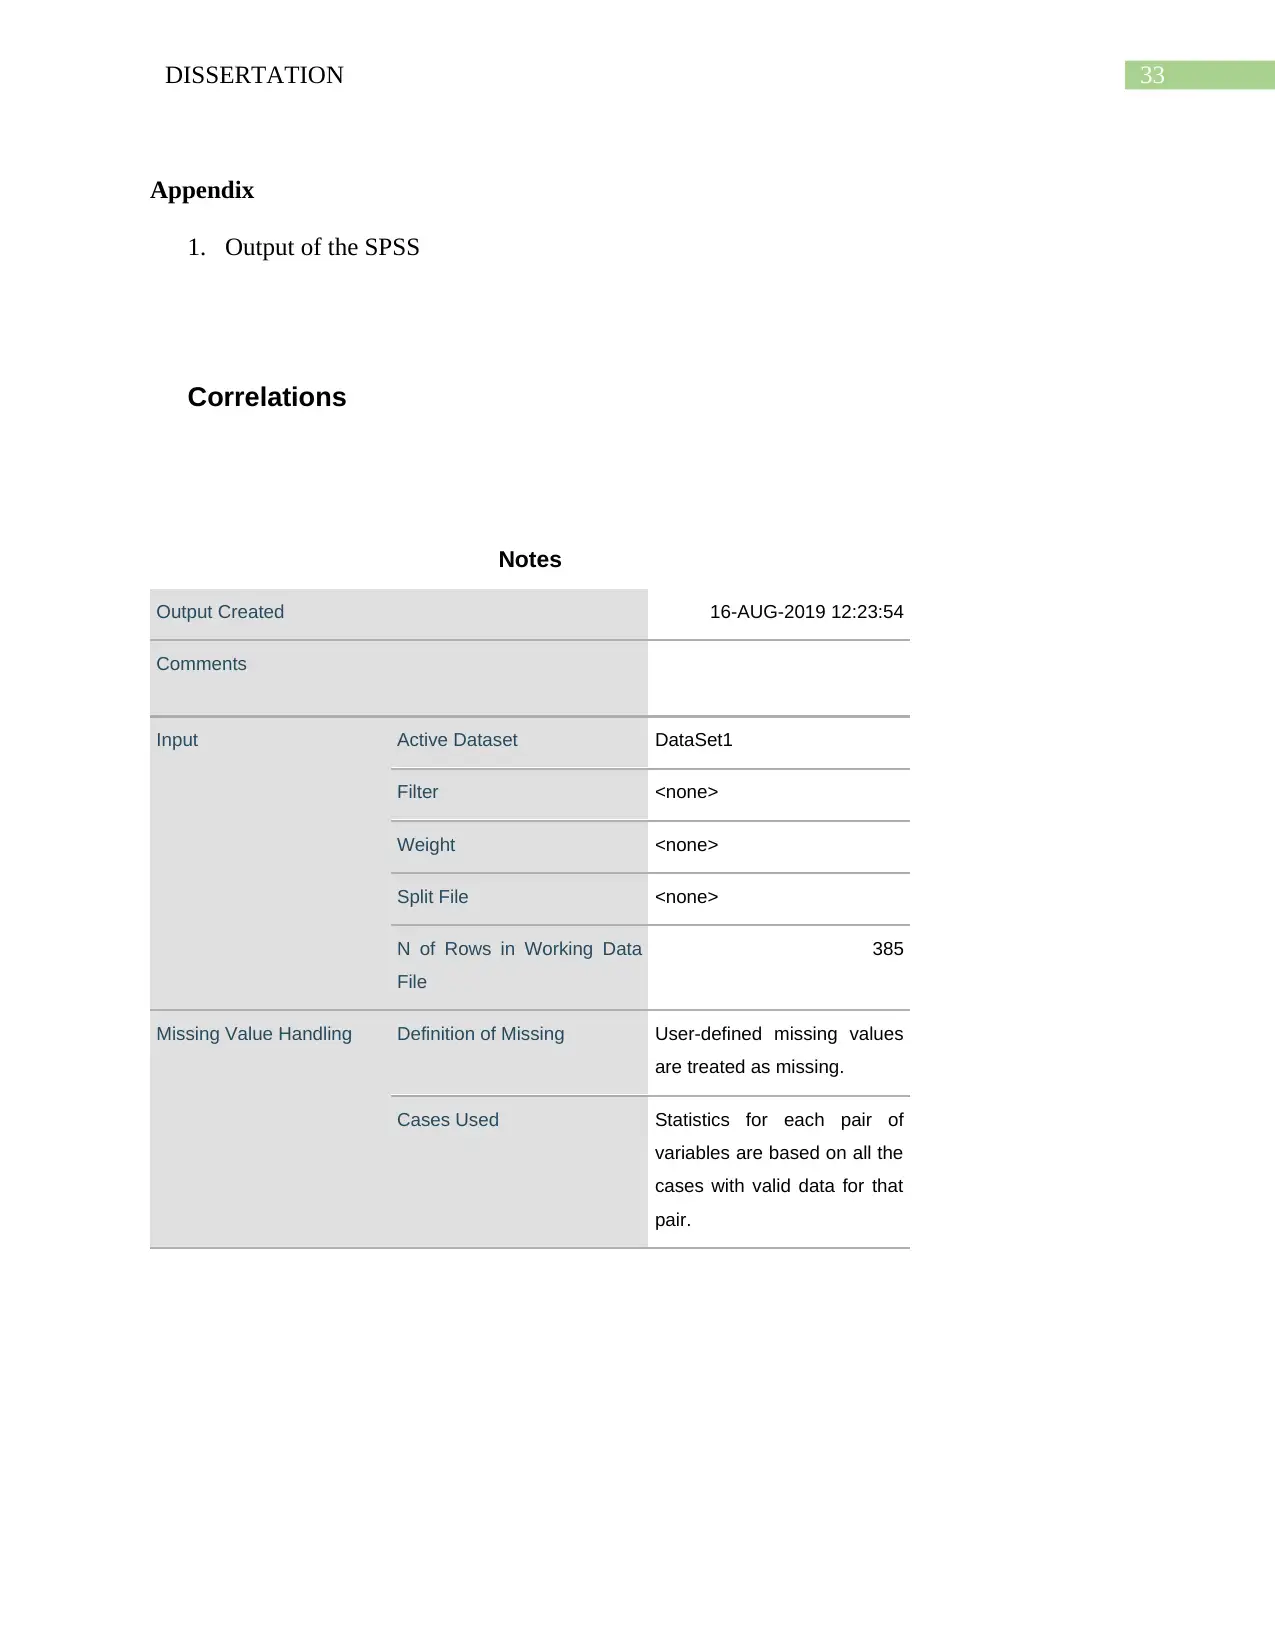
33DISSERTATION
Appendix
1. Output of the SPSS
Correlations
Notes
Output Created 16-AUG-2019 12:23:54
Comments
Input Active Dataset DataSet1
Filter <none>
Weight <none>
Split File <none>
N of Rows in Working Data
File
385
Missing Value Handling Definition of Missing User-defined missing values
are treated as missing.
Cases Used Statistics for each pair of
variables are based on all the
cases with valid data for that
pair.
Secure Best Marks with AI Grader
Need help grading? Try our AI Grader for instant feedback on your assignments.
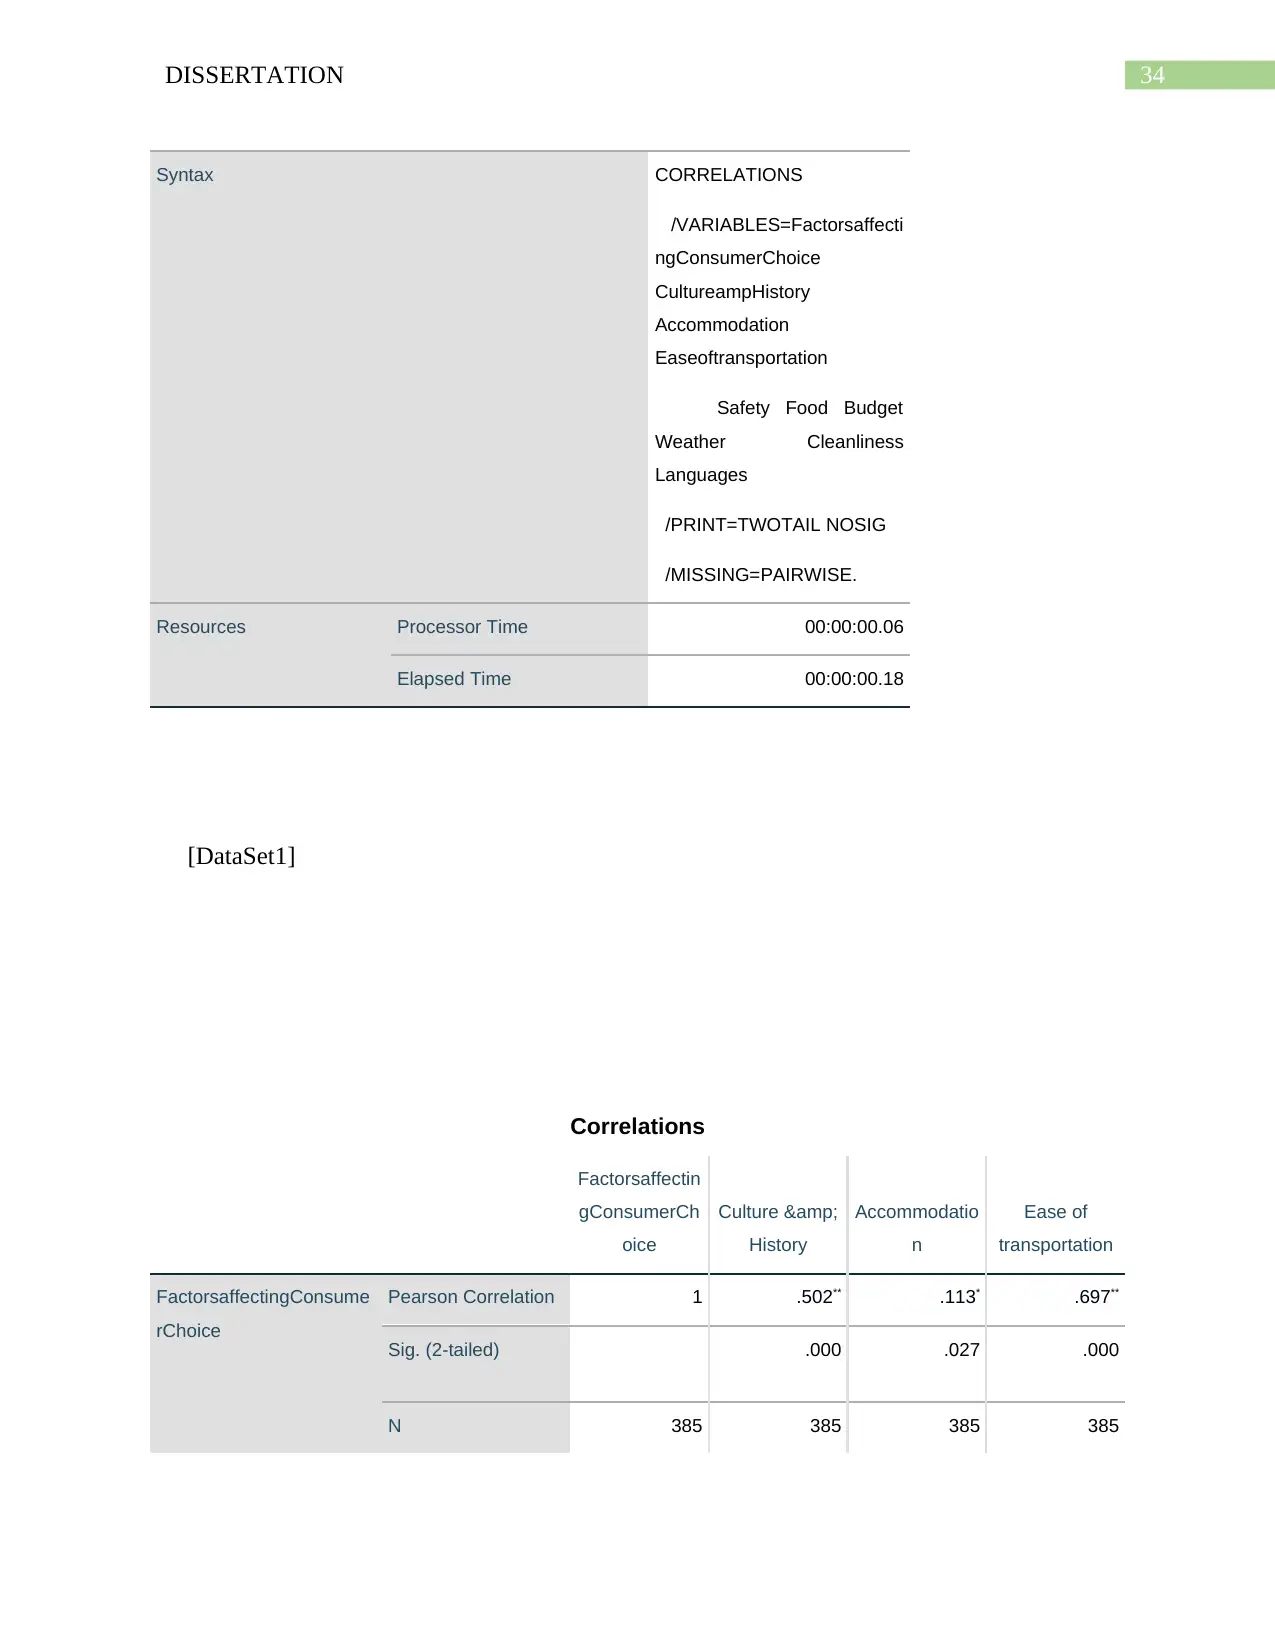
34DISSERTATION
Syntax CORRELATIONS
/VARIABLES=Factorsaffecti
ngConsumerChoice
CultureampHistory
Accommodation
Easeoftransportation
Safety Food Budget
Weather Cleanliness
Languages
/PRINT=TWOTAIL NOSIG
/MISSING=PAIRWISE.
Resources Processor Time 00:00:00.06
Elapsed Time 00:00:00.18
[DataSet1]
Correlations
Factorsaffectin
gConsumerCh
oice
Culture &
History
Accommodatio
n
Ease of
transportation
FactorsaffectingConsume
rChoice
Pearson Correlation 1 .502** .113* .697**
Sig. (2-tailed) .000 .027 .000
N 385 385 385 385
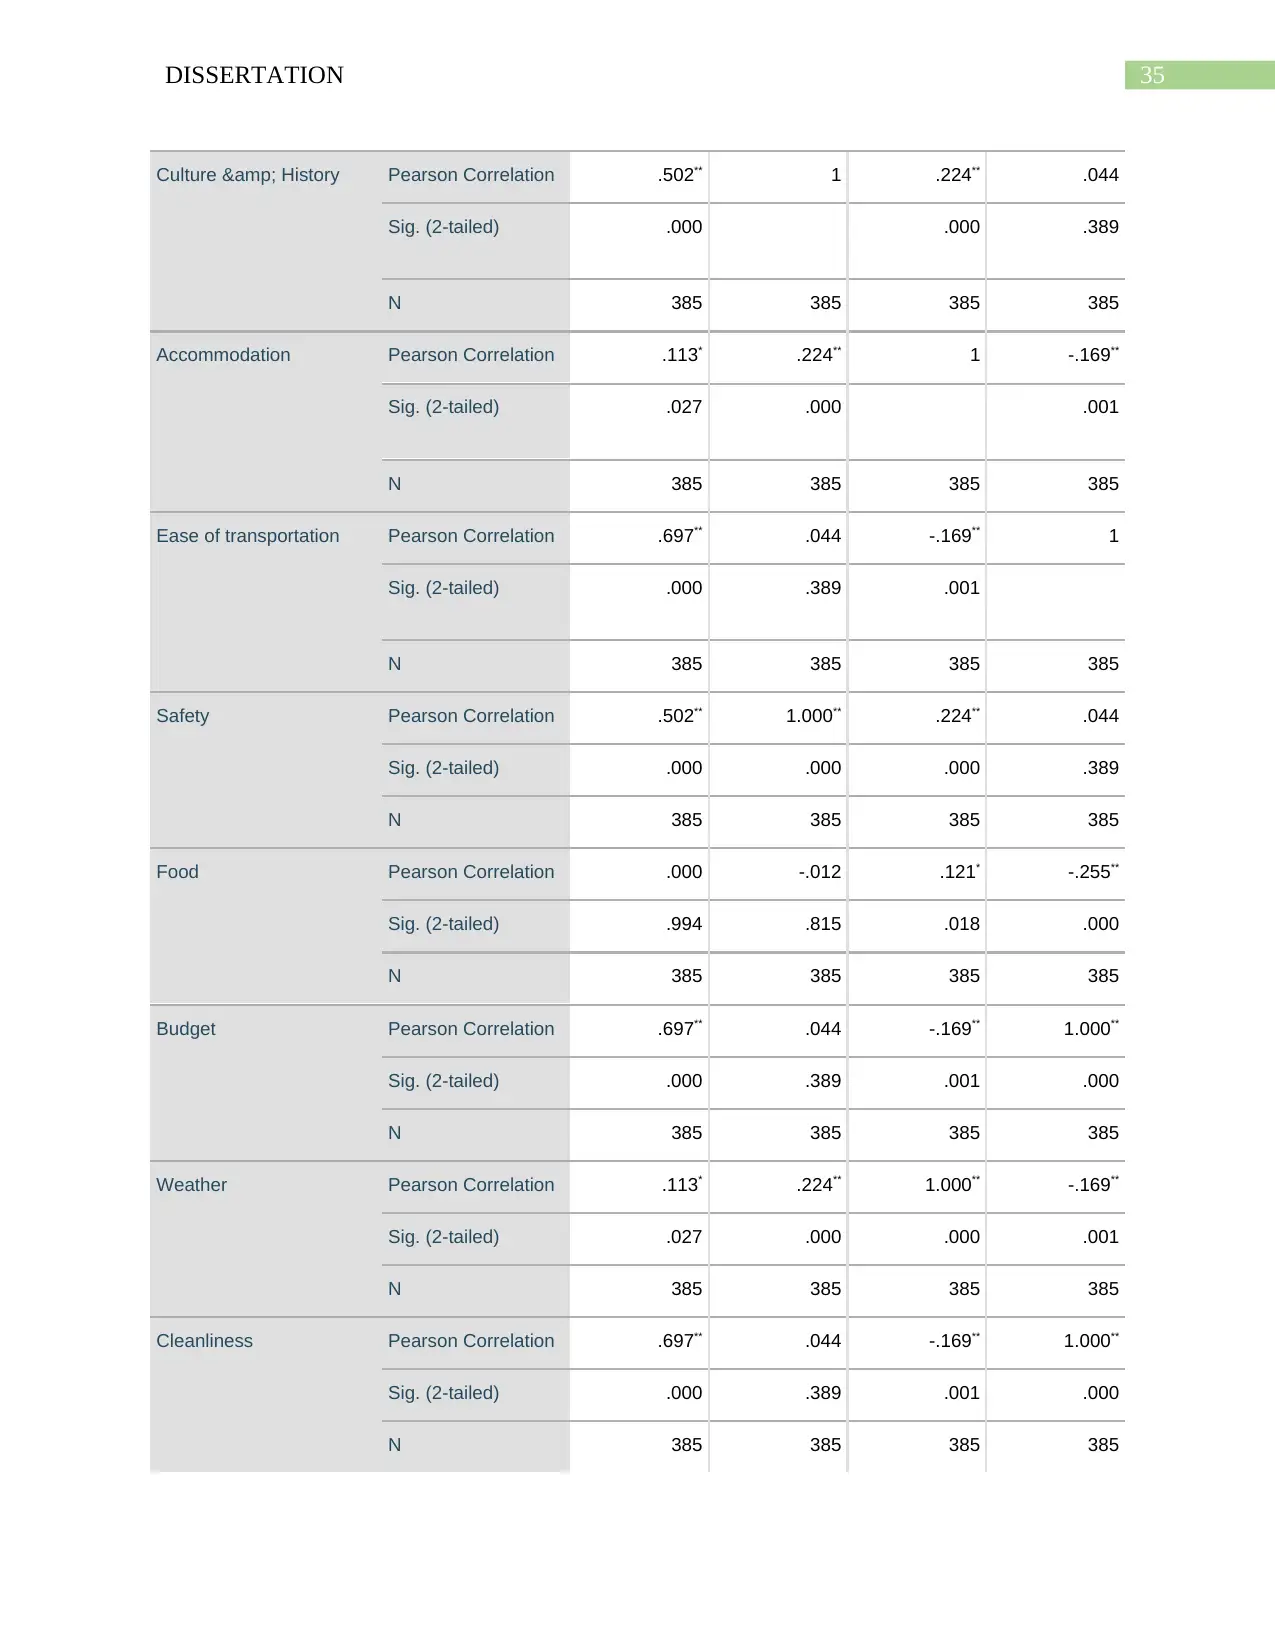
35DISSERTATION
Culture & History Pearson Correlation .502** 1 .224** .044
Sig. (2-tailed) .000 .000 .389
N 385 385 385 385
Accommodation Pearson Correlation .113* .224** 1 -.169**
Sig. (2-tailed) .027 .000 .001
N 385 385 385 385
Ease of transportation Pearson Correlation .697** .044 -.169** 1
Sig. (2-tailed) .000 .389 .001
N 385 385 385 385
Safety Pearson Correlation .502** 1.000** .224** .044
Sig. (2-tailed) .000 .000 .000 .389
N 385 385 385 385
Food Pearson Correlation .000 -.012 .121* -.255**
Sig. (2-tailed) .994 .815 .018 .000
N 385 385 385 385
Budget Pearson Correlation .697** .044 -.169** 1.000**
Sig. (2-tailed) .000 .389 .001 .000
N 385 385 385 385
Weather Pearson Correlation .113* .224** 1.000** -.169**
Sig. (2-tailed) .027 .000 .000 .001
N 385 385 385 385
Cleanliness Pearson Correlation .697** .044 -.169** 1.000**
Sig. (2-tailed) .000 .389 .001 .000
N 385 385 385 385
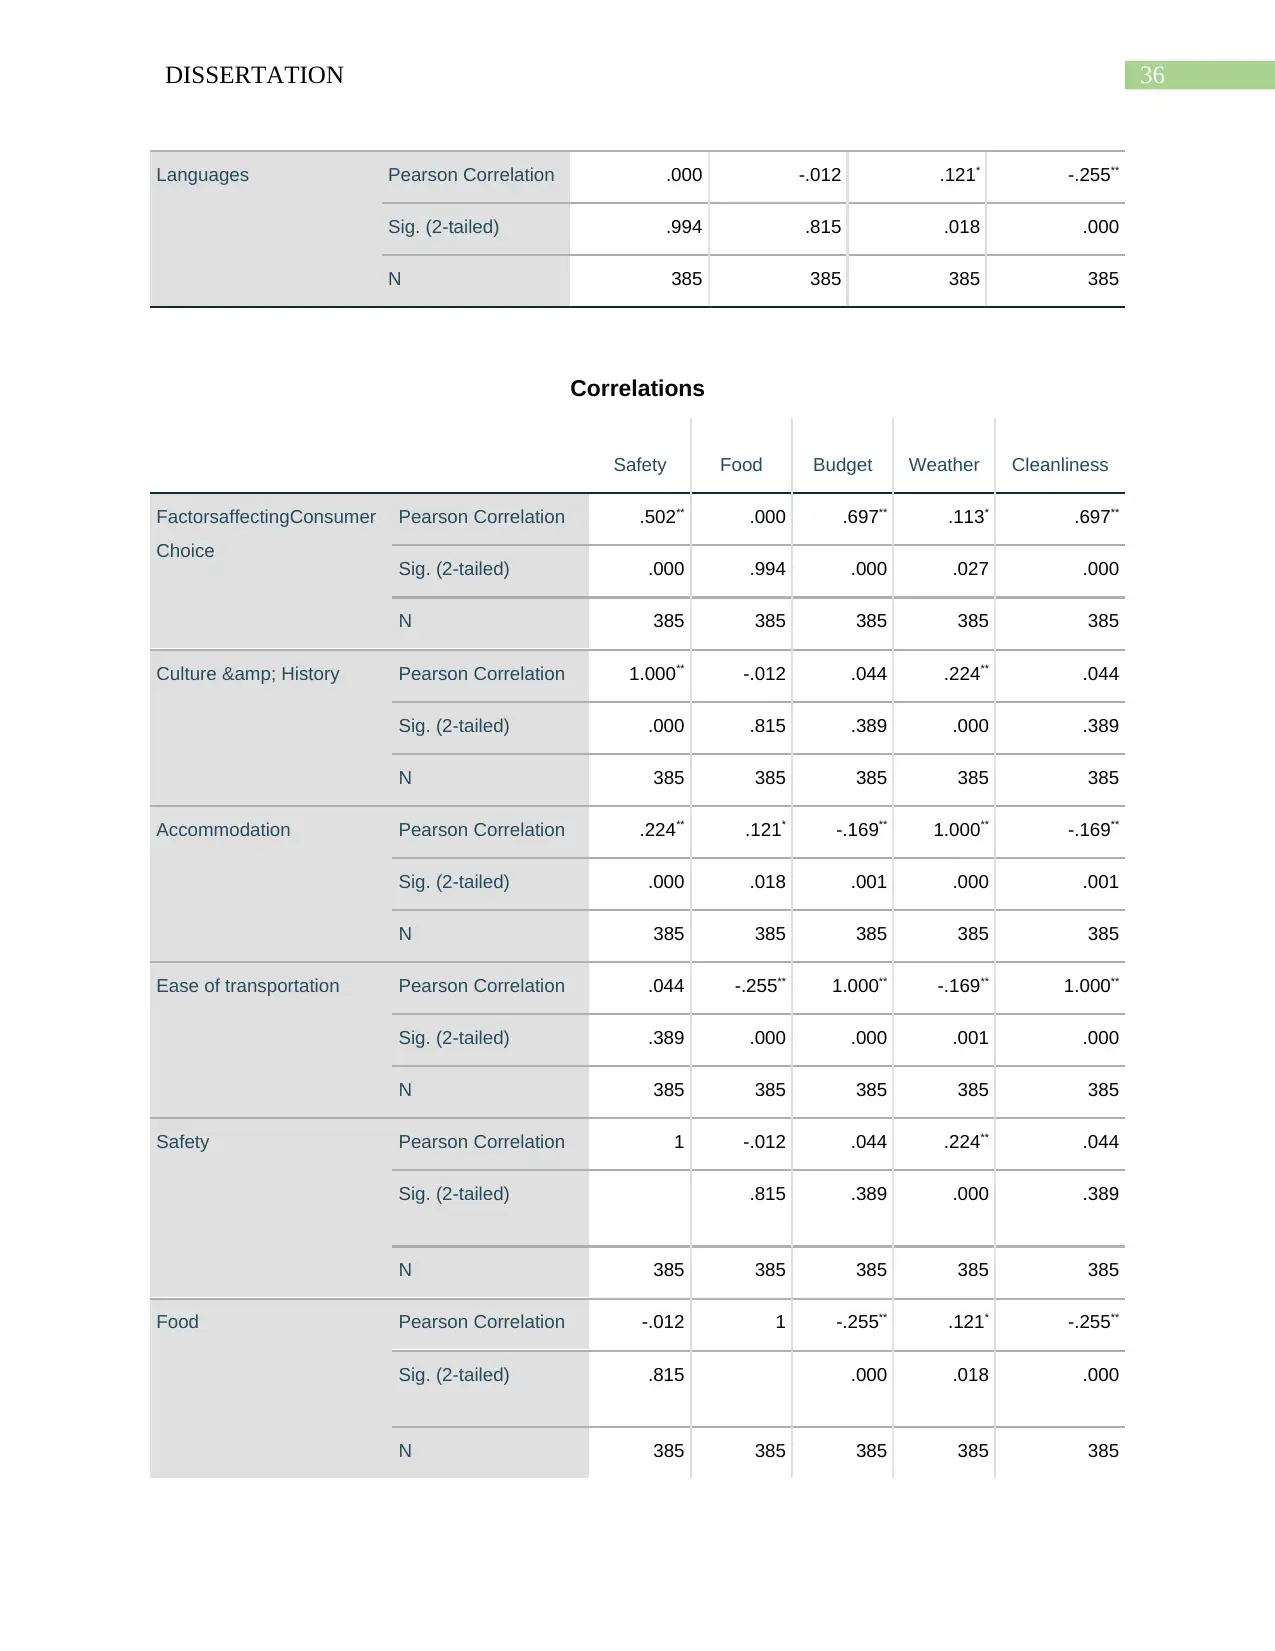
36DISSERTATION
Languages Pearson Correlation .000 -.012 .121* -.255**
Sig. (2-tailed) .994 .815 .018 .000
N 385 385 385 385
Correlations
Safety Food Budget Weather Cleanliness
FactorsaffectingConsumer
Choice
Pearson Correlation .502** .000 .697** .113* .697**
Sig. (2-tailed) .000 .994 .000 .027 .000
N 385 385 385 385 385
Culture & History Pearson Correlation 1.000** -.012 .044 .224** .044
Sig. (2-tailed) .000 .815 .389 .000 .389
N 385 385 385 385 385
Accommodation Pearson Correlation .224** .121* -.169** 1.000** -.169**
Sig. (2-tailed) .000 .018 .001 .000 .001
N 385 385 385 385 385
Ease of transportation Pearson Correlation .044 -.255** 1.000** -.169** 1.000**
Sig. (2-tailed) .389 .000 .000 .001 .000
N 385 385 385 385 385
Safety Pearson Correlation 1 -.012 .044 .224** .044
Sig. (2-tailed) .815 .389 .000 .389
N 385 385 385 385 385
Food Pearson Correlation -.012 1 -.255** .121* -.255**
Sig. (2-tailed) .815 .000 .018 .000
N 385 385 385 385 385
Paraphrase This Document
Need a fresh take? Get an instant paraphrase of this document with our AI Paraphraser
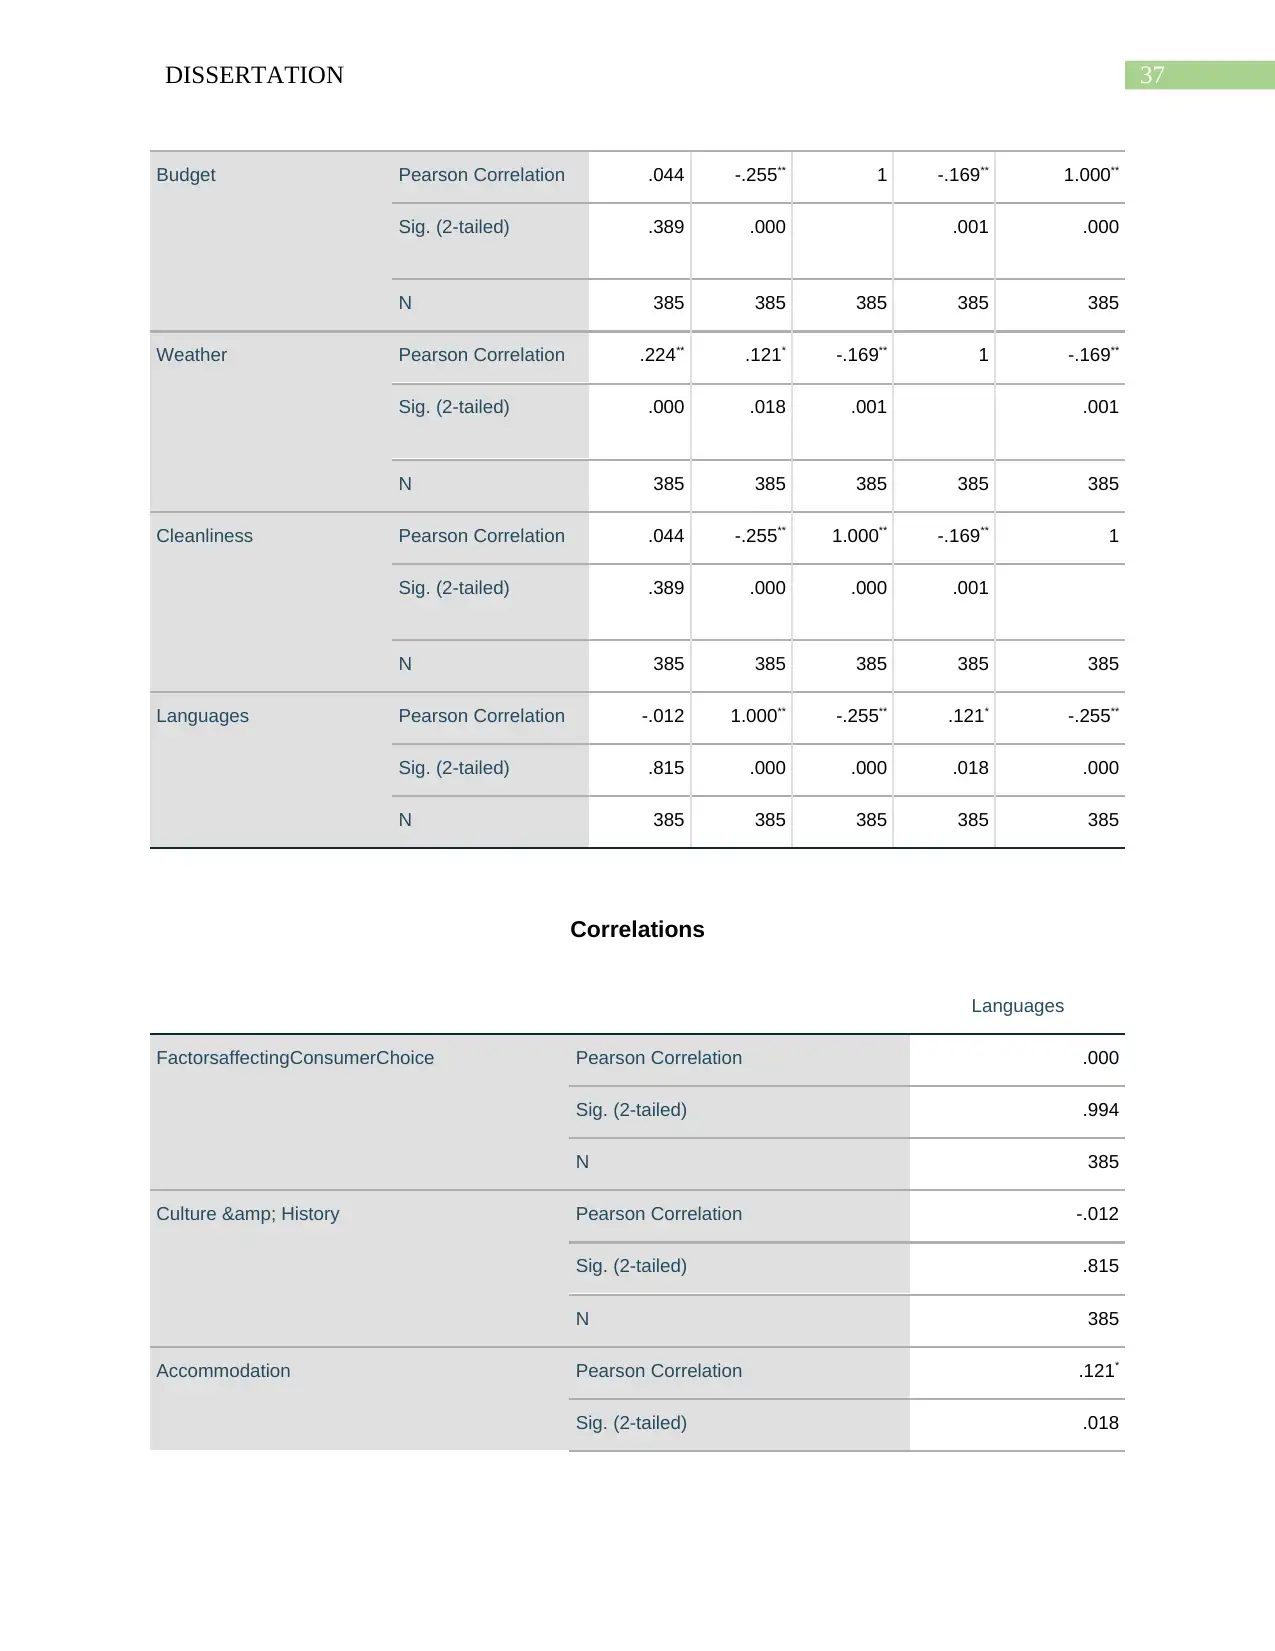
37DISSERTATION
Budget Pearson Correlation .044 -.255** 1 -.169** 1.000**
Sig. (2-tailed) .389 .000 .001 .000
N 385 385 385 385 385
Weather Pearson Correlation .224** .121* -.169** 1 -.169**
Sig. (2-tailed) .000 .018 .001 .001
N 385 385 385 385 385
Cleanliness Pearson Correlation .044 -.255** 1.000** -.169** 1
Sig. (2-tailed) .389 .000 .000 .001
N 385 385 385 385 385
Languages Pearson Correlation -.012 1.000** -.255** .121* -.255**
Sig. (2-tailed) .815 .000 .000 .018 .000
N 385 385 385 385 385
Correlations
Languages
FactorsaffectingConsumerChoice Pearson Correlation .000
Sig. (2-tailed) .994
N 385
Culture & History Pearson Correlation -.012
Sig. (2-tailed) .815
N 385
Accommodation Pearson Correlation .121*
Sig. (2-tailed) .018
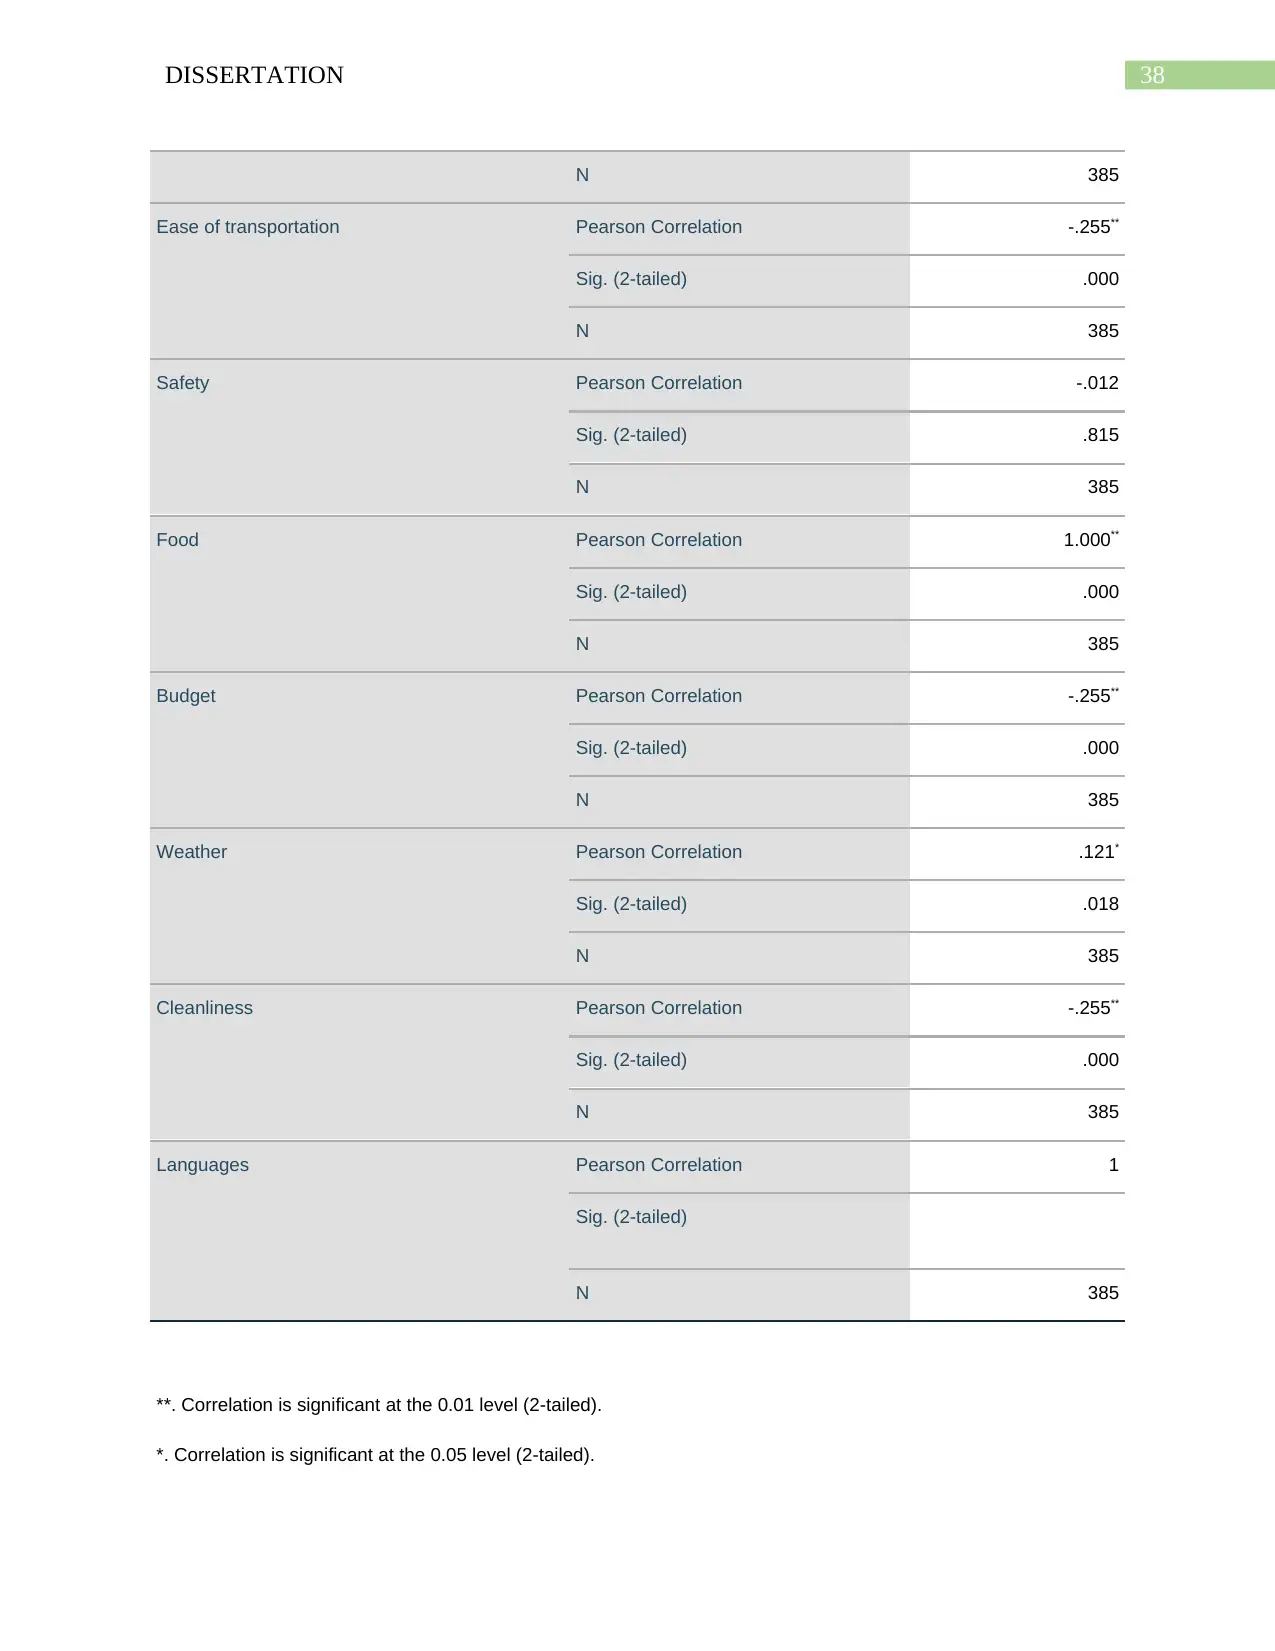
38DISSERTATION
N 385
Ease of transportation Pearson Correlation -.255**
Sig. (2-tailed) .000
N 385
Safety Pearson Correlation -.012
Sig. (2-tailed) .815
N 385
Food Pearson Correlation 1.000**
Sig. (2-tailed) .000
N 385
Budget Pearson Correlation -.255**
Sig. (2-tailed) .000
N 385
Weather Pearson Correlation .121*
Sig. (2-tailed) .018
N 385
Cleanliness Pearson Correlation -.255**
Sig. (2-tailed) .000
N 385
Languages Pearson Correlation 1
Sig. (2-tailed)
N 385
**. Correlation is significant at the 0.01 level (2-tailed).
*. Correlation is significant at the 0.05 level (2-tailed).
N 385
Ease of transportation Pearson Correlation -.255**
Sig. (2-tailed) .000
N 385
Safety Pearson Correlation -.012
Sig. (2-tailed) .815
N 385
Food Pearson Correlation 1.000**
Sig. (2-tailed) .000
N 385
Budget Pearson Correlation -.255**
Sig. (2-tailed) .000
N 385
Weather Pearson Correlation .121*
Sig. (2-tailed) .018
N 385
Cleanliness Pearson Correlation -.255**
Sig. (2-tailed) .000
N 385
Languages Pearson Correlation 1
Sig. (2-tailed)
N 385
**. Correlation is significant at the 0.01 level (2-tailed).
*. Correlation is significant at the 0.05 level (2-tailed).
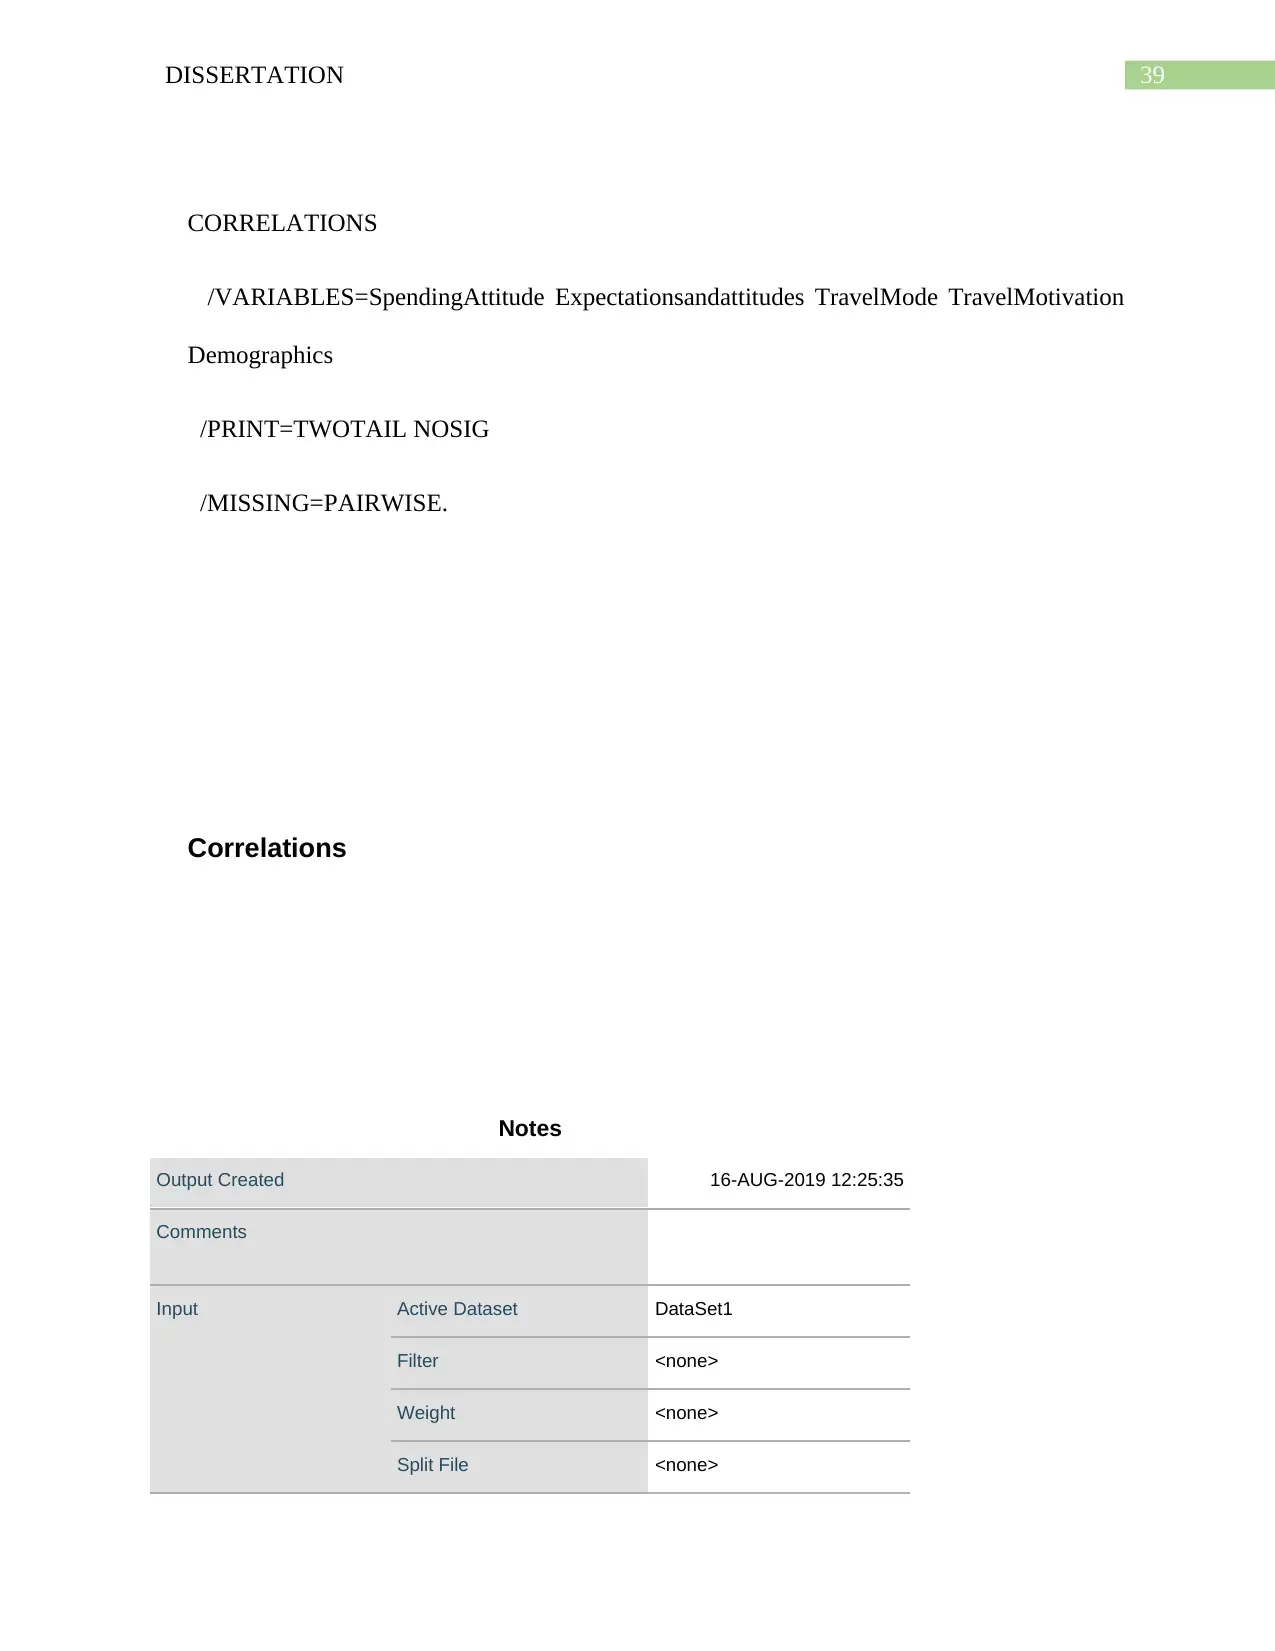
39DISSERTATION
CORRELATIONS
/VARIABLES=SpendingAttitude Expectationsandattitudes TravelMode TravelMotivation
Demographics
/PRINT=TWOTAIL NOSIG
/MISSING=PAIRWISE.
Correlations
Notes
Output Created 16-AUG-2019 12:25:35
Comments
Input Active Dataset DataSet1
Filter <none>
Weight <none>
Split File <none>
CORRELATIONS
/VARIABLES=SpendingAttitude Expectationsandattitudes TravelMode TravelMotivation
Demographics
/PRINT=TWOTAIL NOSIG
/MISSING=PAIRWISE.
Correlations
Notes
Output Created 16-AUG-2019 12:25:35
Comments
Input Active Dataset DataSet1
Filter <none>
Weight <none>
Split File <none>
Secure Best Marks with AI Grader
Need help grading? Try our AI Grader for instant feedback on your assignments.
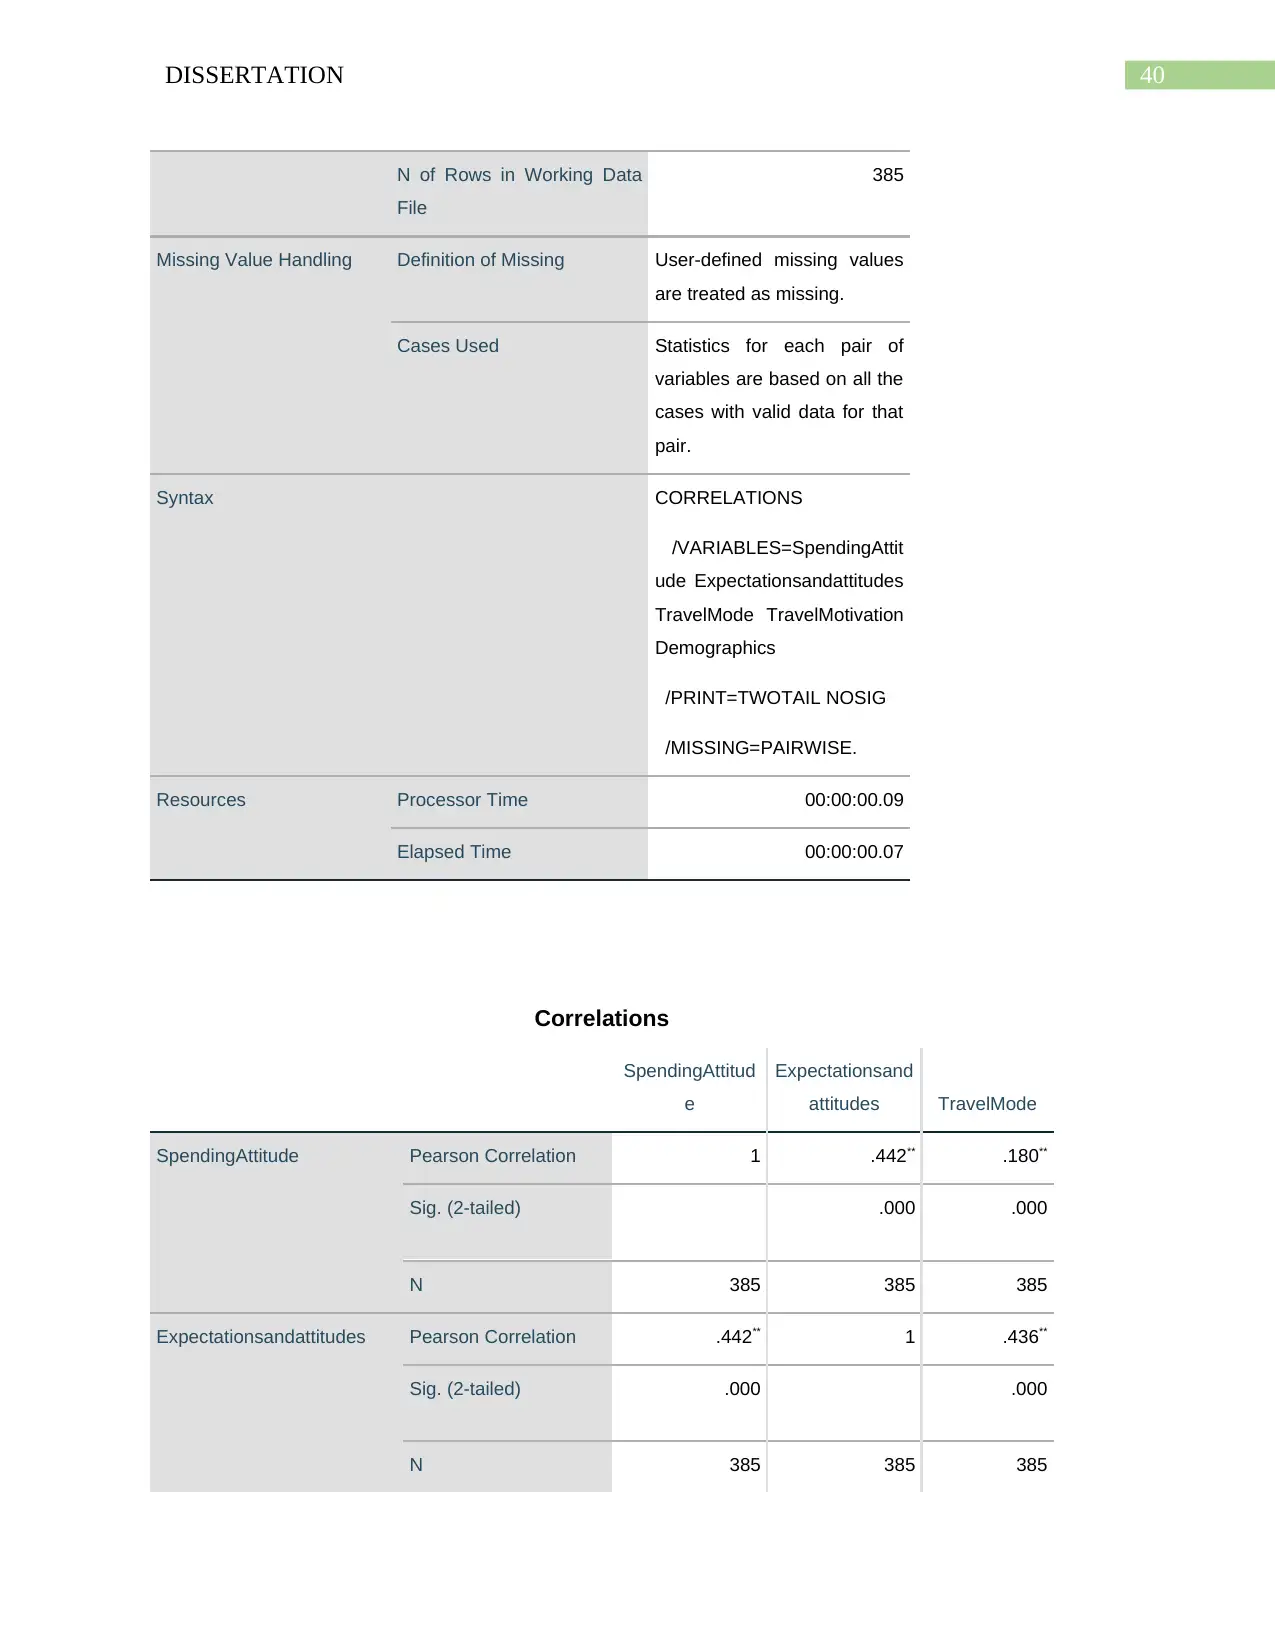
40DISSERTATION
N of Rows in Working Data
File
385
Missing Value Handling Definition of Missing User-defined missing values
are treated as missing.
Cases Used Statistics for each pair of
variables are based on all the
cases with valid data for that
pair.
Syntax CORRELATIONS
/VARIABLES=SpendingAttit
ude Expectationsandattitudes
TravelMode TravelMotivation
Demographics
/PRINT=TWOTAIL NOSIG
/MISSING=PAIRWISE.
Resources Processor Time 00:00:00.09
Elapsed Time 00:00:00.07
Correlations
SpendingAttitud
e
Expectationsand
attitudes TravelMode
SpendingAttitude Pearson Correlation 1 .442** .180**
Sig. (2-tailed) .000 .000
N 385 385 385
Expectationsandattitudes Pearson Correlation .442** 1 .436**
Sig. (2-tailed) .000 .000
N 385 385 385
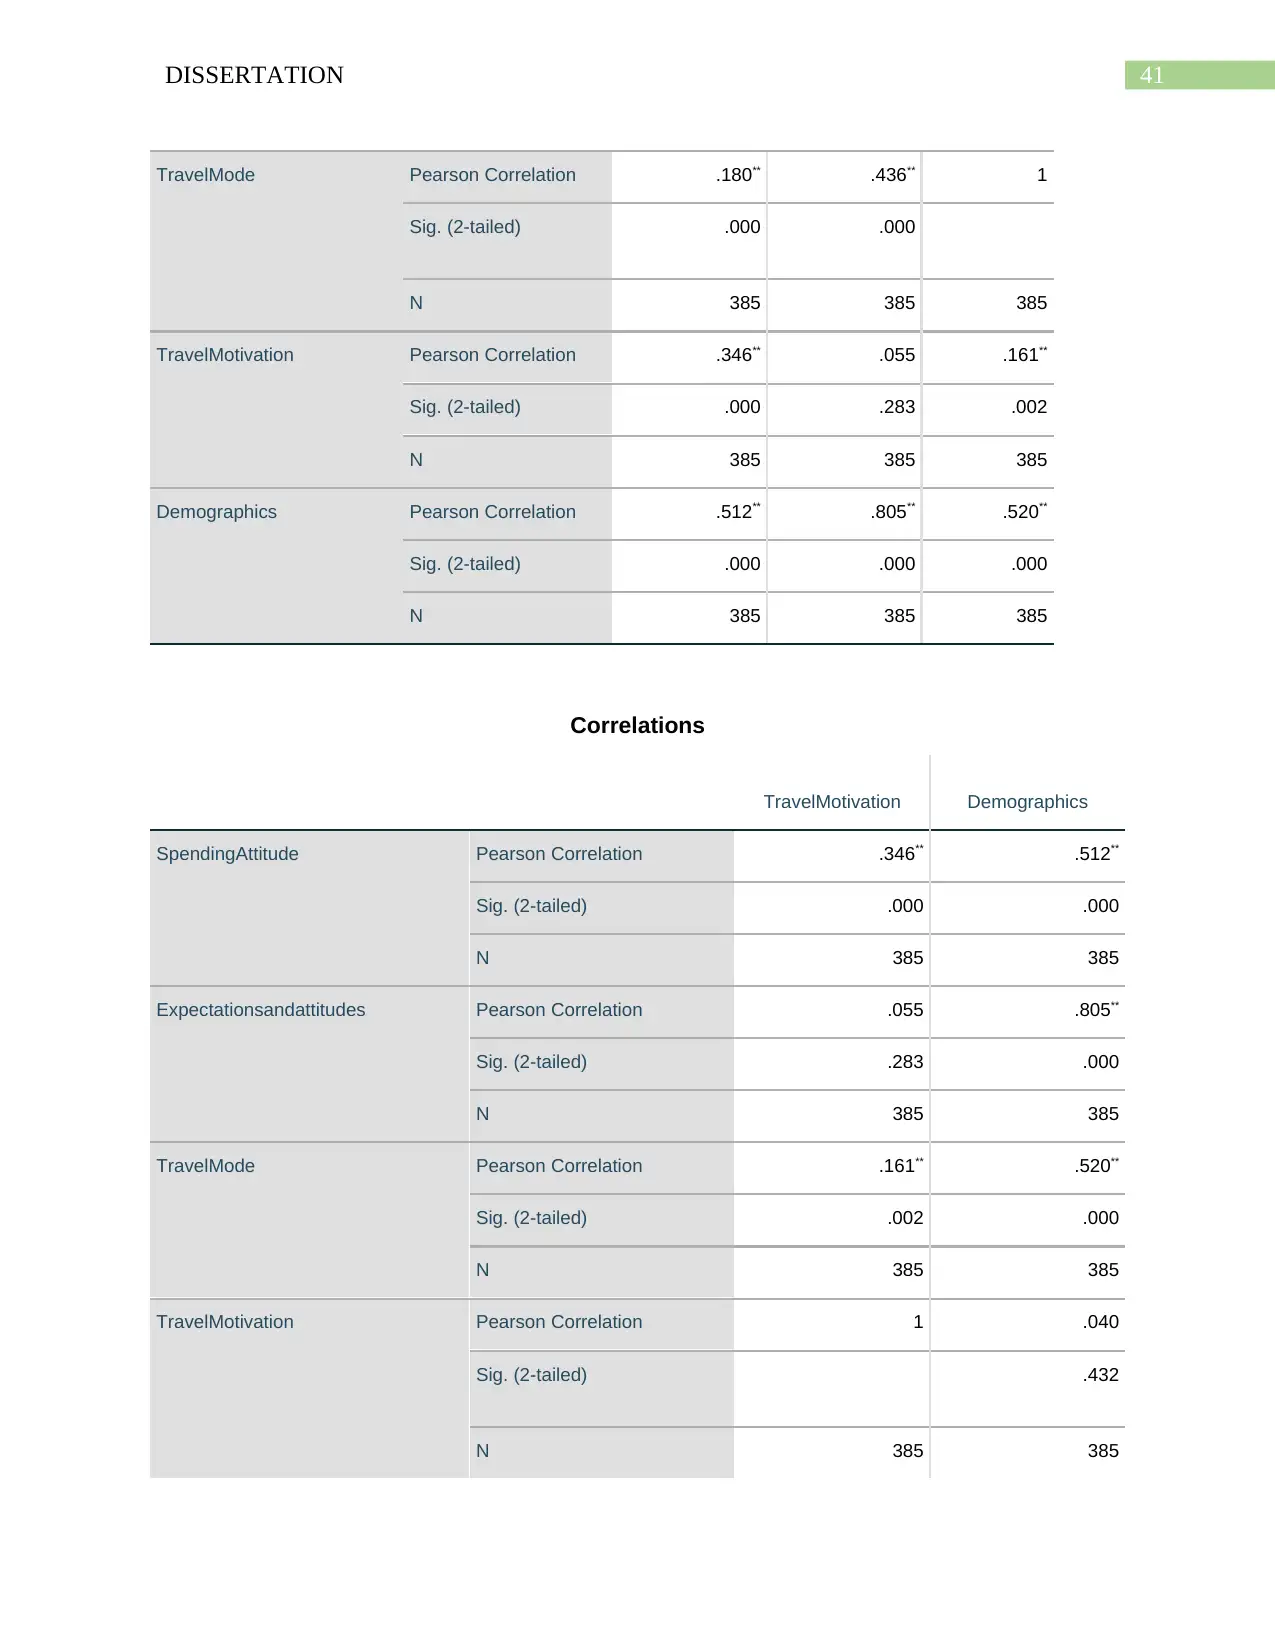
41DISSERTATION
TravelMode Pearson Correlation .180** .436** 1
Sig. (2-tailed) .000 .000
N 385 385 385
TravelMotivation Pearson Correlation .346** .055 .161**
Sig. (2-tailed) .000 .283 .002
N 385 385 385
Demographics Pearson Correlation .512** .805** .520**
Sig. (2-tailed) .000 .000 .000
N 385 385 385
Correlations
TravelMotivation Demographics
SpendingAttitude Pearson Correlation .346** .512**
Sig. (2-tailed) .000 .000
N 385 385
Expectationsandattitudes Pearson Correlation .055 .805**
Sig. (2-tailed) .283 .000
N 385 385
TravelMode Pearson Correlation .161** .520**
Sig. (2-tailed) .002 .000
N 385 385
TravelMotivation Pearson Correlation 1 .040
Sig. (2-tailed) .432
N 385 385
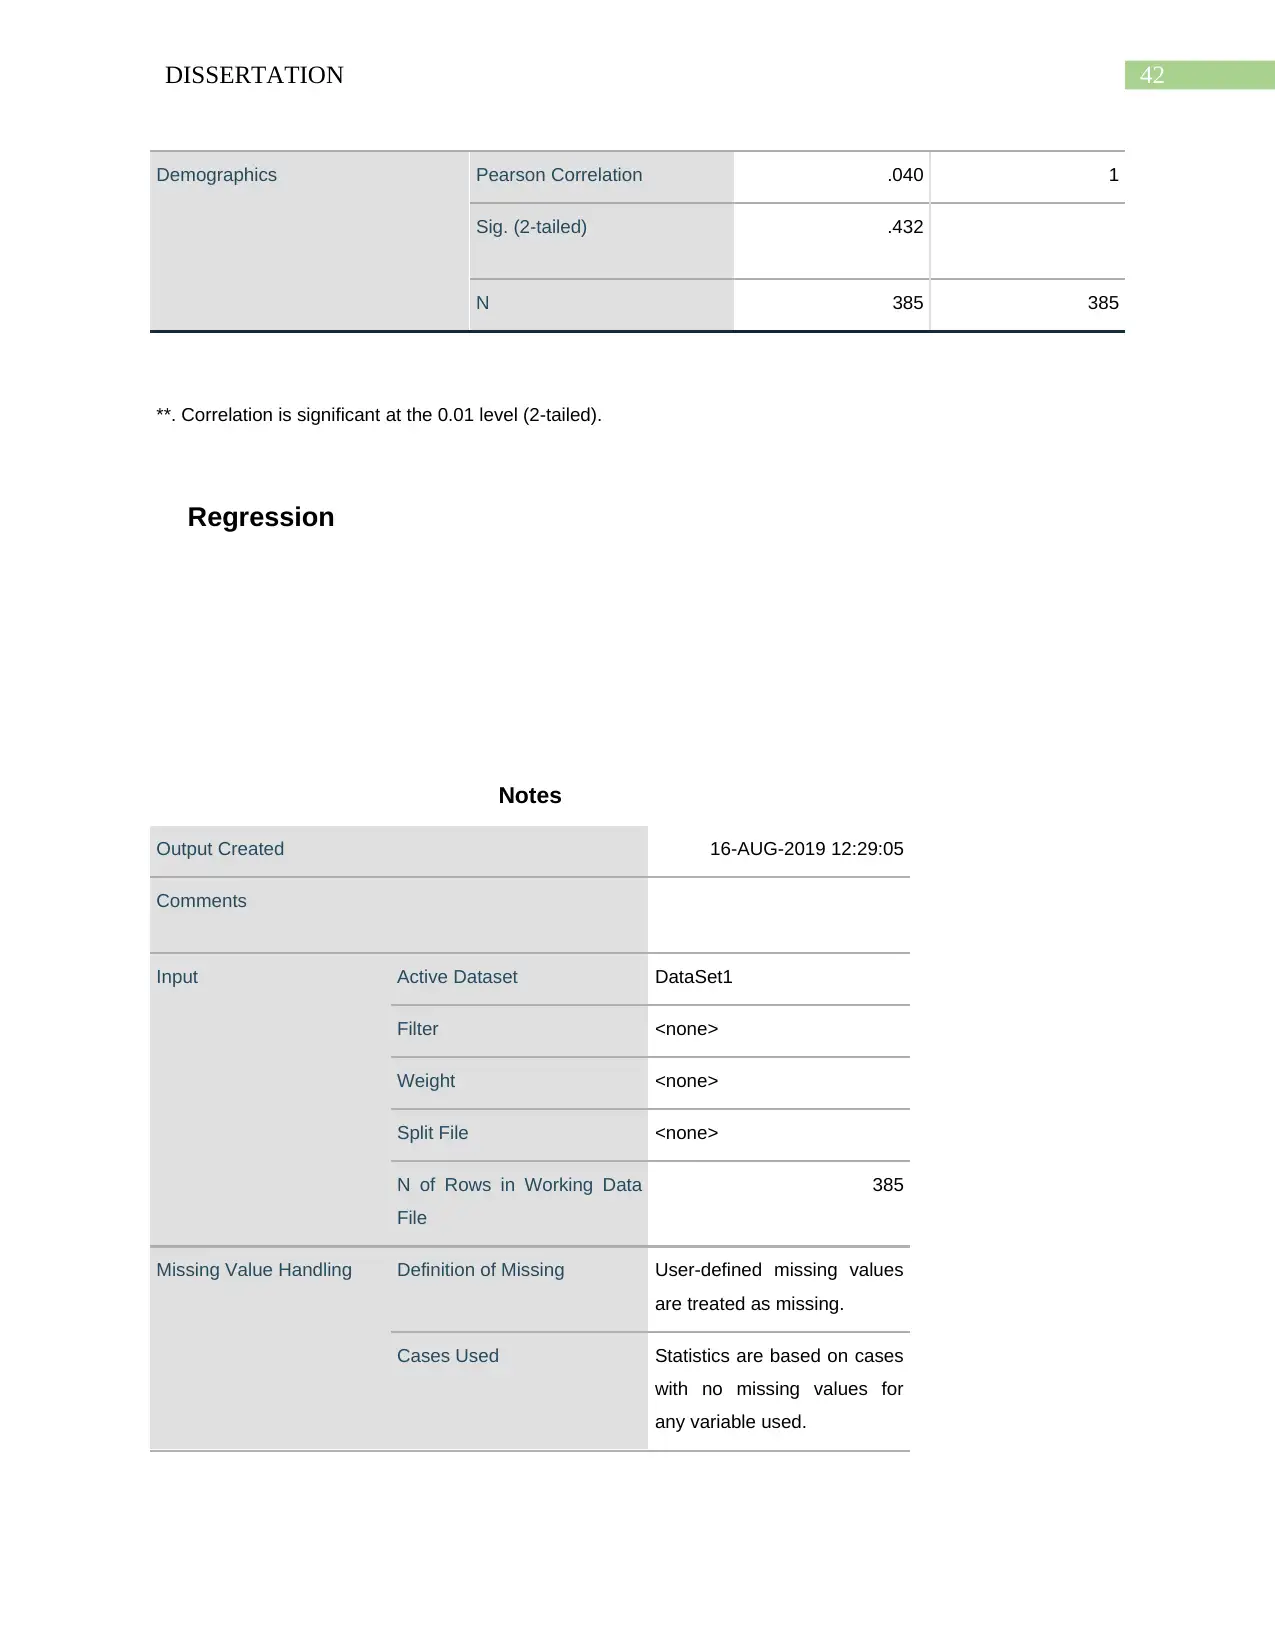
42DISSERTATION
Demographics Pearson Correlation .040 1
Sig. (2-tailed) .432
N 385 385
**. Correlation is significant at the 0.01 level (2-tailed).
Regression
Notes
Output Created 16-AUG-2019 12:29:05
Comments
Input Active Dataset DataSet1
Filter <none>
Weight <none>
Split File <none>
N of Rows in Working Data
File
385
Missing Value Handling Definition of Missing User-defined missing values
are treated as missing.
Cases Used Statistics are based on cases
with no missing values for
any variable used.
Paraphrase This Document
Need a fresh take? Get an instant paraphrase of this document with our AI Paraphraser
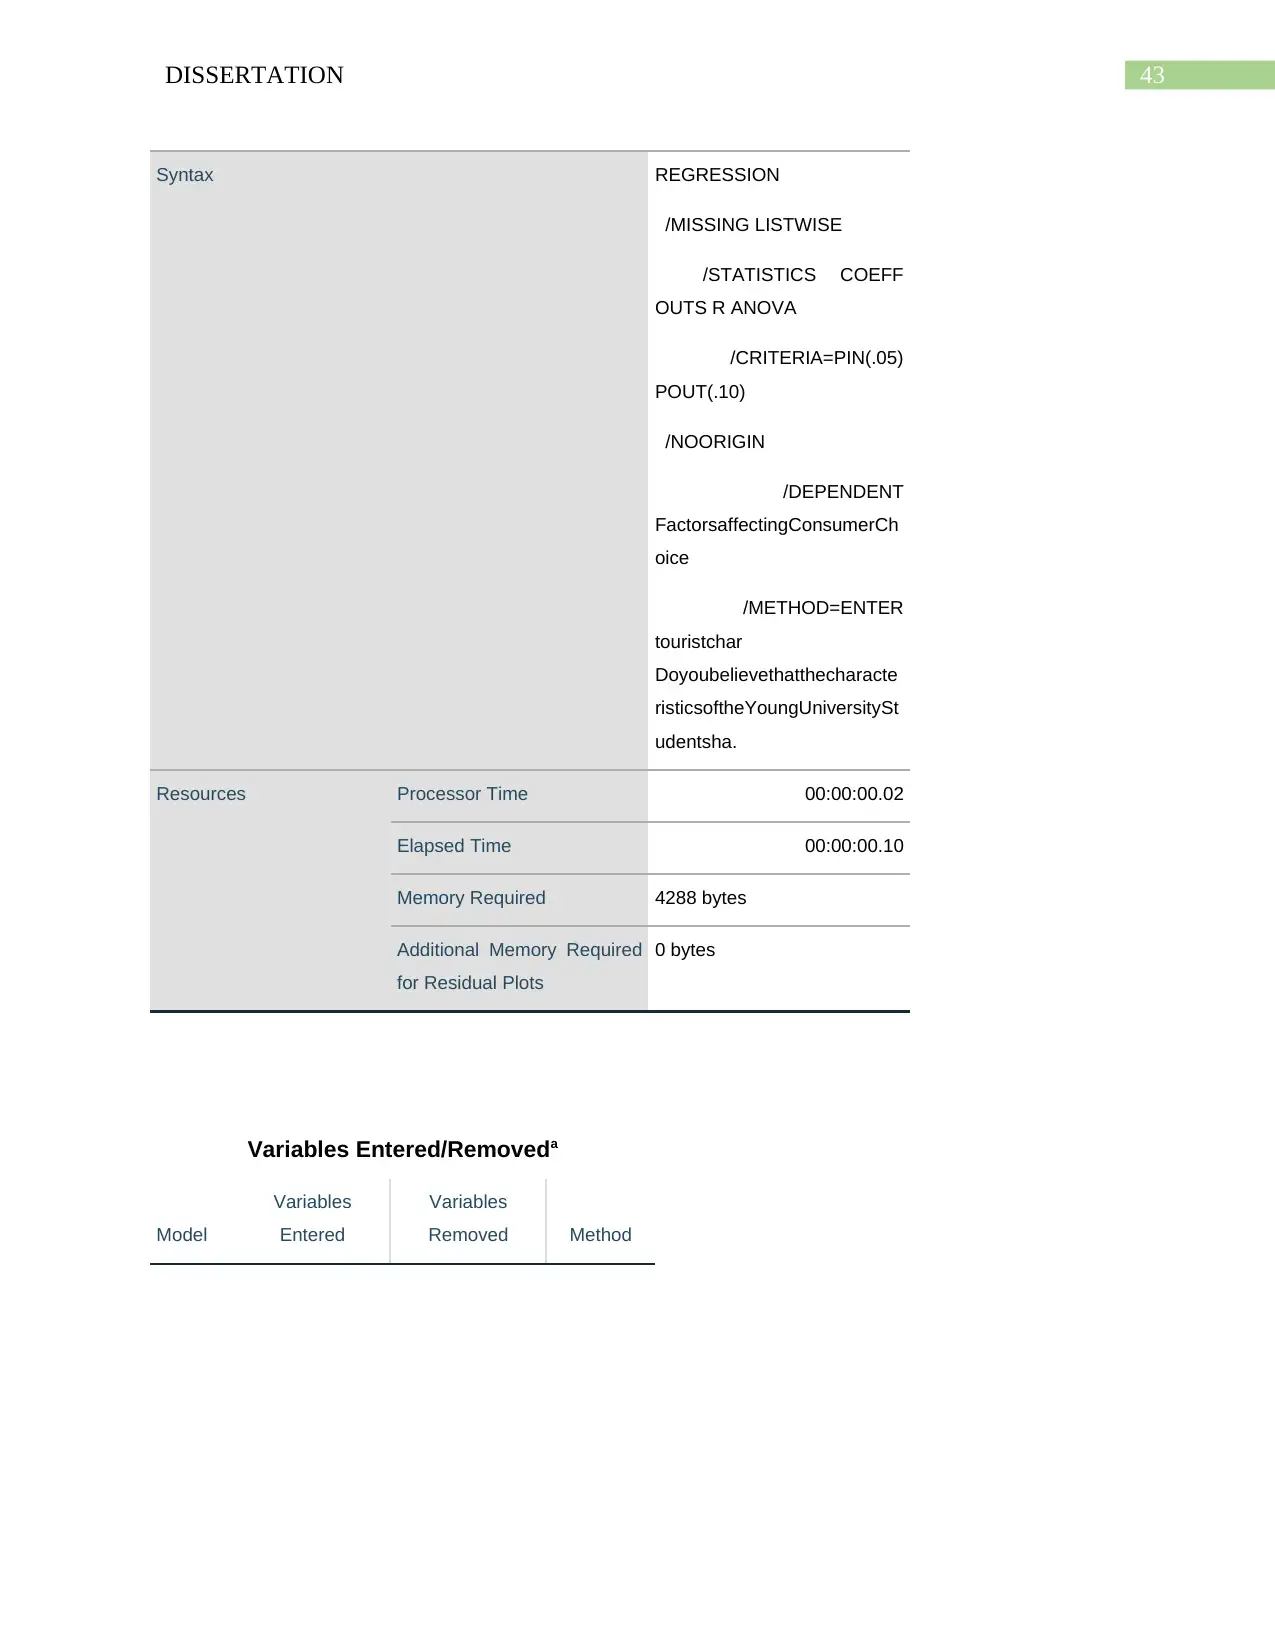
43DISSERTATION
Syntax REGRESSION
/MISSING LISTWISE
/STATISTICS COEFF
OUTS R ANOVA
/CRITERIA=PIN(.05)
POUT(.10)
/NOORIGIN
/DEPENDENT
FactorsaffectingConsumerCh
oice
/METHOD=ENTER
touristchar
Doyoubelievethatthecharacte
risticsoftheYoungUniversitySt
udentsha.
Resources Processor Time 00:00:00.02
Elapsed Time 00:00:00.10
Memory Required 4288 bytes
Additional Memory Required
for Residual Plots
0 bytes
Variables Entered/Removeda
Model
Variables
Entered
Variables
Removed Method
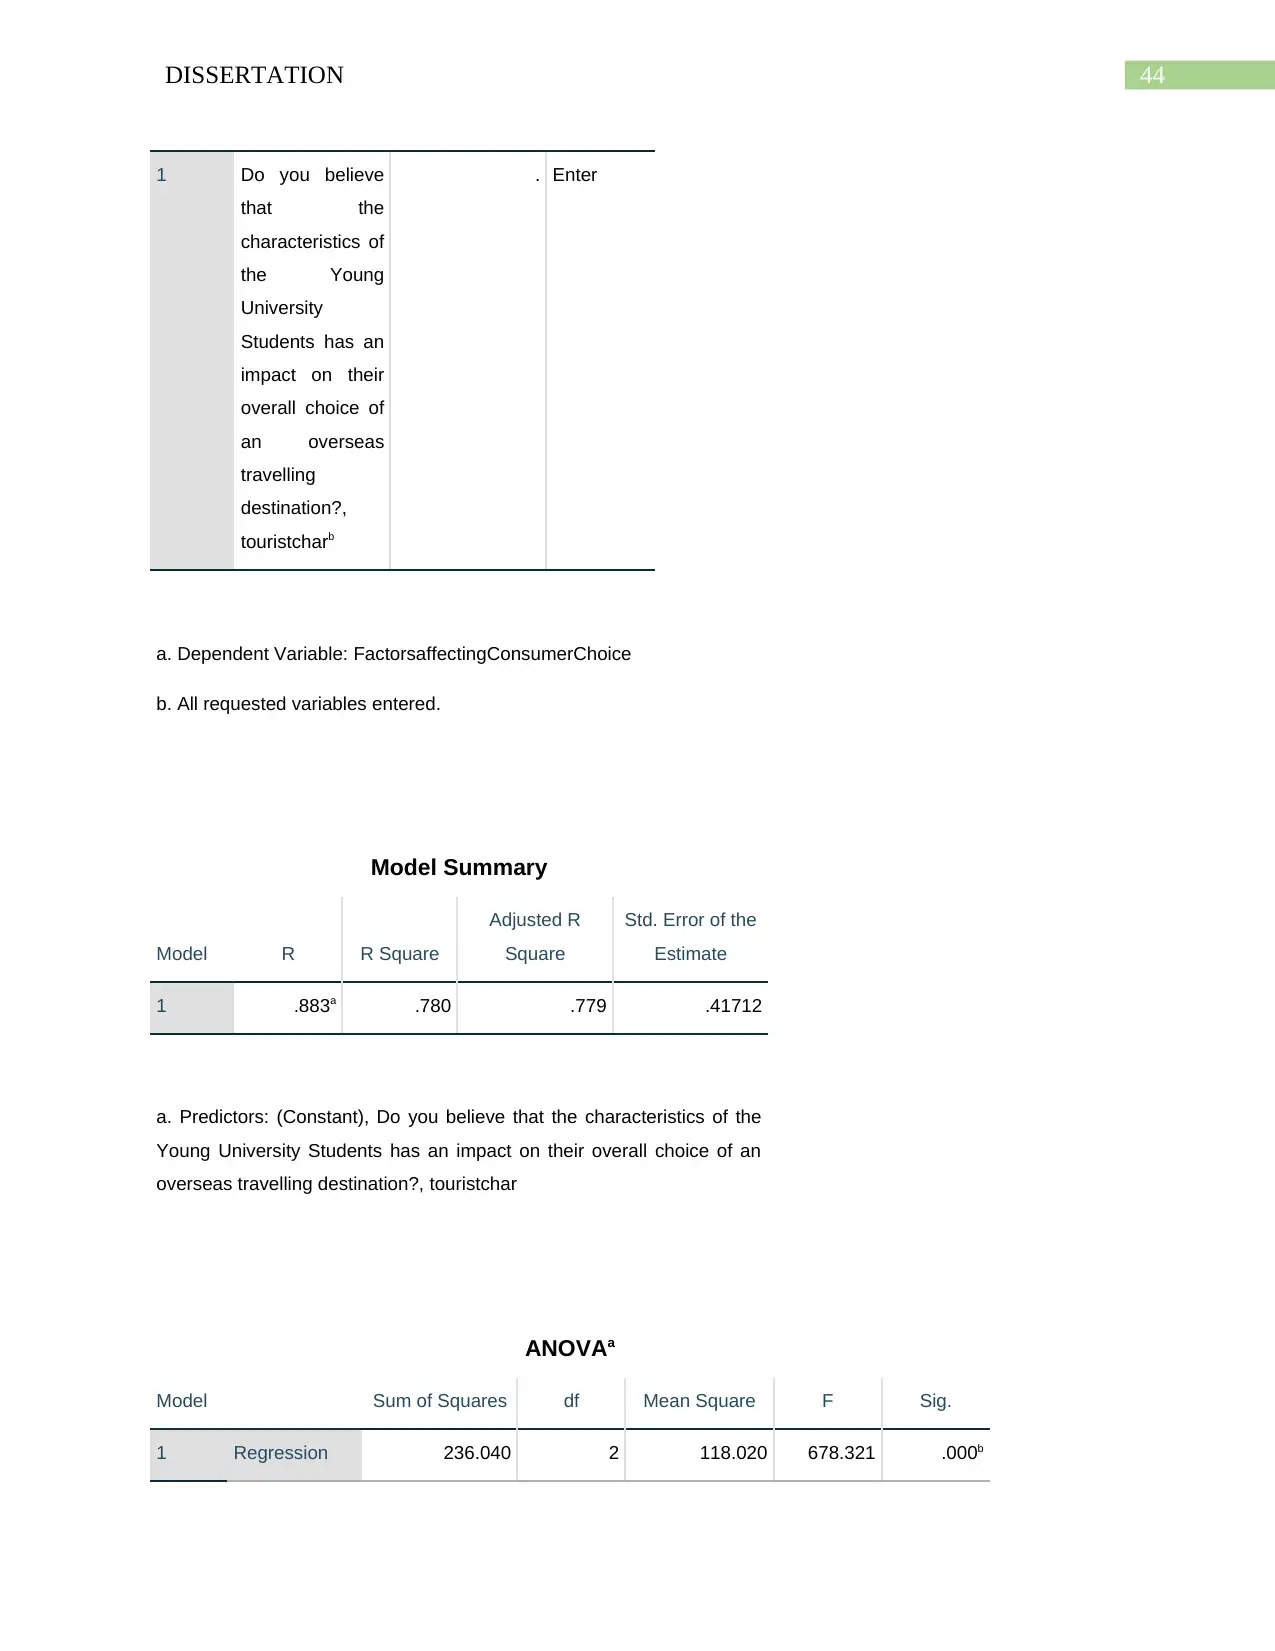
44DISSERTATION
1 Do you believe
that the
characteristics of
the Young
University
Students has an
impact on their
overall choice of
an overseas
travelling
destination?,
touristcharb
. Enter
a. Dependent Variable: FactorsaffectingConsumerChoice
b. All requested variables entered.
Model Summary
Model R R Square
Adjusted R
Square
Std. Error of the
Estimate
1 .883a .780 .779 .41712
a. Predictors: (Constant), Do you believe that the characteristics of the
Young University Students has an impact on their overall choice of an
overseas travelling destination?, touristchar
ANOVAa
Model Sum of Squares df Mean Square F Sig.
1 Regression 236.040 2 118.020 678.321 .000b
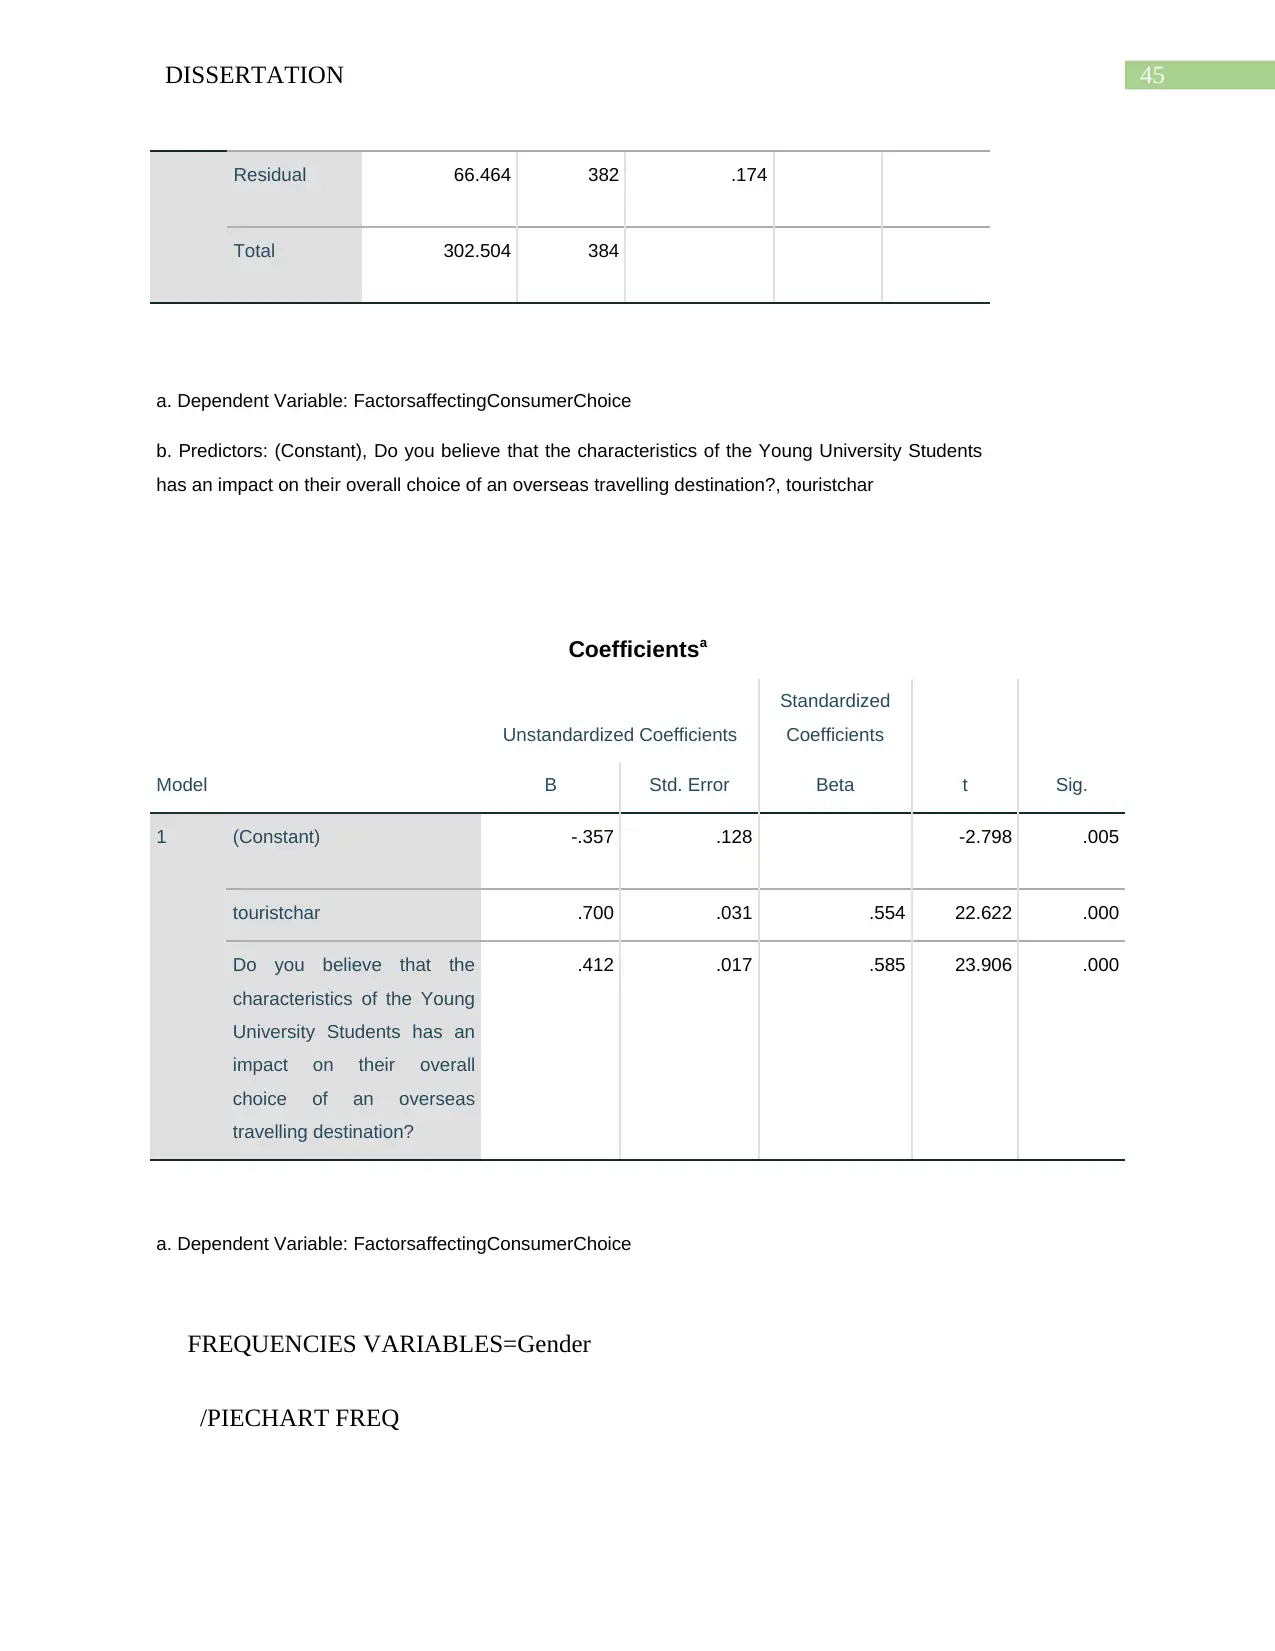
45DISSERTATION
Residual 66.464 382 .174
Total 302.504 384
a. Dependent Variable: FactorsaffectingConsumerChoice
b. Predictors: (Constant), Do you believe that the characteristics of the Young University Students
has an impact on their overall choice of an overseas travelling destination?, touristchar
Coefficientsa
Model
Unstandardized Coefficients
Standardized
Coefficients
t Sig.B Std. Error Beta
1 (Constant) -.357 .128 -2.798 .005
touristchar .700 .031 .554 22.622 .000
Do you believe that the
characteristics of the Young
University Students has an
impact on their overall
choice of an overseas
travelling destination?
.412 .017 .585 23.906 .000
a. Dependent Variable: FactorsaffectingConsumerChoice
FREQUENCIES VARIABLES=Gender
/PIECHART FREQ
Secure Best Marks with AI Grader
Need help grading? Try our AI Grader for instant feedback on your assignments.
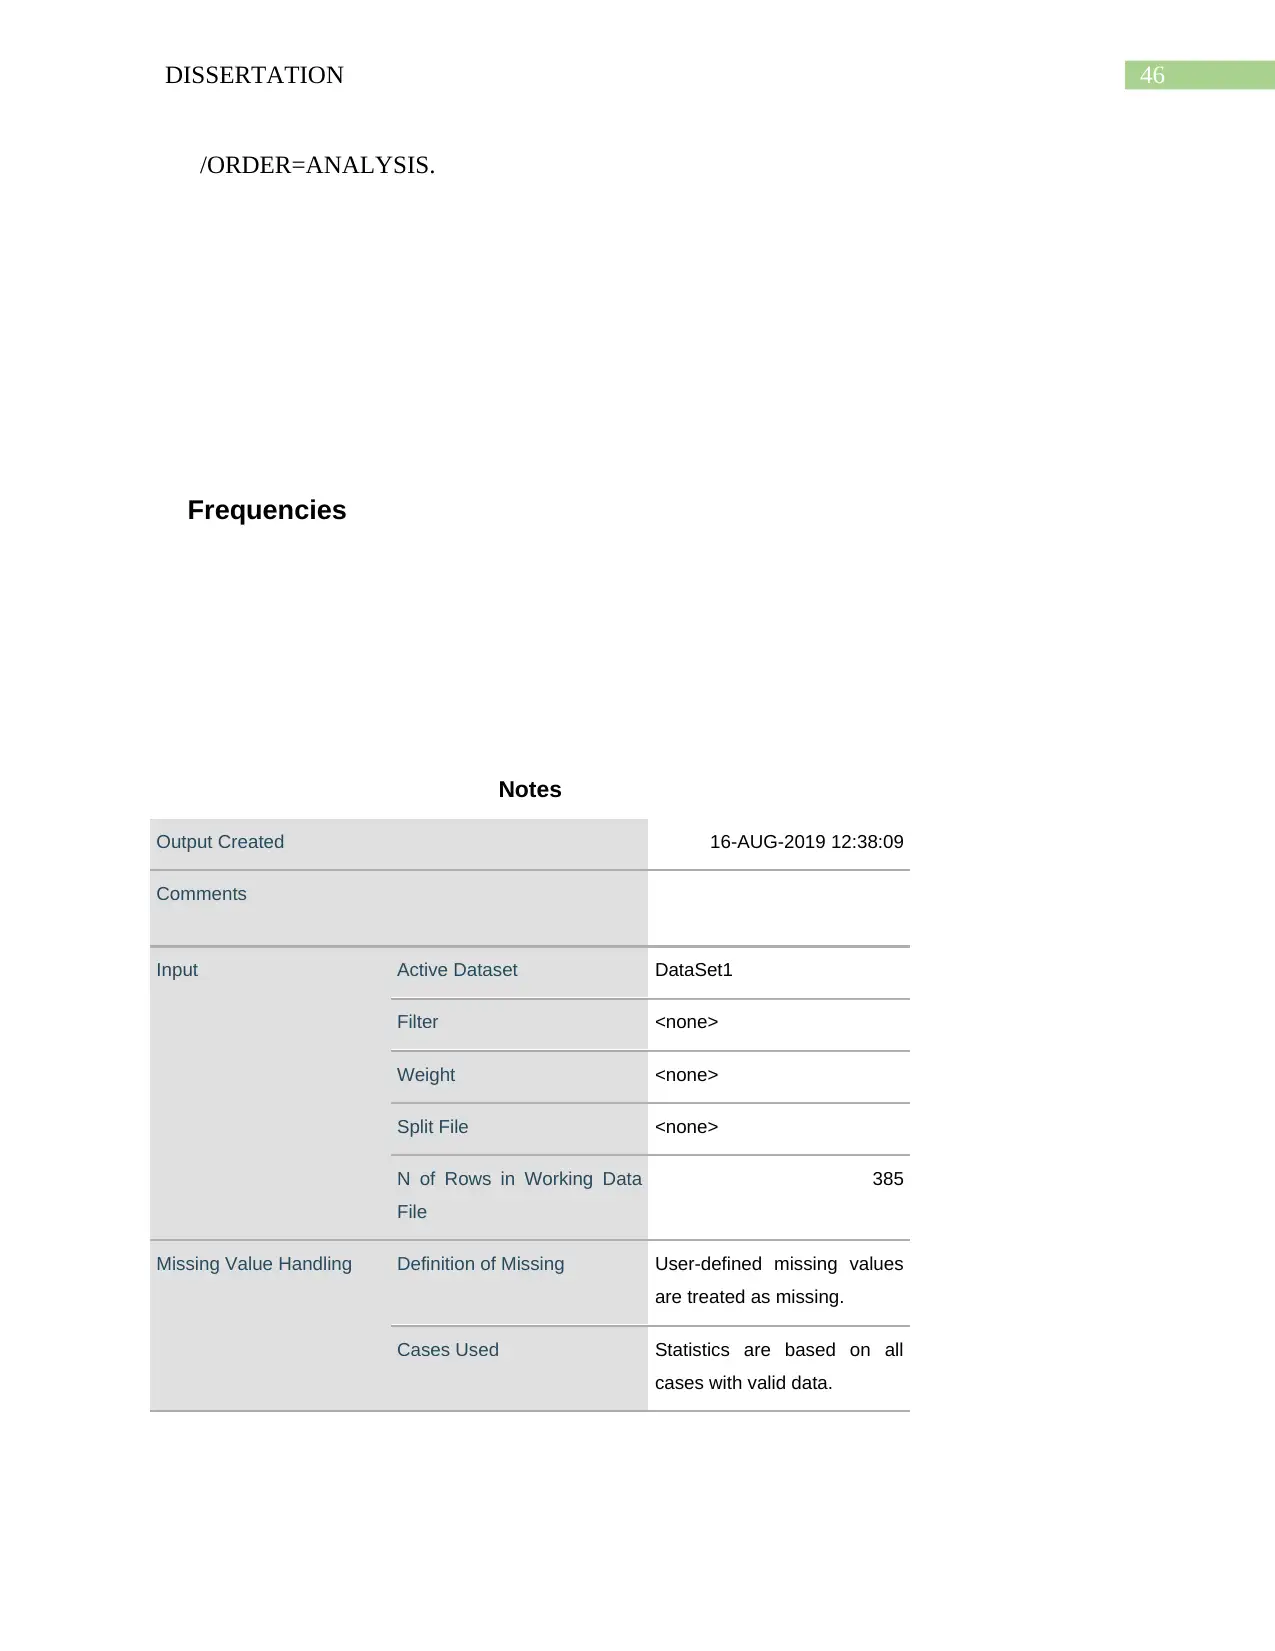
46DISSERTATION
/ORDER=ANALYSIS.
Frequencies
Notes
Output Created 16-AUG-2019 12:38:09
Comments
Input Active Dataset DataSet1
Filter <none>
Weight <none>
Split File <none>
N of Rows in Working Data
File
385
Missing Value Handling Definition of Missing User-defined missing values
are treated as missing.
Cases Used Statistics are based on all
cases with valid data.
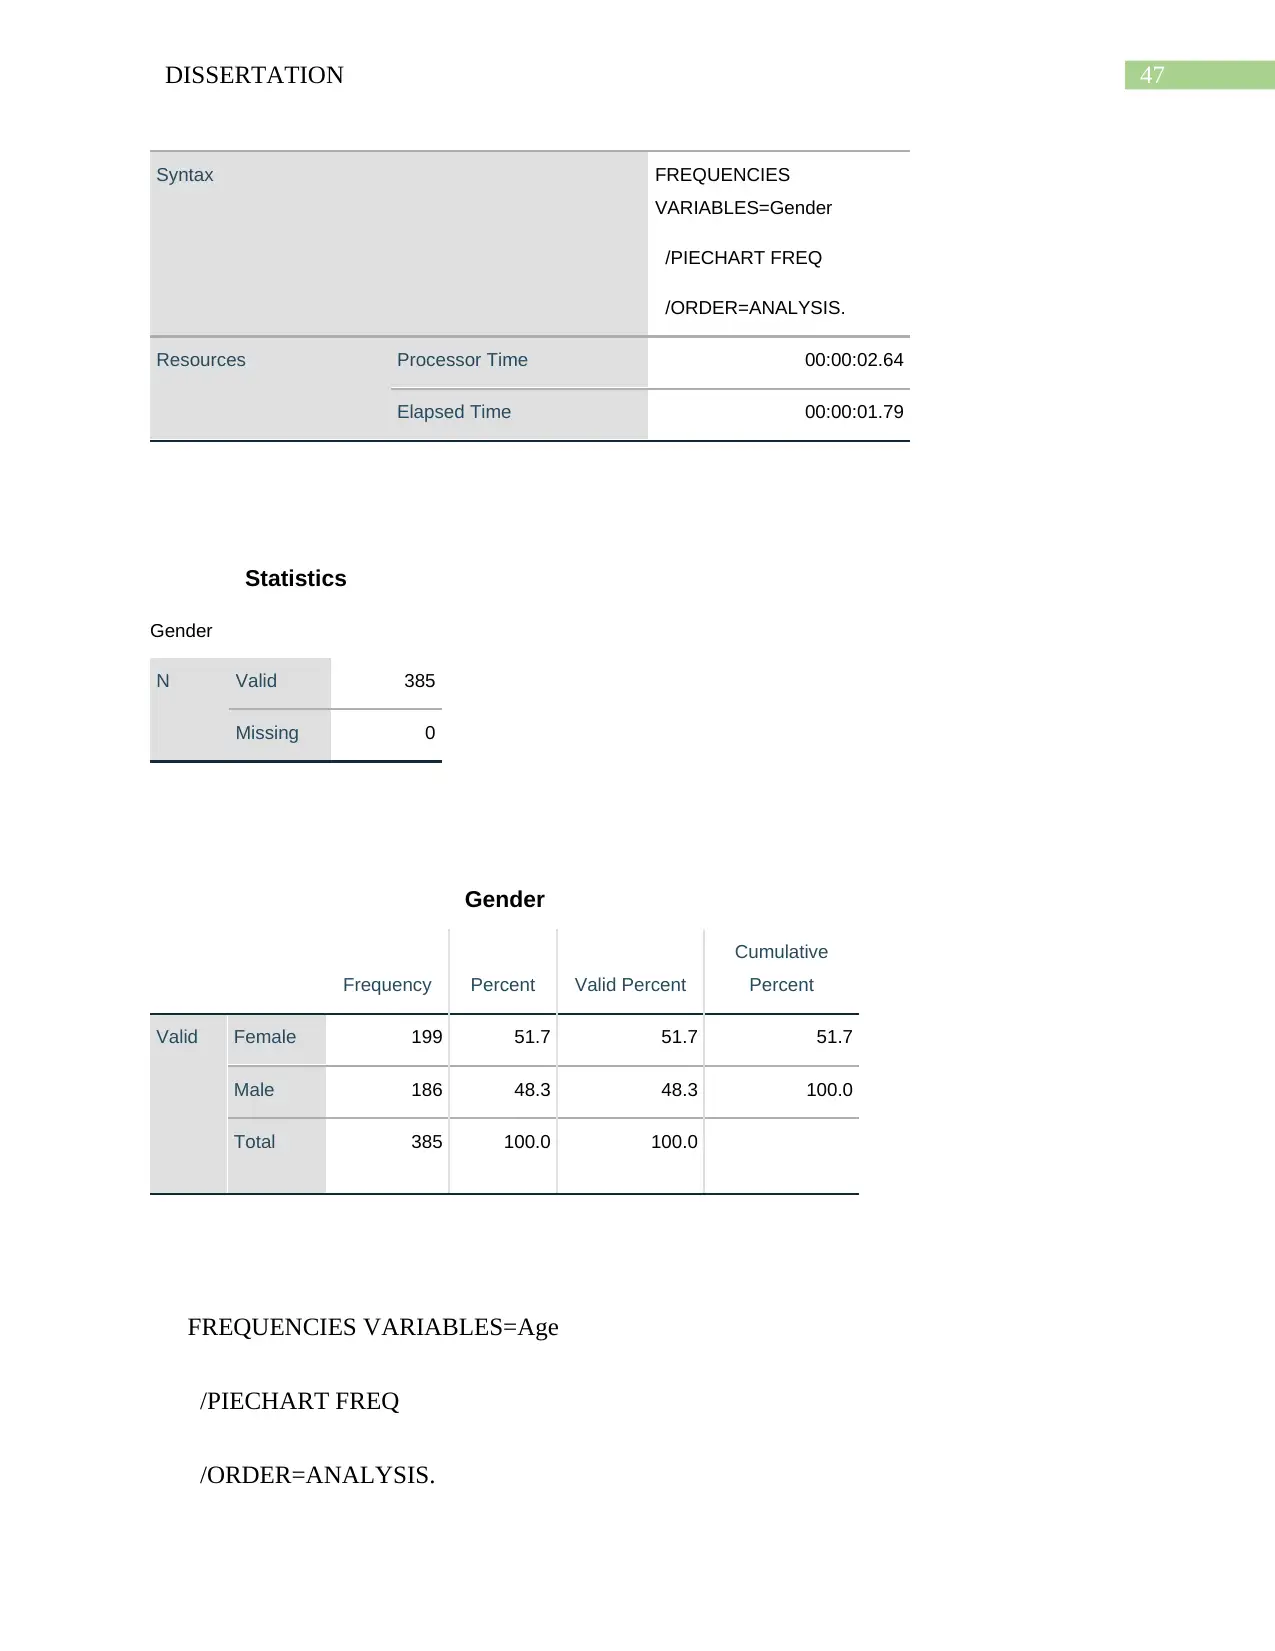
47DISSERTATION
Syntax FREQUENCIES
VARIABLES=Gender
/PIECHART FREQ
/ORDER=ANALYSIS.
Resources Processor Time 00:00:02.64
Elapsed Time 00:00:01.79
Statistics
Gender
N Valid 385
Missing 0
Gender
Frequency Percent Valid Percent
Cumulative
Percent
Valid Female 199 51.7 51.7 51.7
Male 186 48.3 48.3 100.0
Total 385 100.0 100.0
FREQUENCIES VARIABLES=Age
/PIECHART FREQ
/ORDER=ANALYSIS.
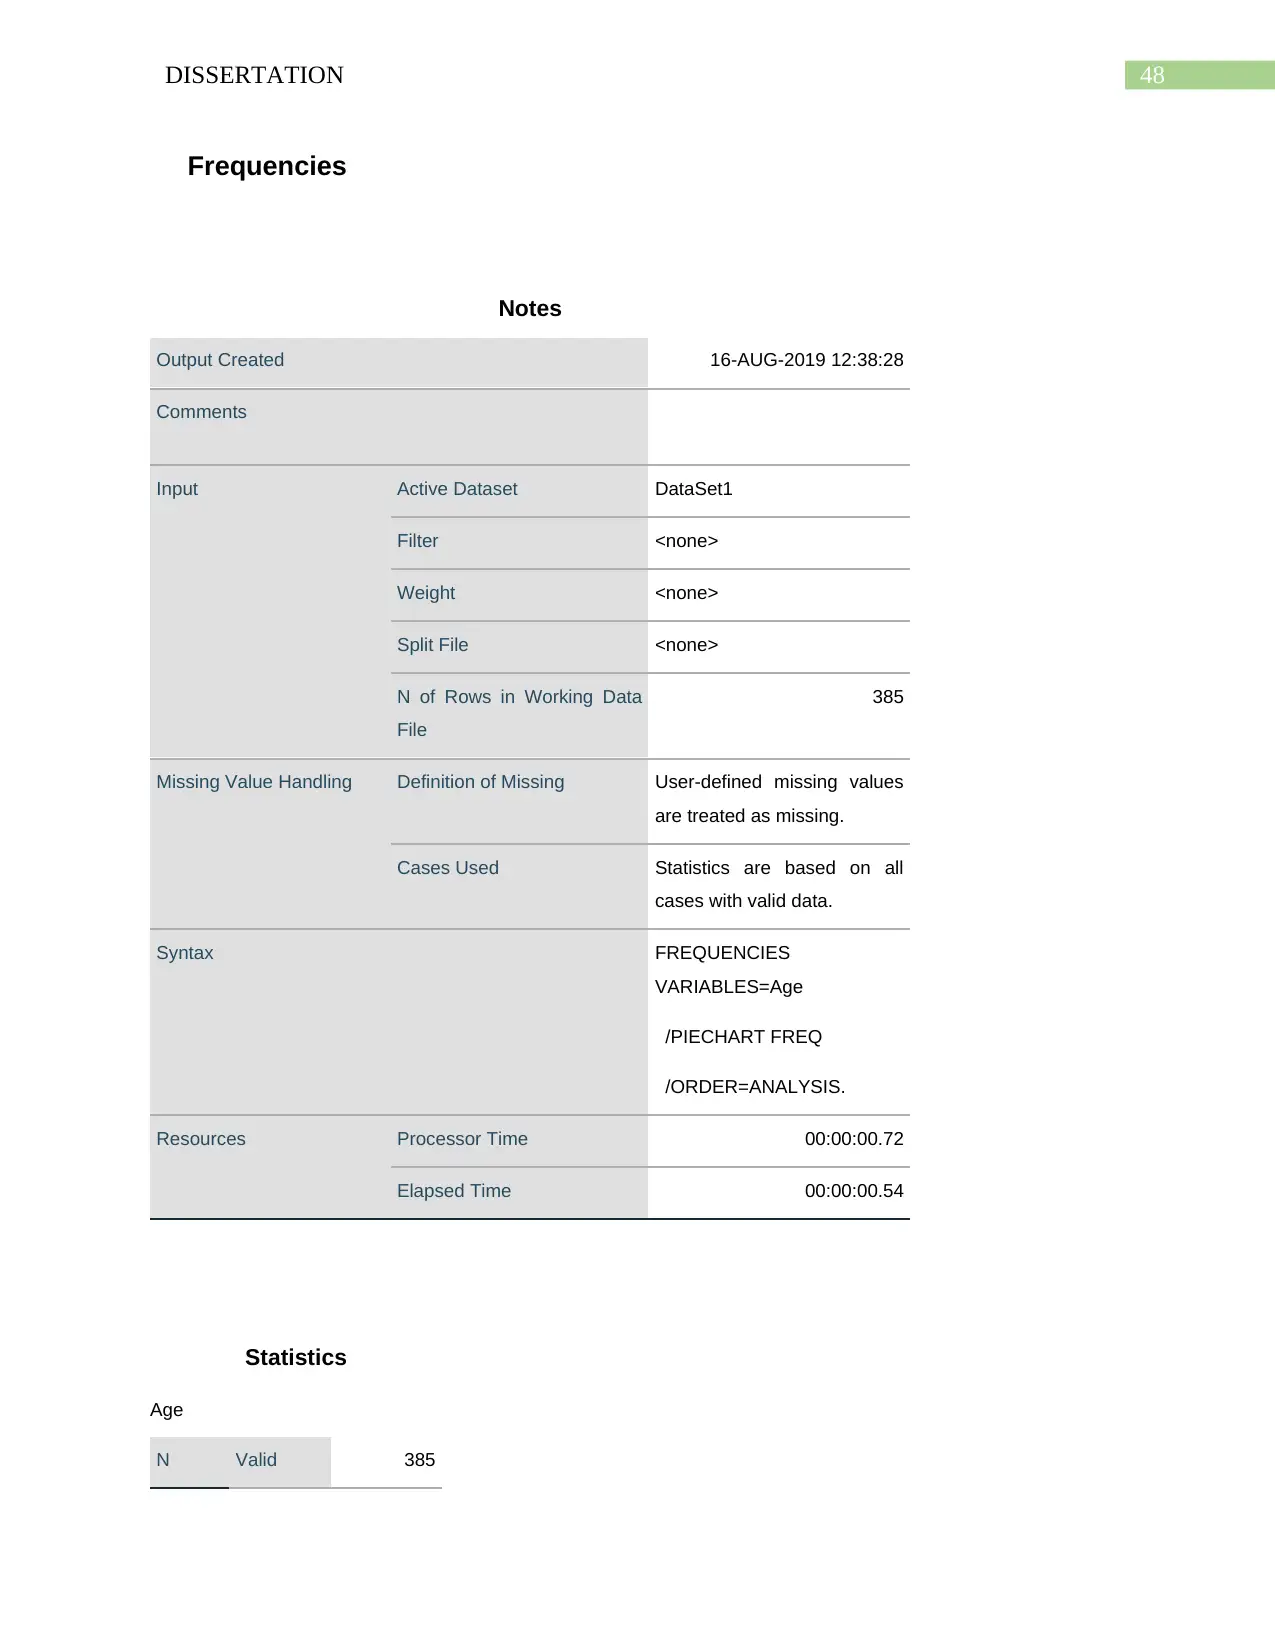
48DISSERTATION
Frequencies
Notes
Output Created 16-AUG-2019 12:38:28
Comments
Input Active Dataset DataSet1
Filter <none>
Weight <none>
Split File <none>
N of Rows in Working Data
File
385
Missing Value Handling Definition of Missing User-defined missing values
are treated as missing.
Cases Used Statistics are based on all
cases with valid data.
Syntax FREQUENCIES
VARIABLES=Age
/PIECHART FREQ
/ORDER=ANALYSIS.
Resources Processor Time 00:00:00.72
Elapsed Time 00:00:00.54
Statistics
Age
N Valid 385
Paraphrase This Document
Need a fresh take? Get an instant paraphrase of this document with our AI Paraphraser
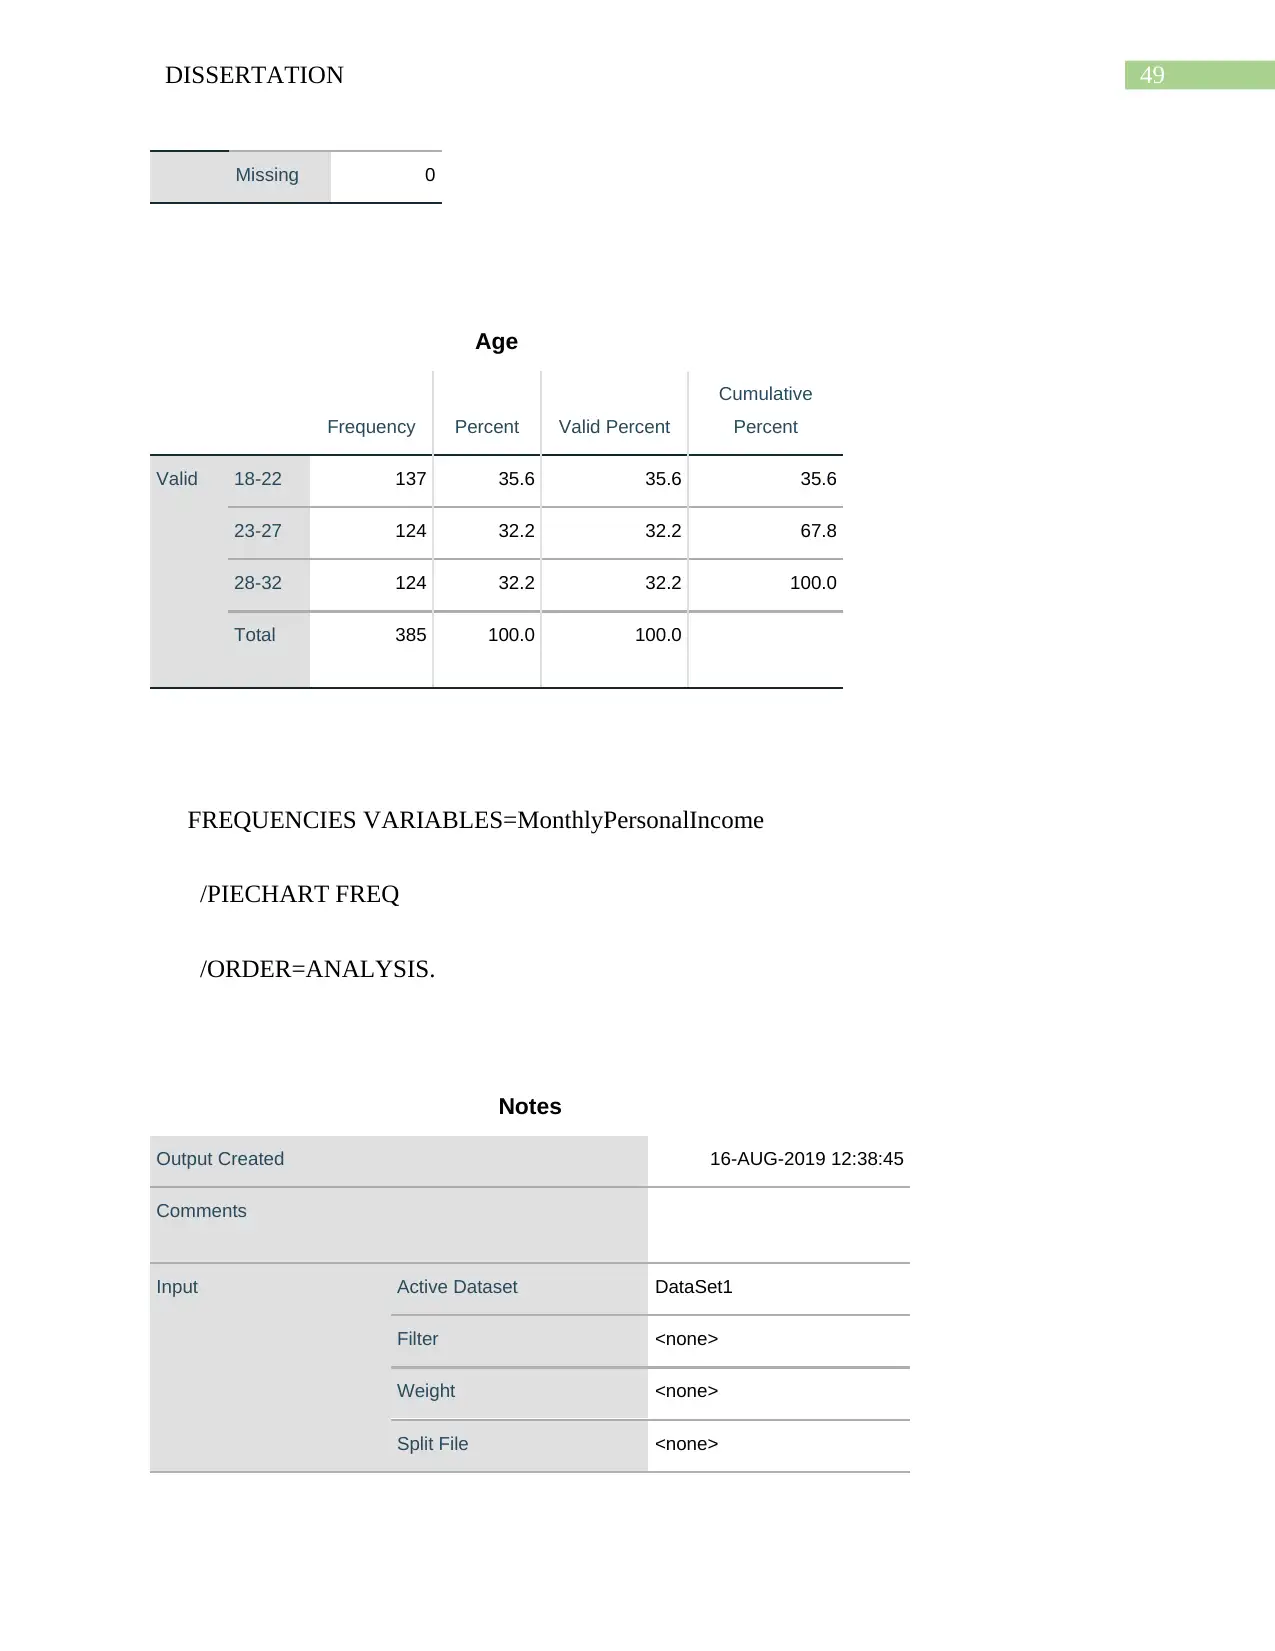
49DISSERTATION
Missing 0
Age
Frequency Percent Valid Percent
Cumulative
Percent
Valid 18-22 137 35.6 35.6 35.6
23-27 124 32.2 32.2 67.8
28-32 124 32.2 32.2 100.0
Total 385 100.0 100.0
FREQUENCIES VARIABLES=MonthlyPersonalIncome
/PIECHART FREQ
/ORDER=ANALYSIS.
Notes
Output Created 16-AUG-2019 12:38:45
Comments
Input Active Dataset DataSet1
Filter <none>
Weight <none>
Split File <none>
50DISSERTATION
N of Rows in Working Data
File
385
Missing Value Handling Definition of Missing User-defined missing values
are treated as missing.
Cases Used Statistics are based on all
cases with valid data.
Syntax FREQUENCIES
VARIABLES=MonthlyPerson
alIncome
/PIECHART FREQ
/ORDER=ANALYSIS.
Resources Processor Time 00:00:01.02
Elapsed Time 00:00:00.64
FREQUENCIES VARIABLES=MonthlyPersonalIncome
/PIECHART FREQ
/ORDER=ANALYSIS.
Frequencies
Notes
Output Created 16-AUG-2019 12:43:11
Comments
Input Active Dataset DataSet1
Filter <none>
Weight <none>
51DISSERTATION
Split File <none>
N of Rows in Working Data
File
385
Missing Value Handling Definition of Missing User-defined missing values
are treated as missing.
Cases Used Statistics are based on all
cases with valid data.
Syntax FREQUENCIES
VARIABLES=MonthlyPerson
alIncome
/PIECHART FREQ
/ORDER=ANALYSIS.
Resources Processor Time 00:00:00.84
Elapsed Time 00:00:00.53
FREQUENCIES VARIABLES=FrequencyofForeginTravel
/PIECHART FREQ
/ORDER=ANALYSIS.
Frequencies
Notes
Secure Best Marks with AI Grader
Need help grading? Try our AI Grader for instant feedback on your assignments.
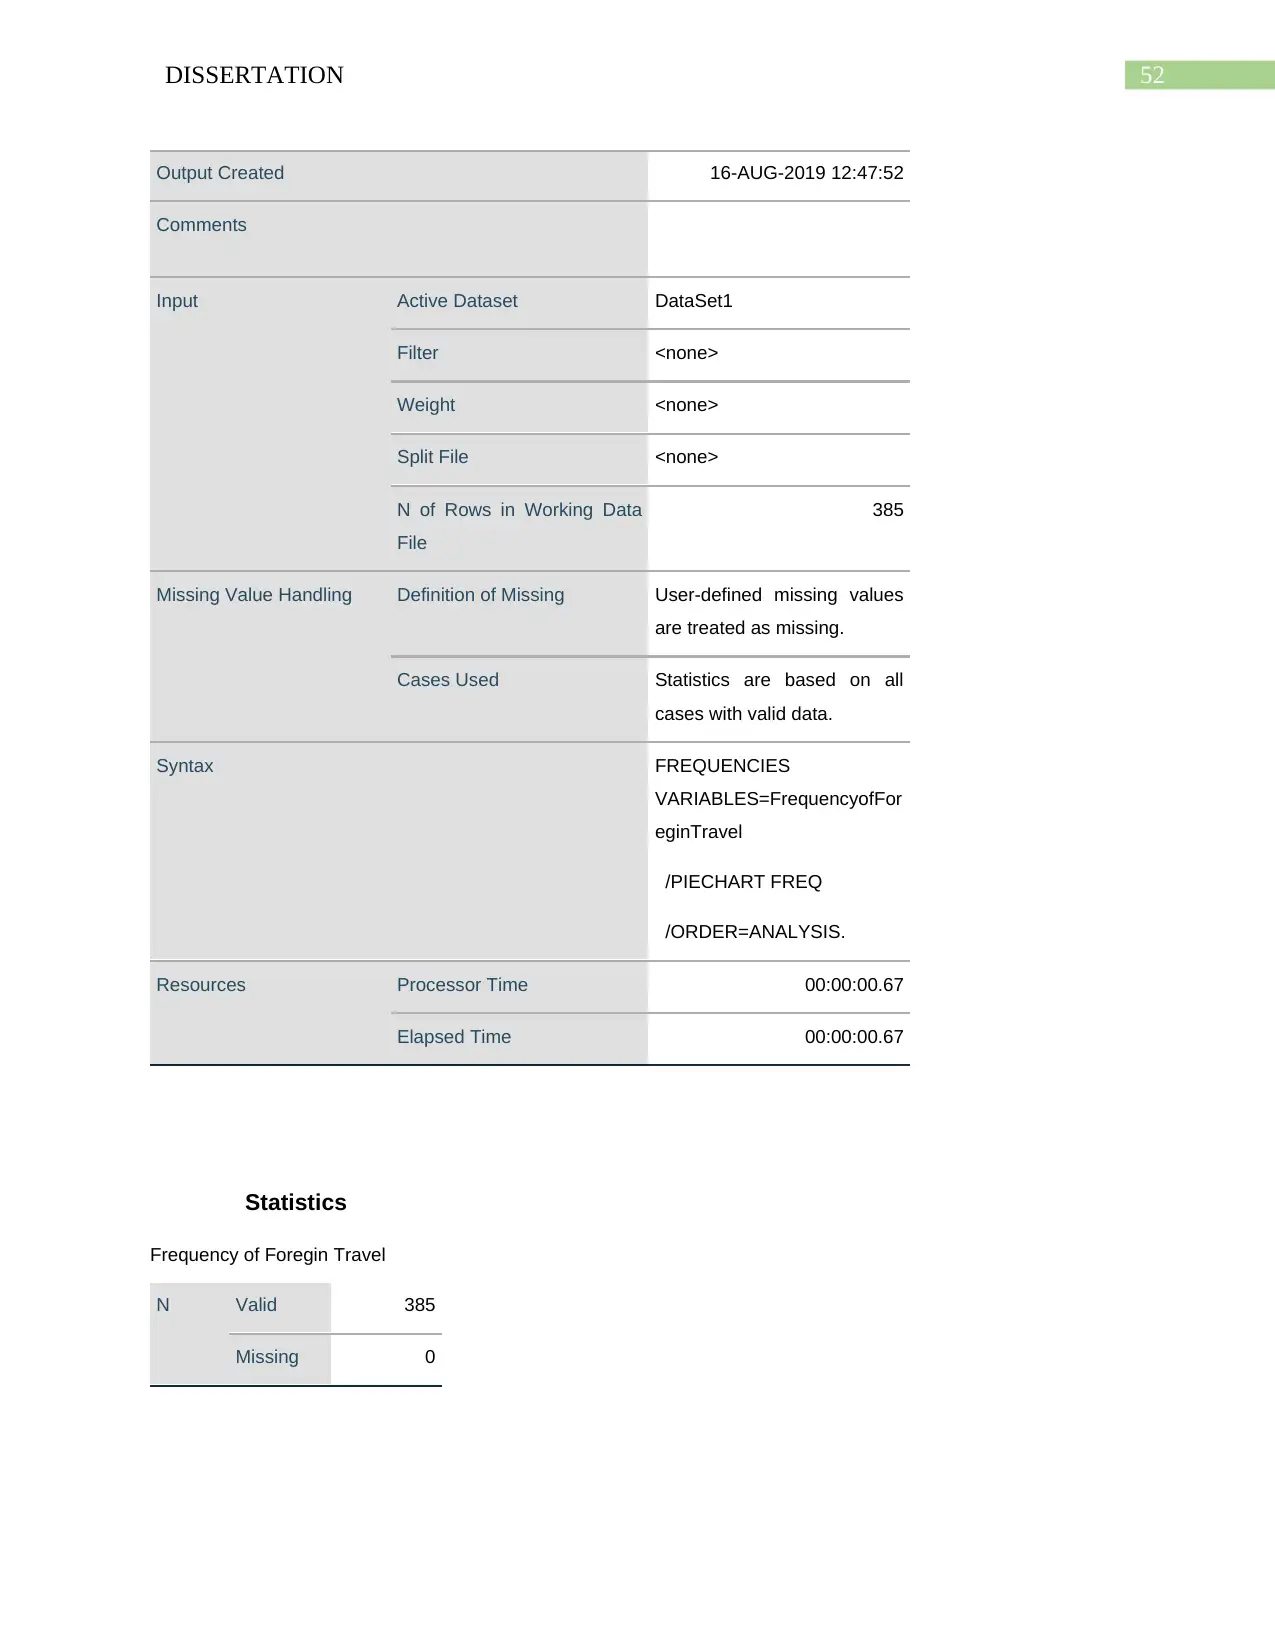
52DISSERTATION
Output Created 16-AUG-2019 12:47:52
Comments
Input Active Dataset DataSet1
Filter <none>
Weight <none>
Split File <none>
N of Rows in Working Data
File
385
Missing Value Handling Definition of Missing User-defined missing values
are treated as missing.
Cases Used Statistics are based on all
cases with valid data.
Syntax FREQUENCIES
VARIABLES=FrequencyofFor
eginTravel
/PIECHART FREQ
/ORDER=ANALYSIS.
Resources Processor Time 00:00:00.67
Elapsed Time 00:00:00.67
Statistics
Frequency of Foregin Travel
N Valid 385
Missing 0
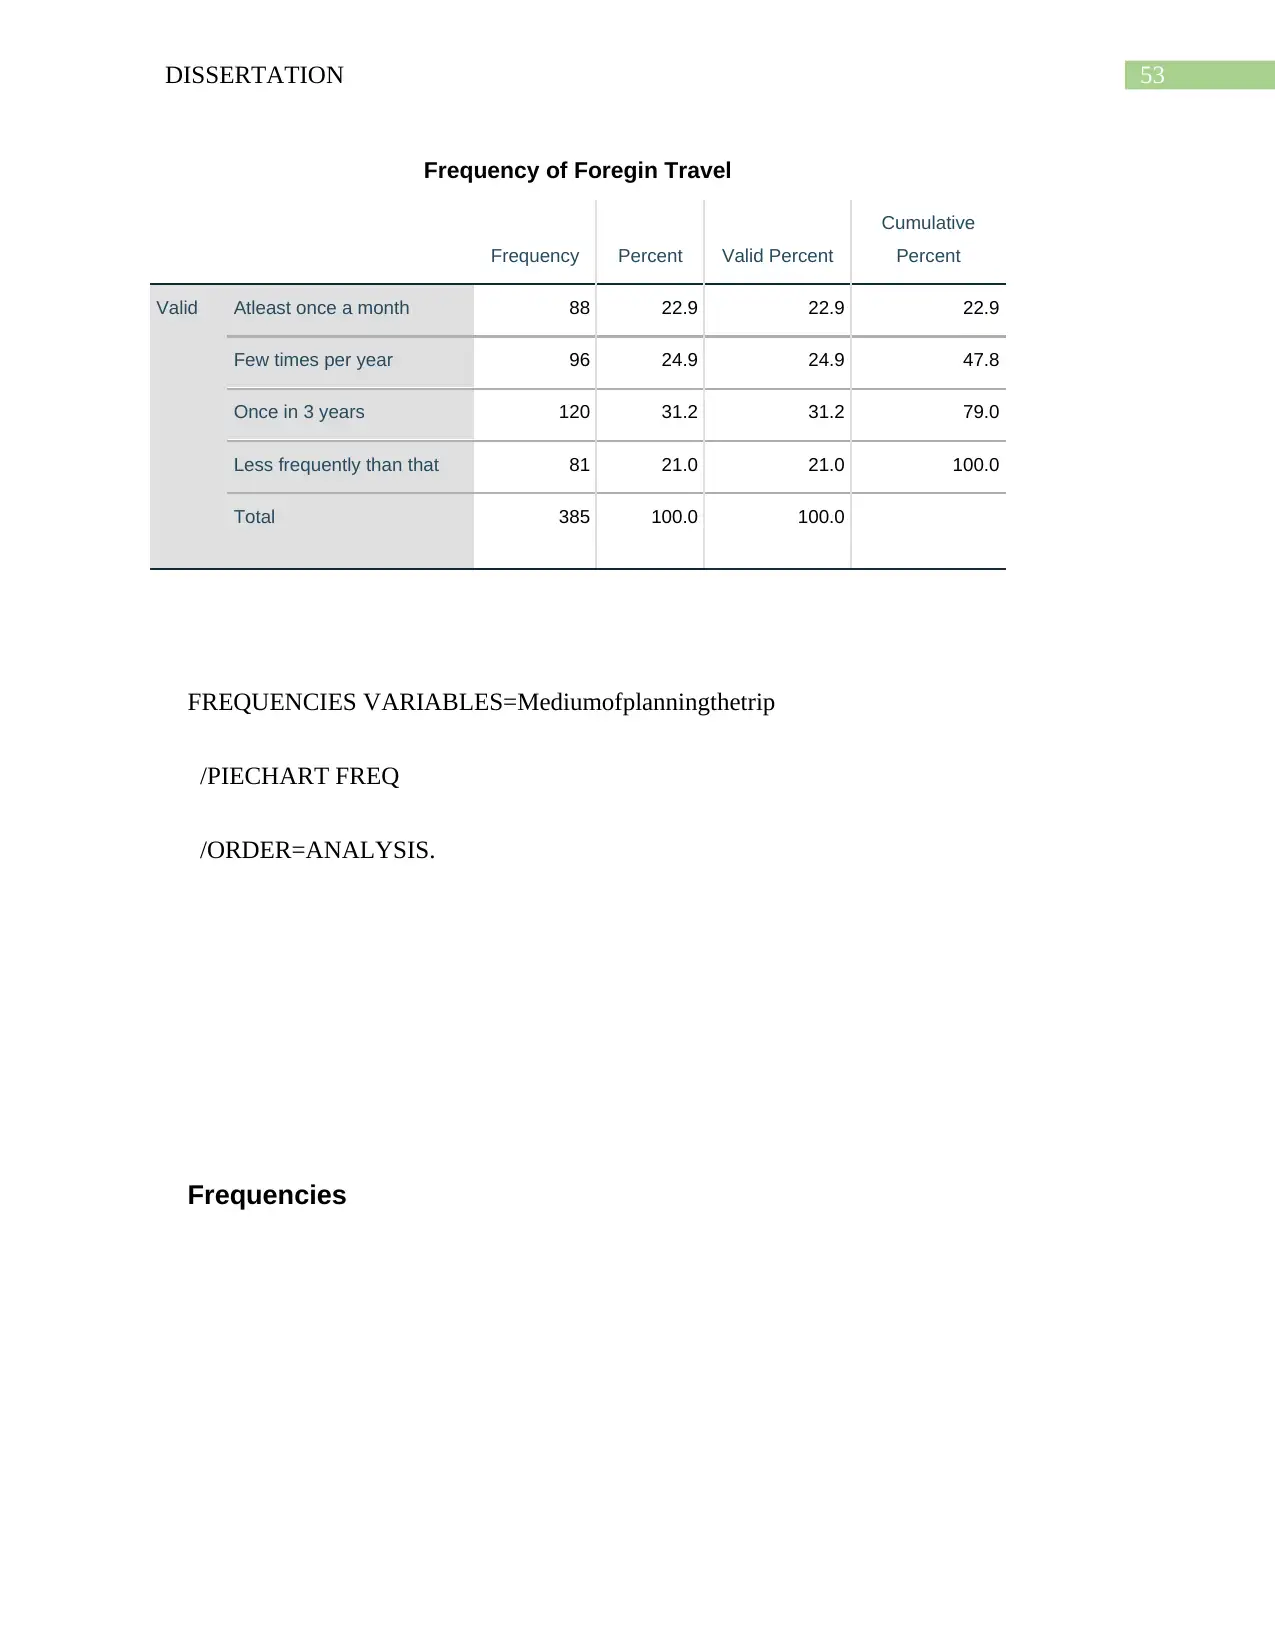
53DISSERTATION
Frequency of Foregin Travel
Frequency Percent Valid Percent
Cumulative
Percent
Valid Atleast once a month 88 22.9 22.9 22.9
Few times per year 96 24.9 24.9 47.8
Once in 3 years 120 31.2 31.2 79.0
Less frequently than that 81 21.0 21.0 100.0
Total 385 100.0 100.0
FREQUENCIES VARIABLES=Mediumofplanningthetrip
/PIECHART FREQ
/ORDER=ANALYSIS.
Frequencies
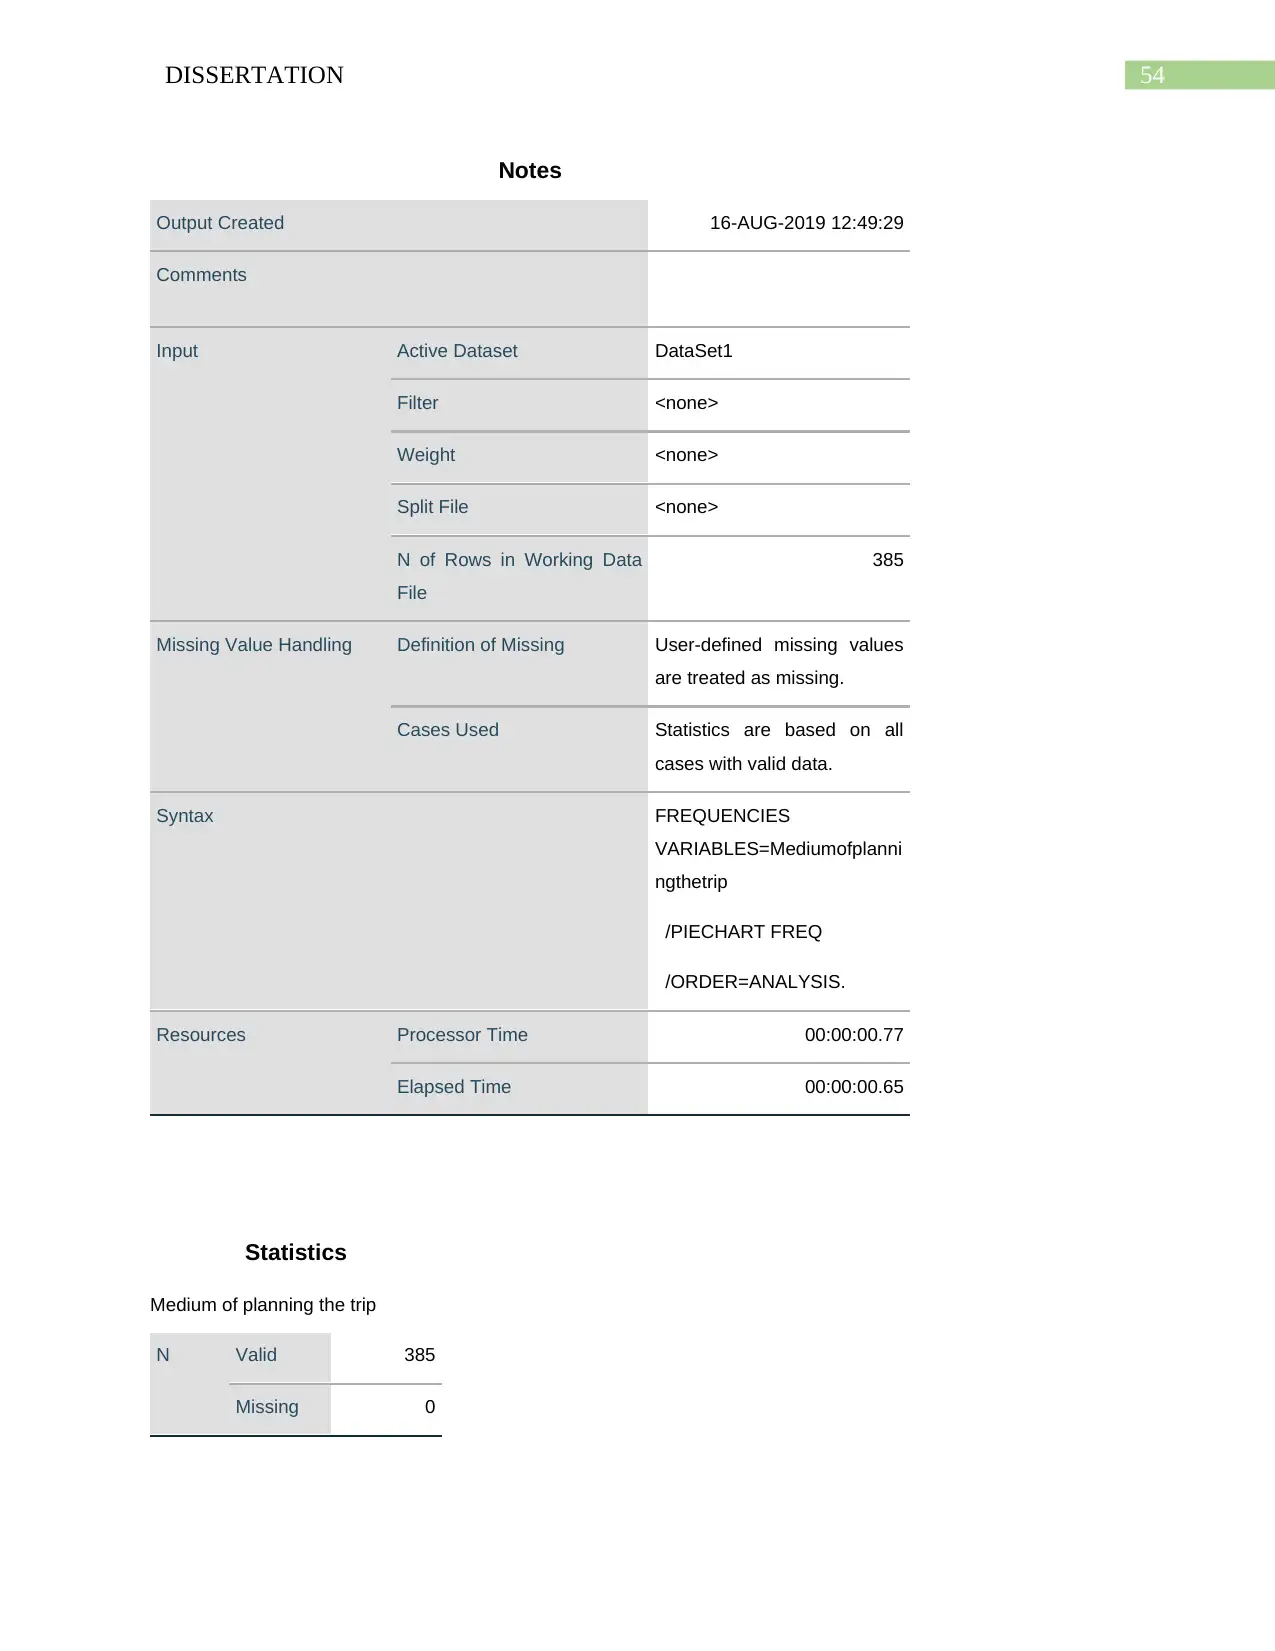
54DISSERTATION
Notes
Output Created 16-AUG-2019 12:49:29
Comments
Input Active Dataset DataSet1
Filter <none>
Weight <none>
Split File <none>
N of Rows in Working Data
File
385
Missing Value Handling Definition of Missing User-defined missing values
are treated as missing.
Cases Used Statistics are based on all
cases with valid data.
Syntax FREQUENCIES
VARIABLES=Mediumofplanni
ngthetrip
/PIECHART FREQ
/ORDER=ANALYSIS.
Resources Processor Time 00:00:00.77
Elapsed Time 00:00:00.65
Statistics
Medium of planning the trip
N Valid 385
Missing 0
Paraphrase This Document
Need a fresh take? Get an instant paraphrase of this document with our AI Paraphraser
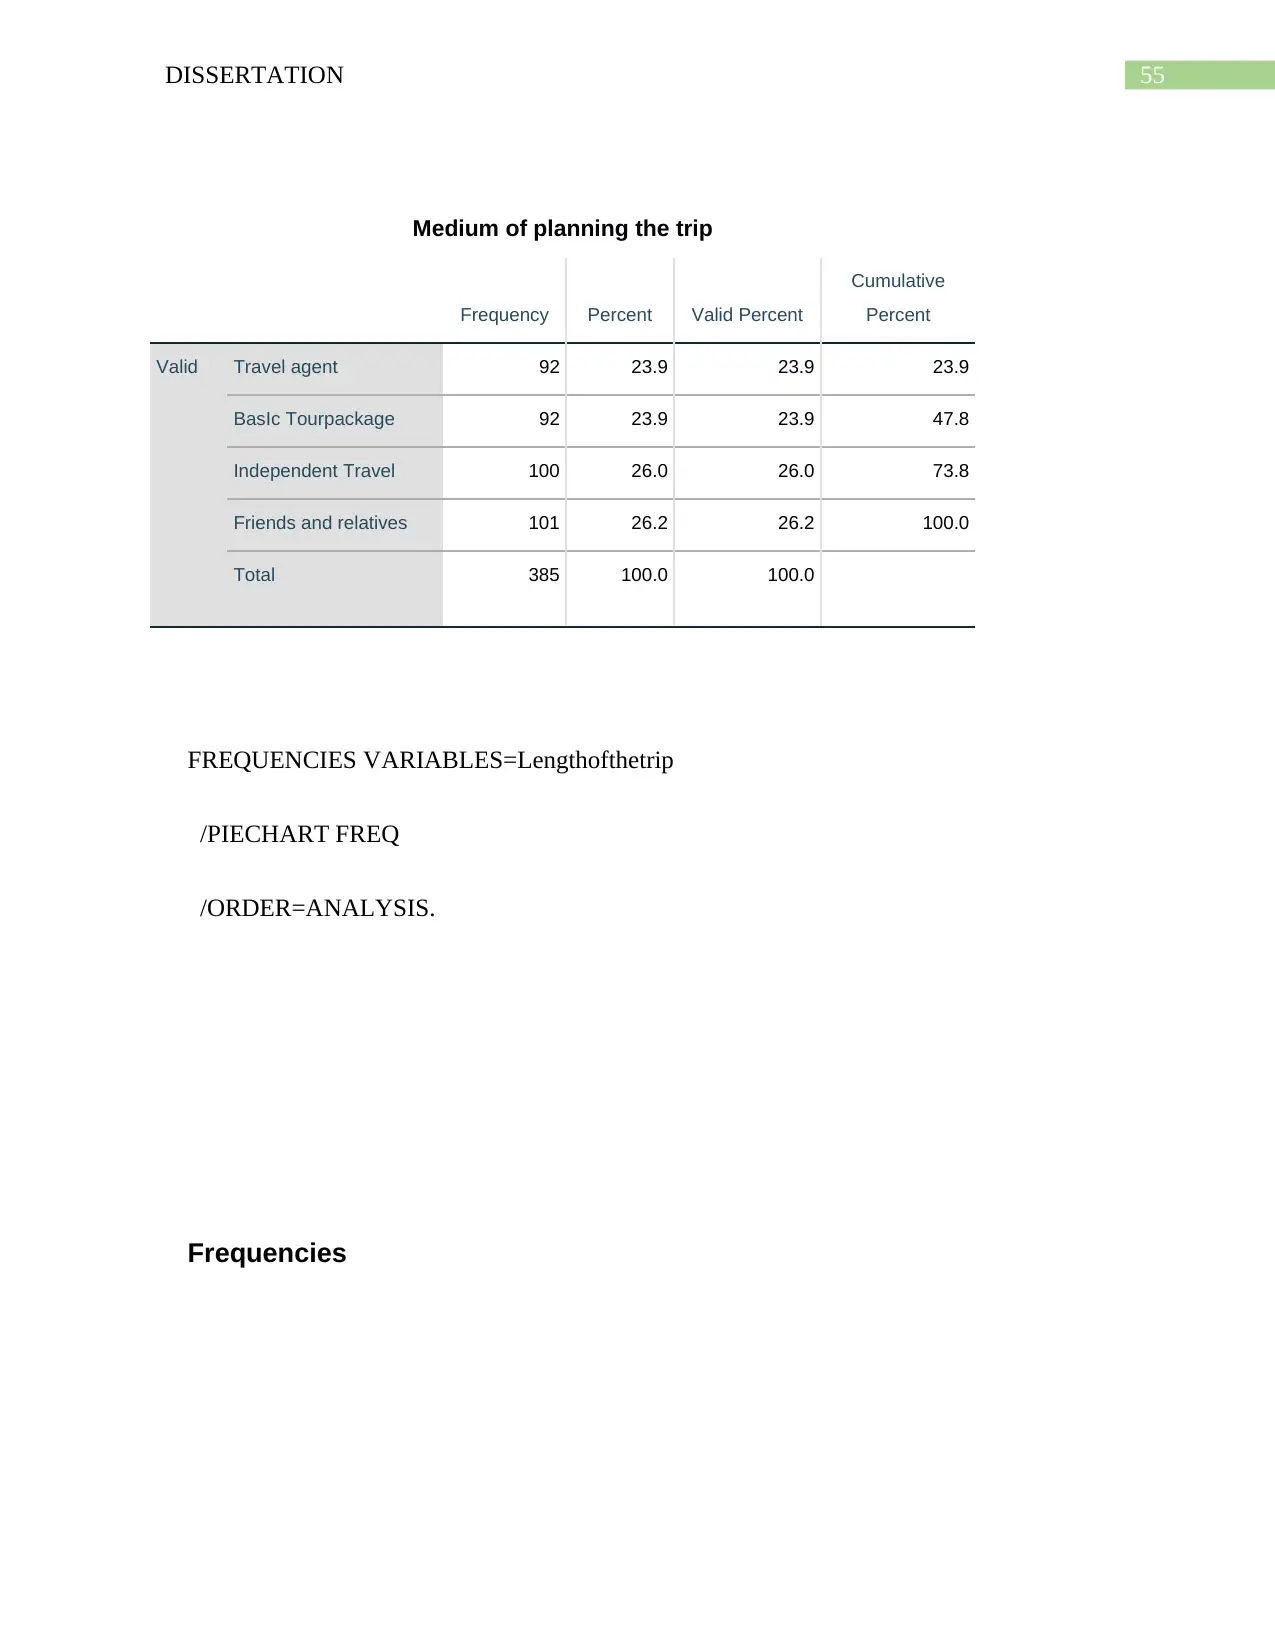
55DISSERTATION
Medium of planning the trip
Frequency Percent Valid Percent
Cumulative
Percent
Valid Travel agent 92 23.9 23.9 23.9
BasIc Tourpackage 92 23.9 23.9 47.8
Independent Travel 100 26.0 26.0 73.8
Friends and relatives 101 26.2 26.2 100.0
Total 385 100.0 100.0
FREQUENCIES VARIABLES=Lengthofthetrip
/PIECHART FREQ
/ORDER=ANALYSIS.
Frequencies
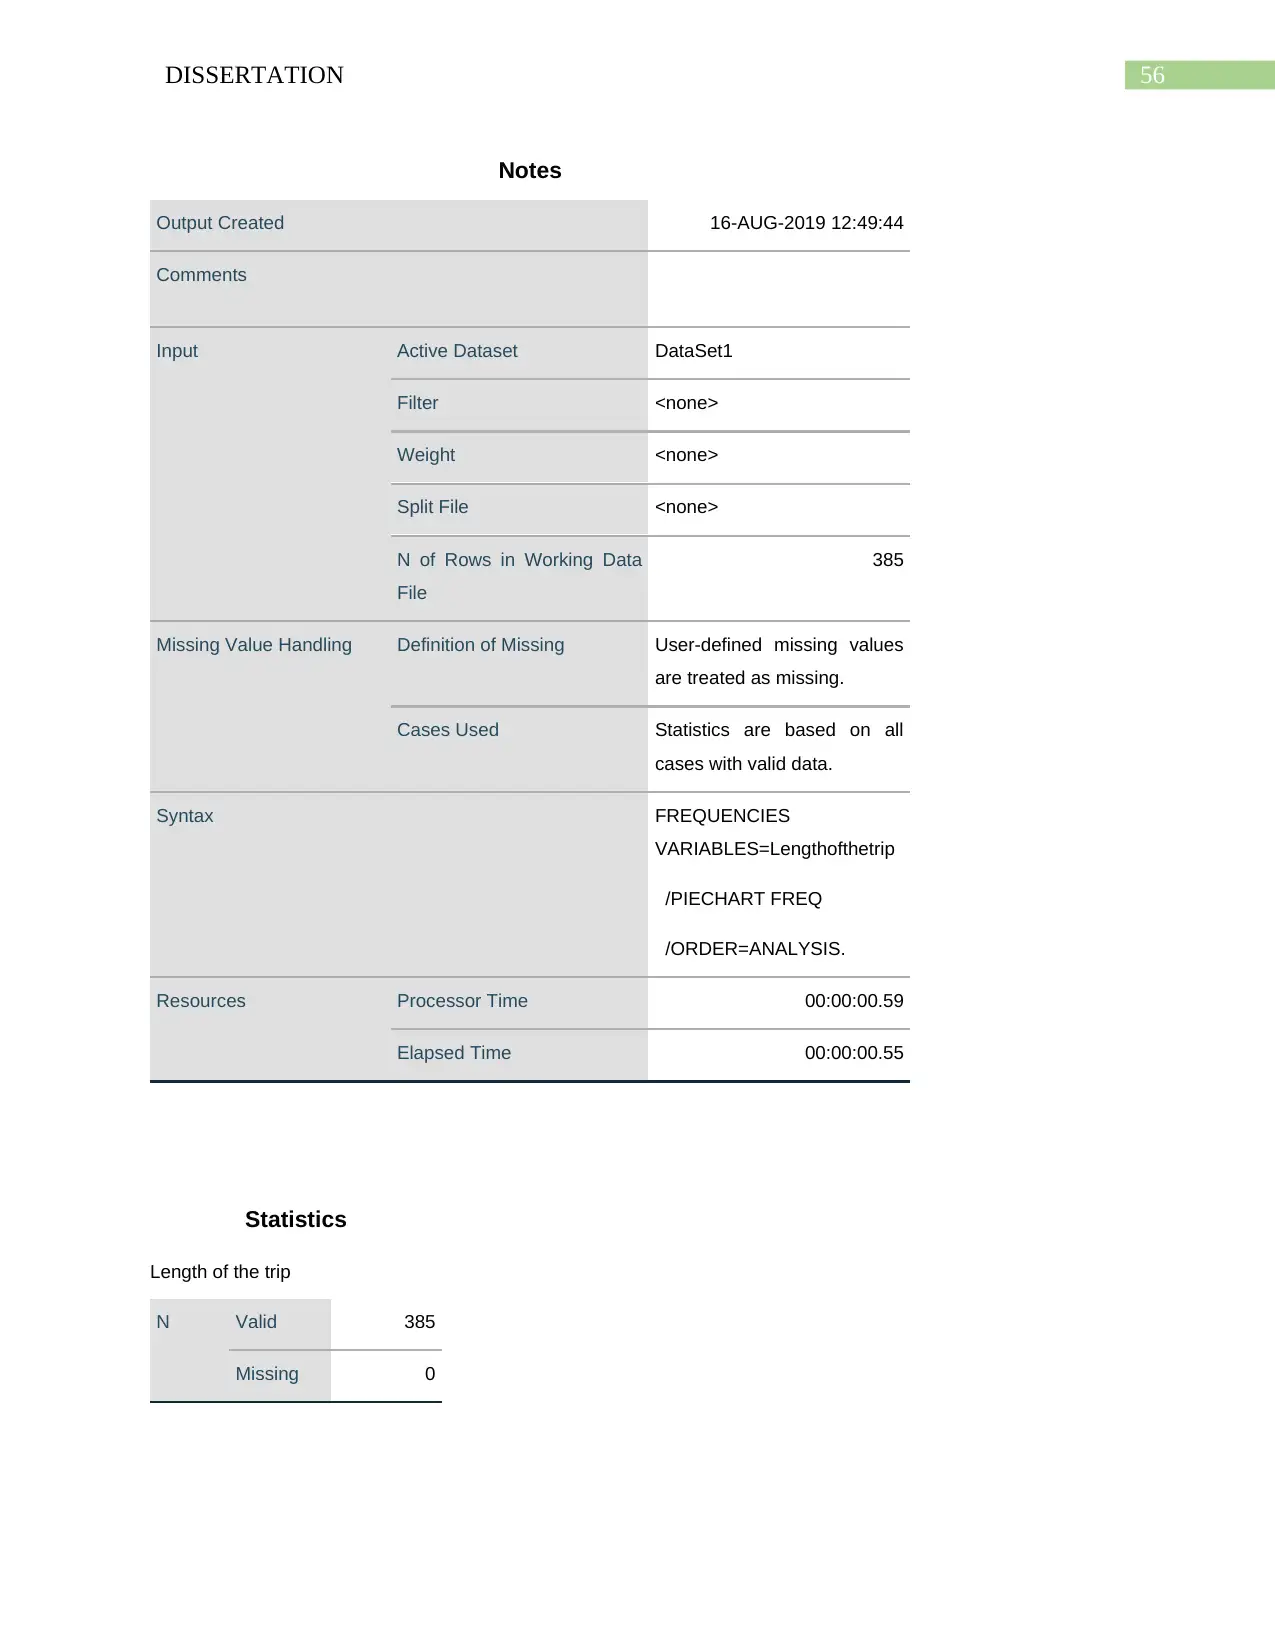
56DISSERTATION
Notes
Output Created 16-AUG-2019 12:49:44
Comments
Input Active Dataset DataSet1
Filter <none>
Weight <none>
Split File <none>
N of Rows in Working Data
File
385
Missing Value Handling Definition of Missing User-defined missing values
are treated as missing.
Cases Used Statistics are based on all
cases with valid data.
Syntax FREQUENCIES
VARIABLES=Lengthofthetrip
/PIECHART FREQ
/ORDER=ANALYSIS.
Resources Processor Time 00:00:00.59
Elapsed Time 00:00:00.55
Statistics
Length of the trip
N Valid 385
Missing 0
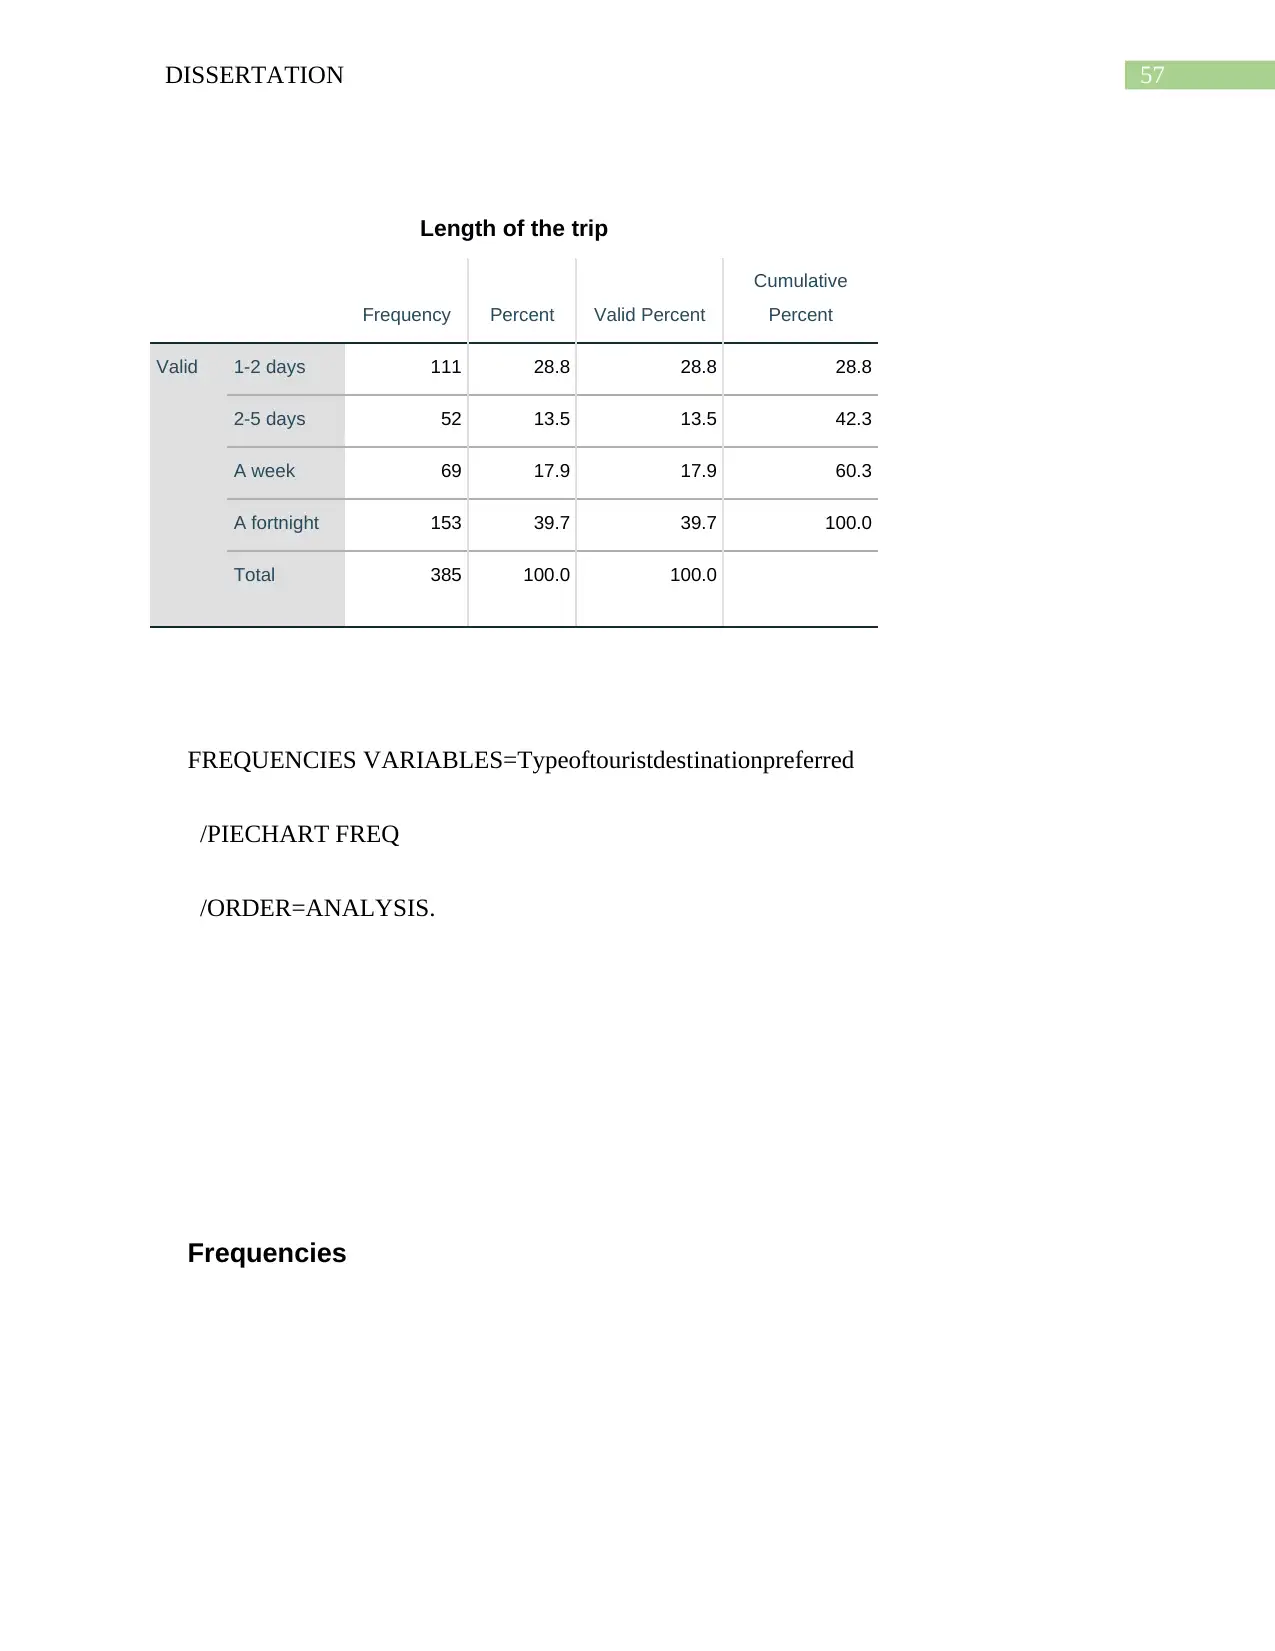
57DISSERTATION
Length of the trip
Frequency Percent Valid Percent
Cumulative
Percent
Valid 1-2 days 111 28.8 28.8 28.8
2-5 days 52 13.5 13.5 42.3
A week 69 17.9 17.9 60.3
A fortnight 153 39.7 39.7 100.0
Total 385 100.0 100.0
FREQUENCIES VARIABLES=Typeoftouristdestinationpreferred
/PIECHART FREQ
/ORDER=ANALYSIS.
Frequencies
Secure Best Marks with AI Grader
Need help grading? Try our AI Grader for instant feedback on your assignments.
58DISSERTATION
Notes
Output Created 16-AUG-2019 12:49:58
Comments
Input Active Dataset DataSet1
Filter <none>
Weight <none>
Split File <none>
N of Rows in Working Data
File
385
Missing Value Handling Definition of Missing User-defined missing values
are treated as missing.
Cases Used Statistics are based on all
cases with valid data.
Syntax FREQUENCIES
VARIABLES=Typeoftouristde
stinationpreferred
/PIECHART FREQ
/ORDER=ANALYSIS.
Resources Processor Time 00:00:00.77
Elapsed Time 00:00:00.72
Statistics
Type of tourist destination
preferred
N Valid 385
Missing 0
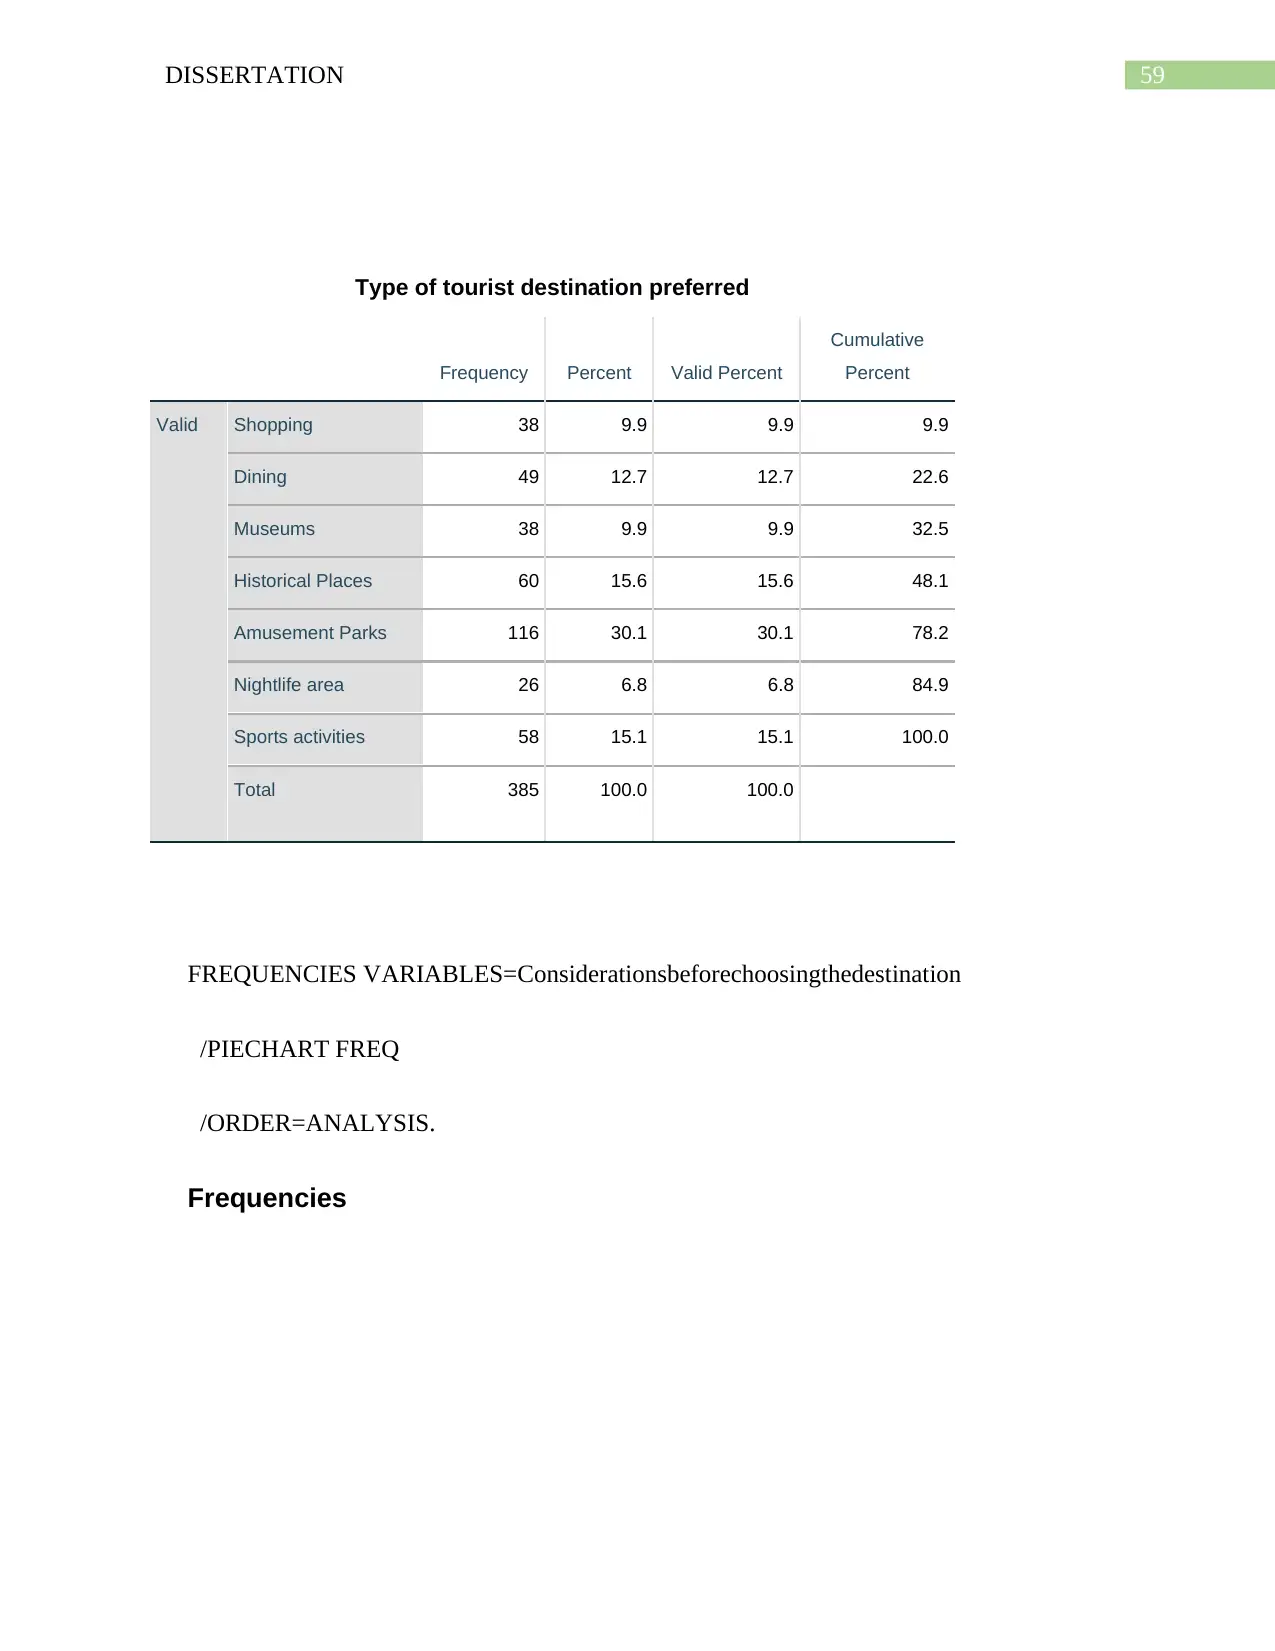
59DISSERTATION
Type of tourist destination preferred
Frequency Percent Valid Percent
Cumulative
Percent
Valid Shopping 38 9.9 9.9 9.9
Dining 49 12.7 12.7 22.6
Museums 38 9.9 9.9 32.5
Historical Places 60 15.6 15.6 48.1
Amusement Parks 116 30.1 30.1 78.2
Nightlife area 26 6.8 6.8 84.9
Sports activities 58 15.1 15.1 100.0
Total 385 100.0 100.0
FREQUENCIES VARIABLES=Considerationsbeforechoosingthedestination
/PIECHART FREQ
/ORDER=ANALYSIS.
Frequencies
60DISSERTATION
Notes
Output Created 16-AUG-2019 12:50:15
Comments
Input Active Dataset DataSet1
Filter <none>
Weight <none>
Split File <none>
N of Rows in Working Data
File
385
Missing Value Handling Definition of Missing User-defined missing values
are treated as missing.
Cases Used Statistics are based on all
cases with valid data.
Syntax FREQUENCIES
VARIABLES=Considerations
beforechoosingthedestination
/PIECHART FREQ
/ORDER=ANALYSIS.
Resources Processor Time 00:00:00.58
Elapsed Time 00:00:00.60
Statistics
Considerations before choosing
the destination
N Valid 385
Missing 0
Paraphrase This Document
Need a fresh take? Get an instant paraphrase of this document with our AI Paraphraser
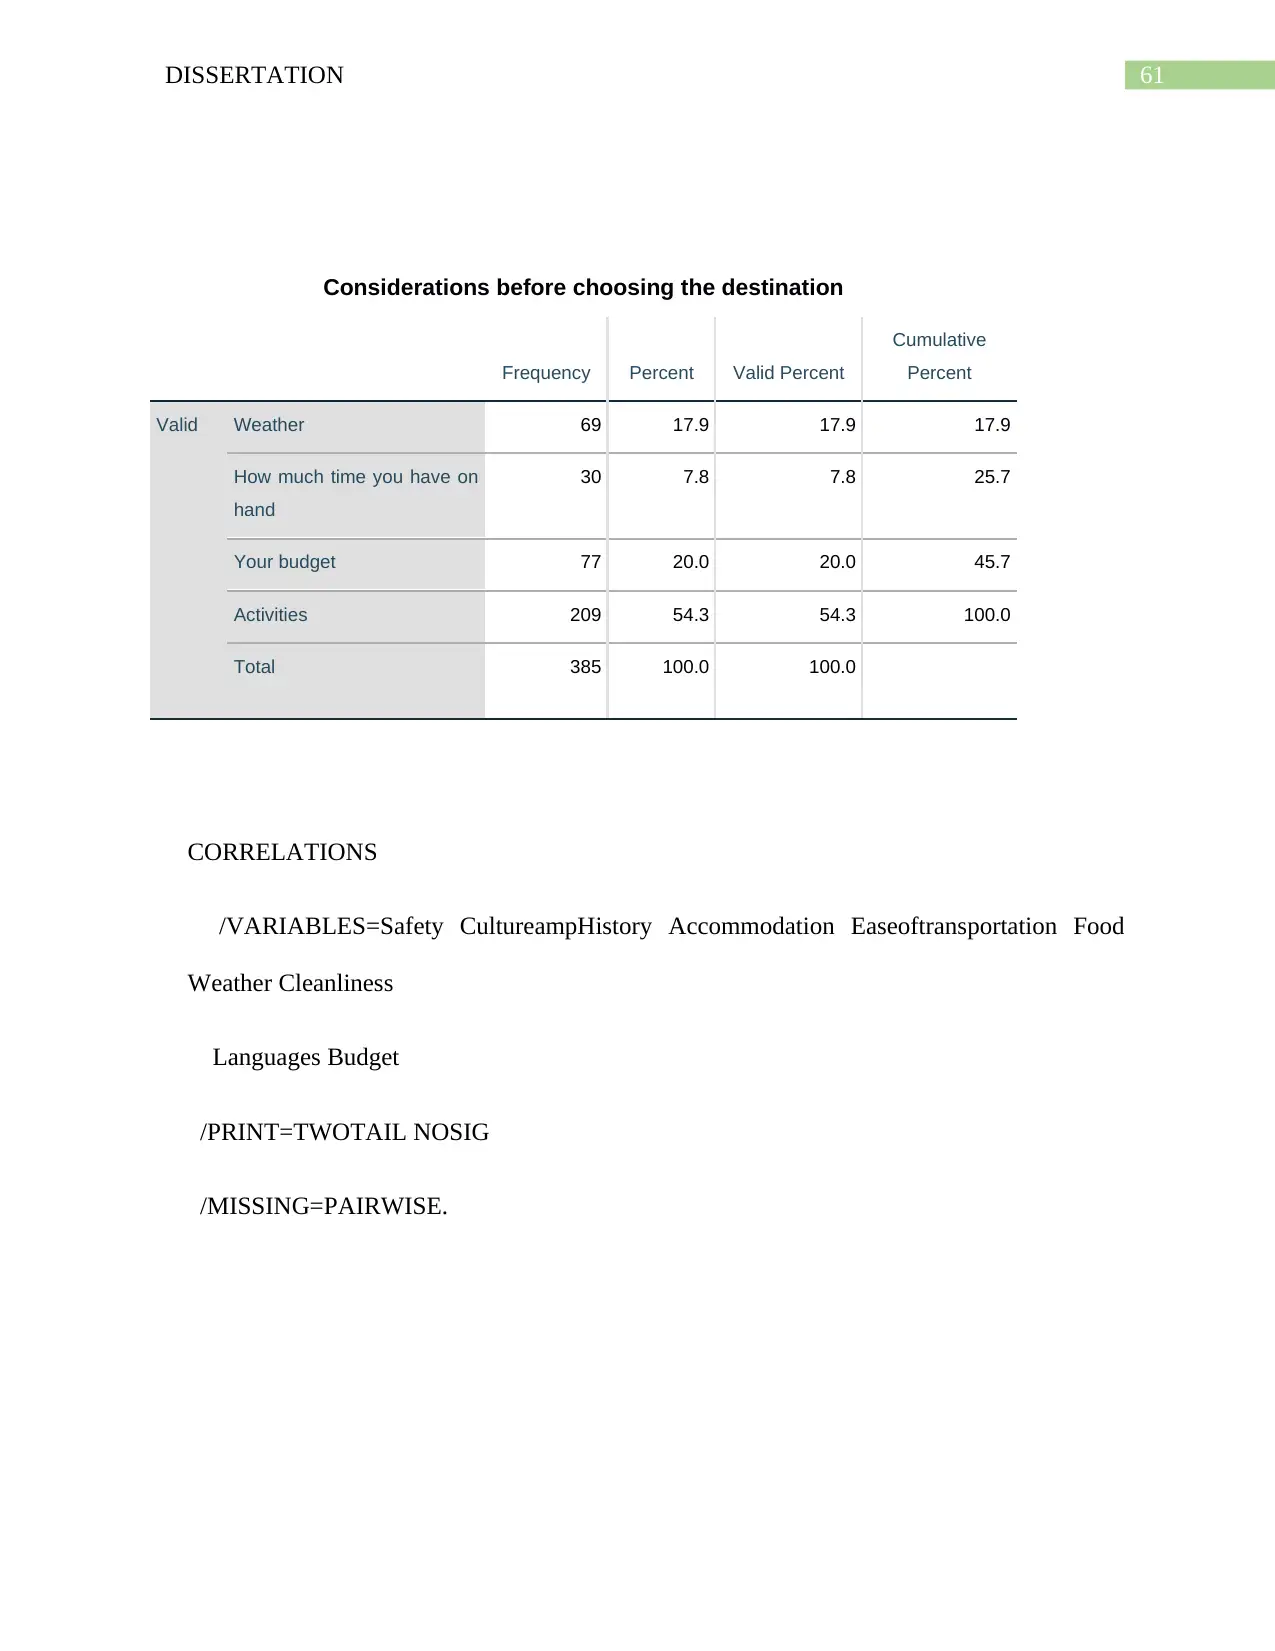
61DISSERTATION
Considerations before choosing the destination
Frequency Percent Valid Percent
Cumulative
Percent
Valid Weather 69 17.9 17.9 17.9
How much time you have on
hand
30 7.8 7.8 25.7
Your budget 77 20.0 20.0 45.7
Activities 209 54.3 54.3 100.0
Total 385 100.0 100.0
CORRELATIONS
/VARIABLES=Safety CultureampHistory Accommodation Easeoftransportation Food
Weather Cleanliness
Languages Budget
/PRINT=TWOTAIL NOSIG
/MISSING=PAIRWISE.
62DISSERTATION
Correlations
Notes
Output Created 16-AUG-2019 14:02:46
Comments
Input Active Dataset DataSet1
Filter <none>
Weight <none>
Split File <none>
N of Rows in Working Data
File
385
Missing Value Handling Definition of Missing User-defined missing values
are treated as missing.
Cases Used Statistics for each pair of
variables are based on all the
cases with valid data for that
pair.
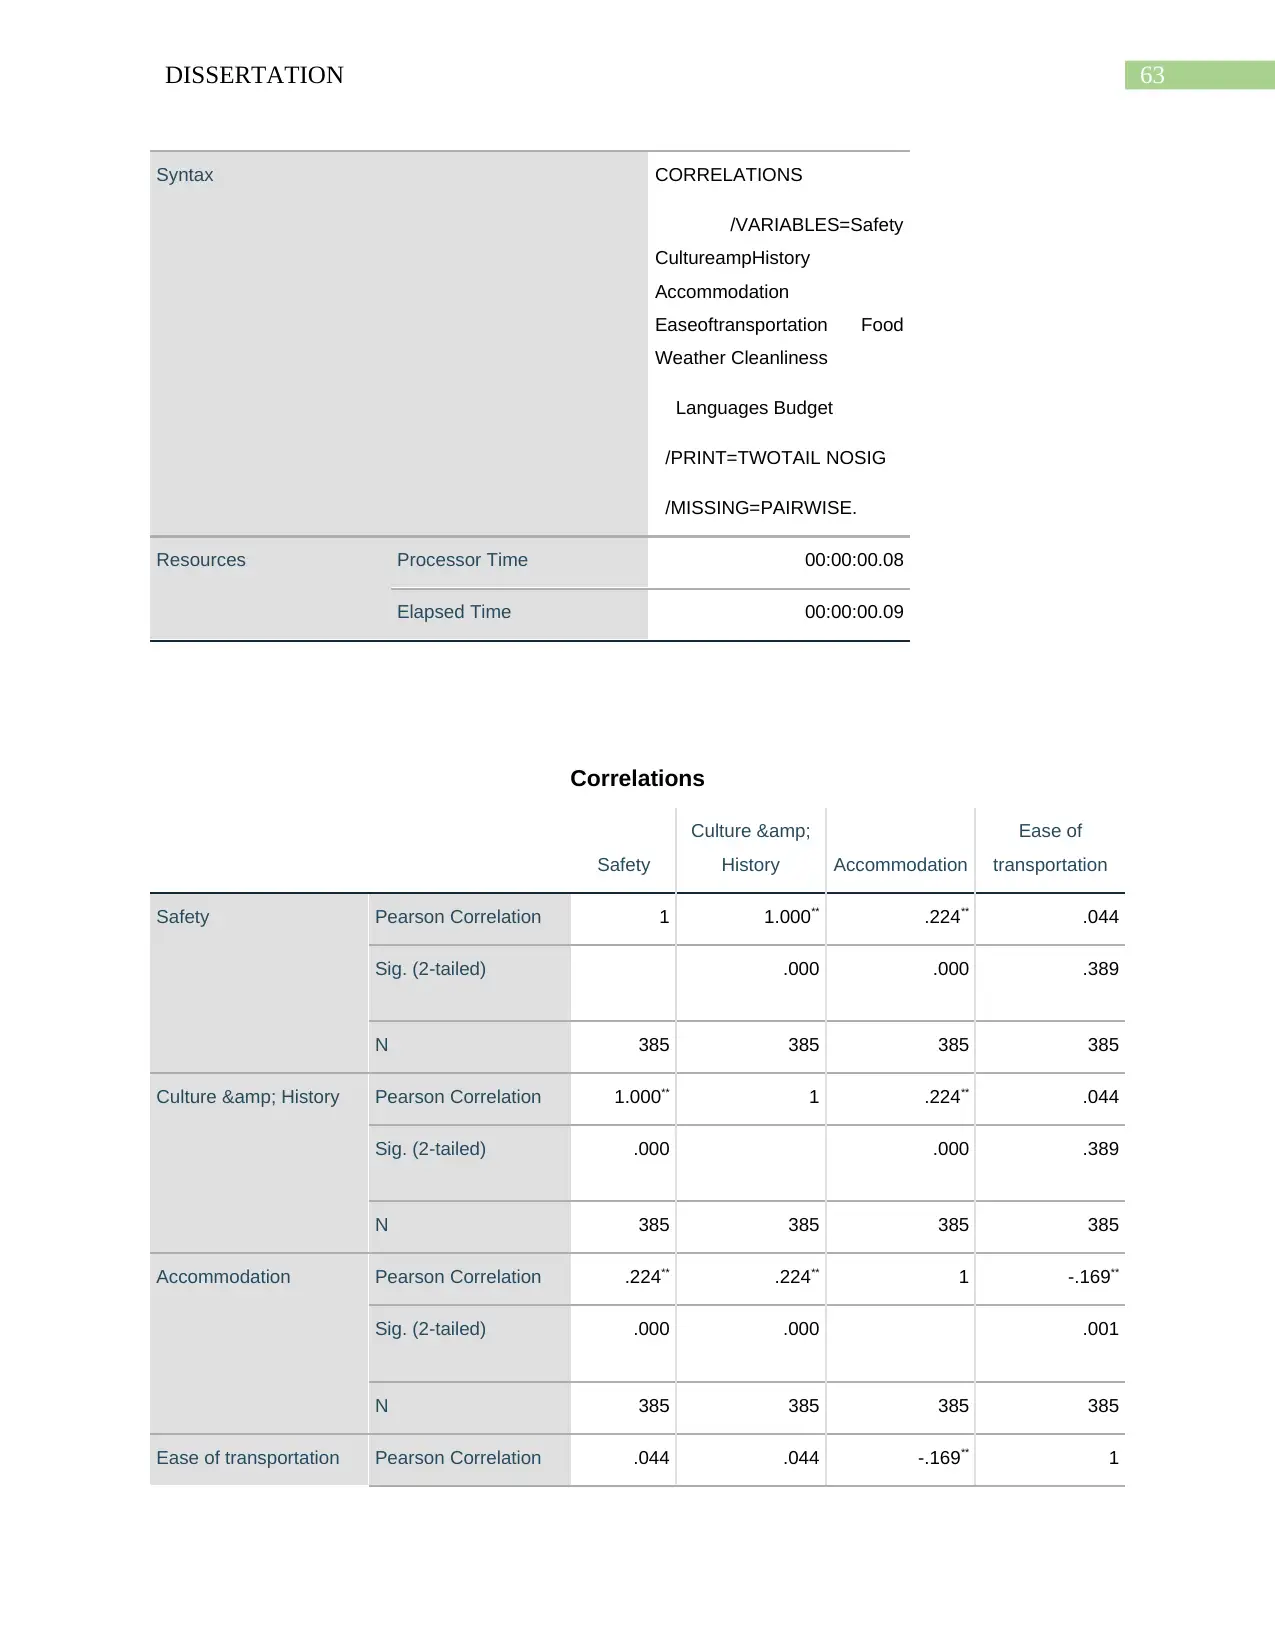
63DISSERTATION
Syntax CORRELATIONS
/VARIABLES=Safety
CultureampHistory
Accommodation
Easeoftransportation Food
Weather Cleanliness
Languages Budget
/PRINT=TWOTAIL NOSIG
/MISSING=PAIRWISE.
Resources Processor Time 00:00:00.08
Elapsed Time 00:00:00.09
Correlations
Safety
Culture &
History Accommodation
Ease of
transportation
Safety Pearson Correlation 1 1.000** .224** .044
Sig. (2-tailed) .000 .000 .389
N 385 385 385 385
Culture & History Pearson Correlation 1.000** 1 .224** .044
Sig. (2-tailed) .000 .000 .389
N 385 385 385 385
Accommodation Pearson Correlation .224** .224** 1 -.169**
Sig. (2-tailed) .000 .000 .001
N 385 385 385 385
Ease of transportation Pearson Correlation .044 .044 -.169** 1
Secure Best Marks with AI Grader
Need help grading? Try our AI Grader for instant feedback on your assignments.
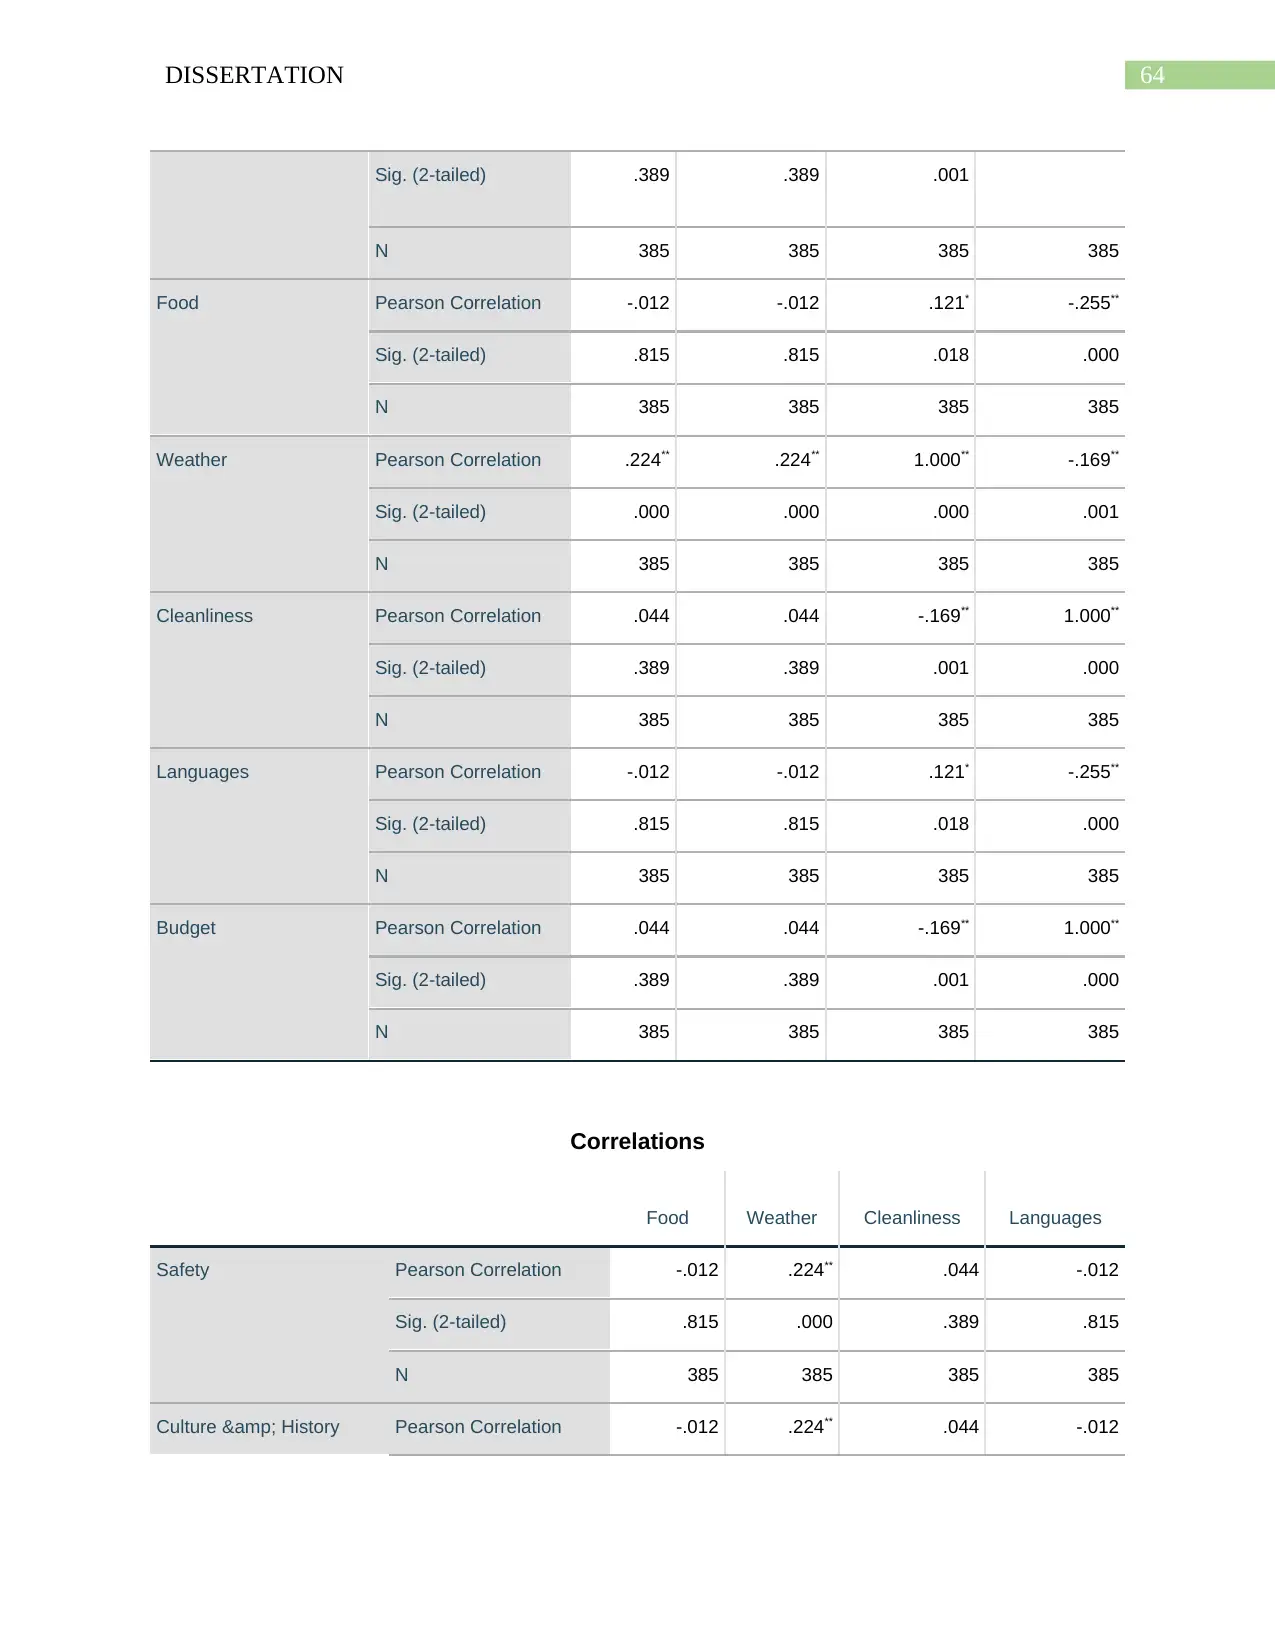
64DISSERTATION
Sig. (2-tailed) .389 .389 .001
N 385 385 385 385
Food Pearson Correlation -.012 -.012 .121* -.255**
Sig. (2-tailed) .815 .815 .018 .000
N 385 385 385 385
Weather Pearson Correlation .224** .224** 1.000** -.169**
Sig. (2-tailed) .000 .000 .000 .001
N 385 385 385 385
Cleanliness Pearson Correlation .044 .044 -.169** 1.000**
Sig. (2-tailed) .389 .389 .001 .000
N 385 385 385 385
Languages Pearson Correlation -.012 -.012 .121* -.255**
Sig. (2-tailed) .815 .815 .018 .000
N 385 385 385 385
Budget Pearson Correlation .044 .044 -.169** 1.000**
Sig. (2-tailed) .389 .389 .001 .000
N 385 385 385 385
Correlations
Food Weather Cleanliness Languages
Safety Pearson Correlation -.012 .224** .044 -.012
Sig. (2-tailed) .815 .000 .389 .815
N 385 385 385 385
Culture & History Pearson Correlation -.012 .224** .044 -.012
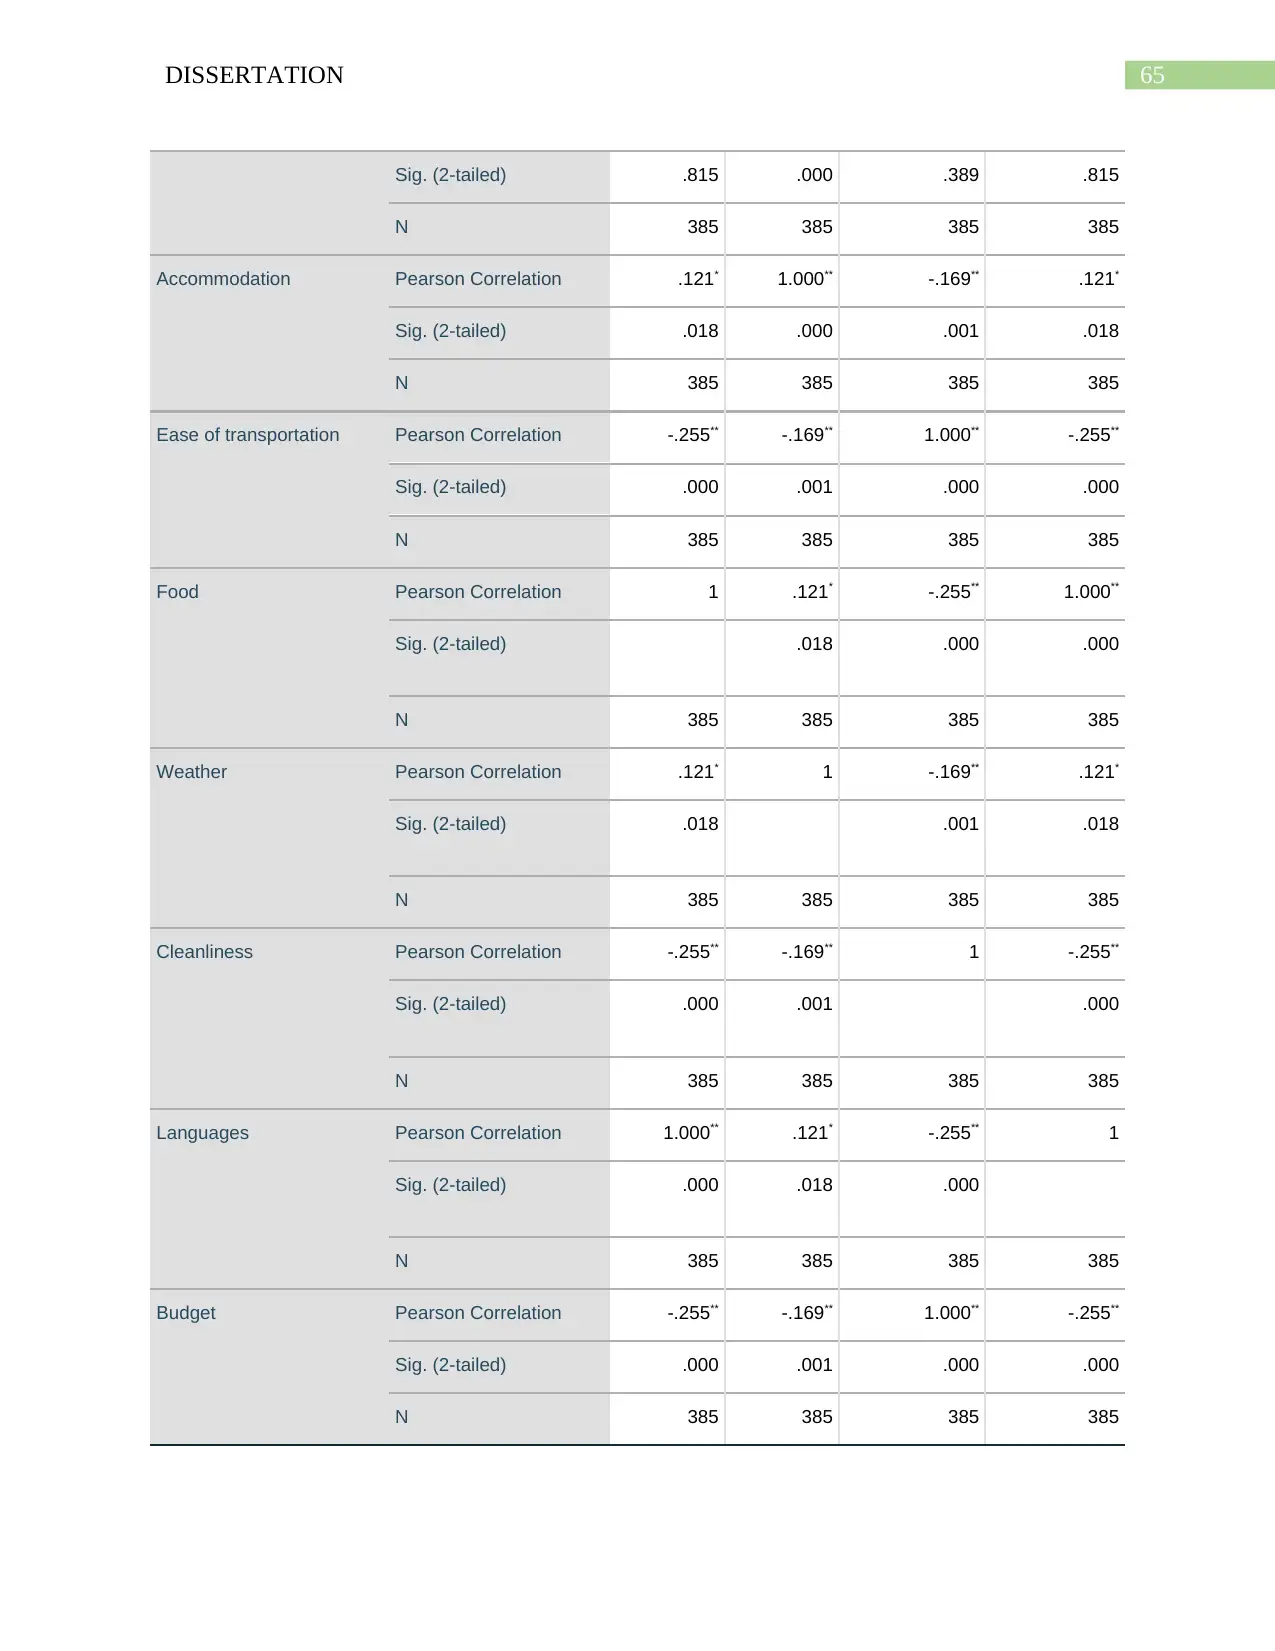
65DISSERTATION
Sig. (2-tailed) .815 .000 .389 .815
N 385 385 385 385
Accommodation Pearson Correlation .121* 1.000** -.169** .121*
Sig. (2-tailed) .018 .000 .001 .018
N 385 385 385 385
Ease of transportation Pearson Correlation -.255** -.169** 1.000** -.255**
Sig. (2-tailed) .000 .001 .000 .000
N 385 385 385 385
Food Pearson Correlation 1 .121* -.255** 1.000**
Sig. (2-tailed) .018 .000 .000
N 385 385 385 385
Weather Pearson Correlation .121* 1 -.169** .121*
Sig. (2-tailed) .018 .001 .018
N 385 385 385 385
Cleanliness Pearson Correlation -.255** -.169** 1 -.255**
Sig. (2-tailed) .000 .001 .000
N 385 385 385 385
Languages Pearson Correlation 1.000** .121* -.255** 1
Sig. (2-tailed) .000 .018 .000
N 385 385 385 385
Budget Pearson Correlation -.255** -.169** 1.000** -.255**
Sig. (2-tailed) .000 .001 .000 .000
N 385 385 385 385
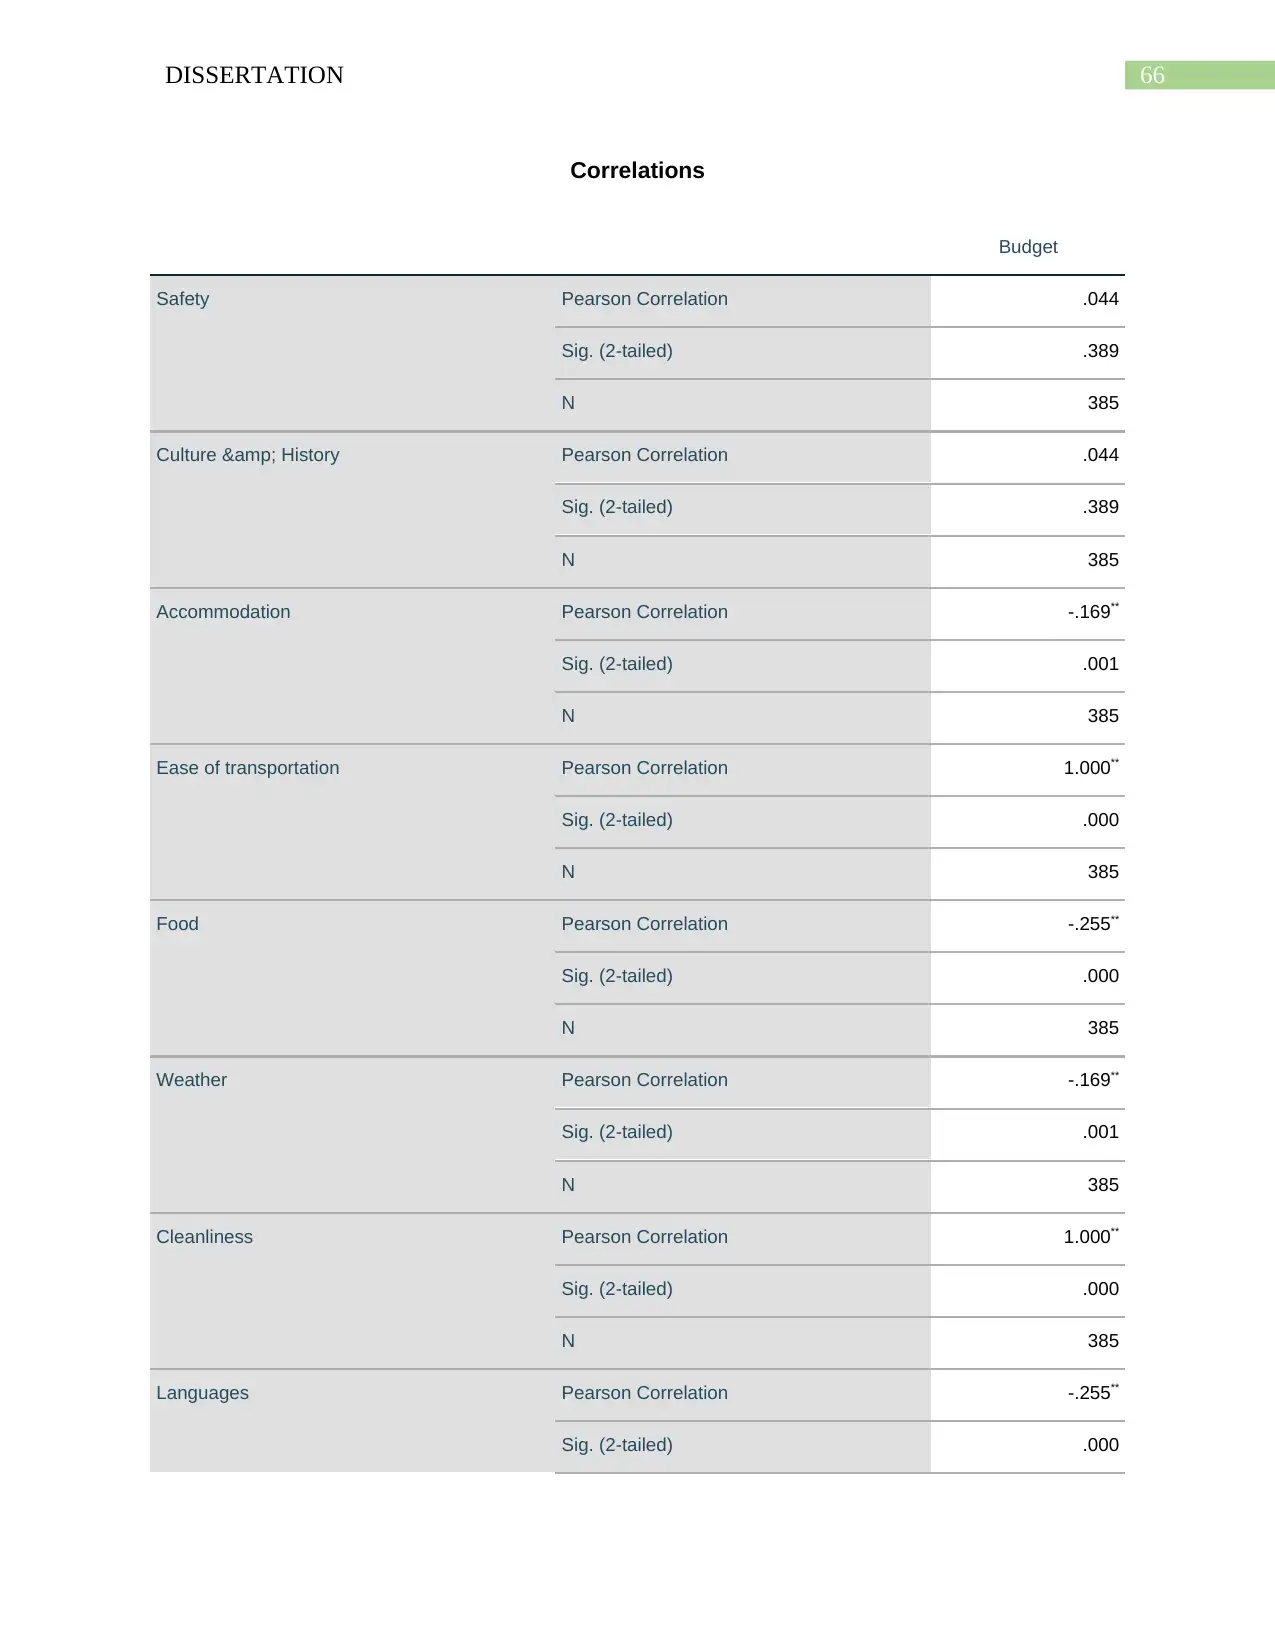
66DISSERTATION
Correlations
Budget
Safety Pearson Correlation .044
Sig. (2-tailed) .389
N 385
Culture & History Pearson Correlation .044
Sig. (2-tailed) .389
N 385
Accommodation Pearson Correlation -.169**
Sig. (2-tailed) .001
N 385
Ease of transportation Pearson Correlation 1.000**
Sig. (2-tailed) .000
N 385
Food Pearson Correlation -.255**
Sig. (2-tailed) .000
N 385
Weather Pearson Correlation -.169**
Sig. (2-tailed) .001
N 385
Cleanliness Pearson Correlation 1.000**
Sig. (2-tailed) .000
N 385
Languages Pearson Correlation -.255**
Sig. (2-tailed) .000
Paraphrase This Document
Need a fresh take? Get an instant paraphrase of this document with our AI Paraphraser
67DISSERTATION
N 385
Budget Pearson Correlation 1
Sig. (2-tailed)
N 385
**. Correlation is significant at the 0.01 level (2-tailed).
*. Correlation is significant at the 0.05 level (2-tailed).
2. Questionnaire
Questionnaire on travel and tourism
This is a short questionnaire about University students in Hong Kong towards the choice of
destinations in overseas leisure trips. This questionnaire takes about 3-5 minutes and is
conducted anonymously.
Please answer all questions in this survey with ONE ANSWER for multiple choice and rate 1-5
on scale measuring question.
What is your gender?
Female
Male
N 385
Budget Pearson Correlation 1
Sig. (2-tailed)
N 385
**. Correlation is significant at the 0.01 level (2-tailed).
*. Correlation is significant at the 0.05 level (2-tailed).
2. Questionnaire
Questionnaire on travel and tourism
This is a short questionnaire about University students in Hong Kong towards the choice of
destinations in overseas leisure trips. This questionnaire takes about 3-5 minutes and is
conducted anonymously.
Please answer all questions in this survey with ONE ANSWER for multiple choice and rate 1-5
on scale measuring question.
What is your gender?
Female
Male
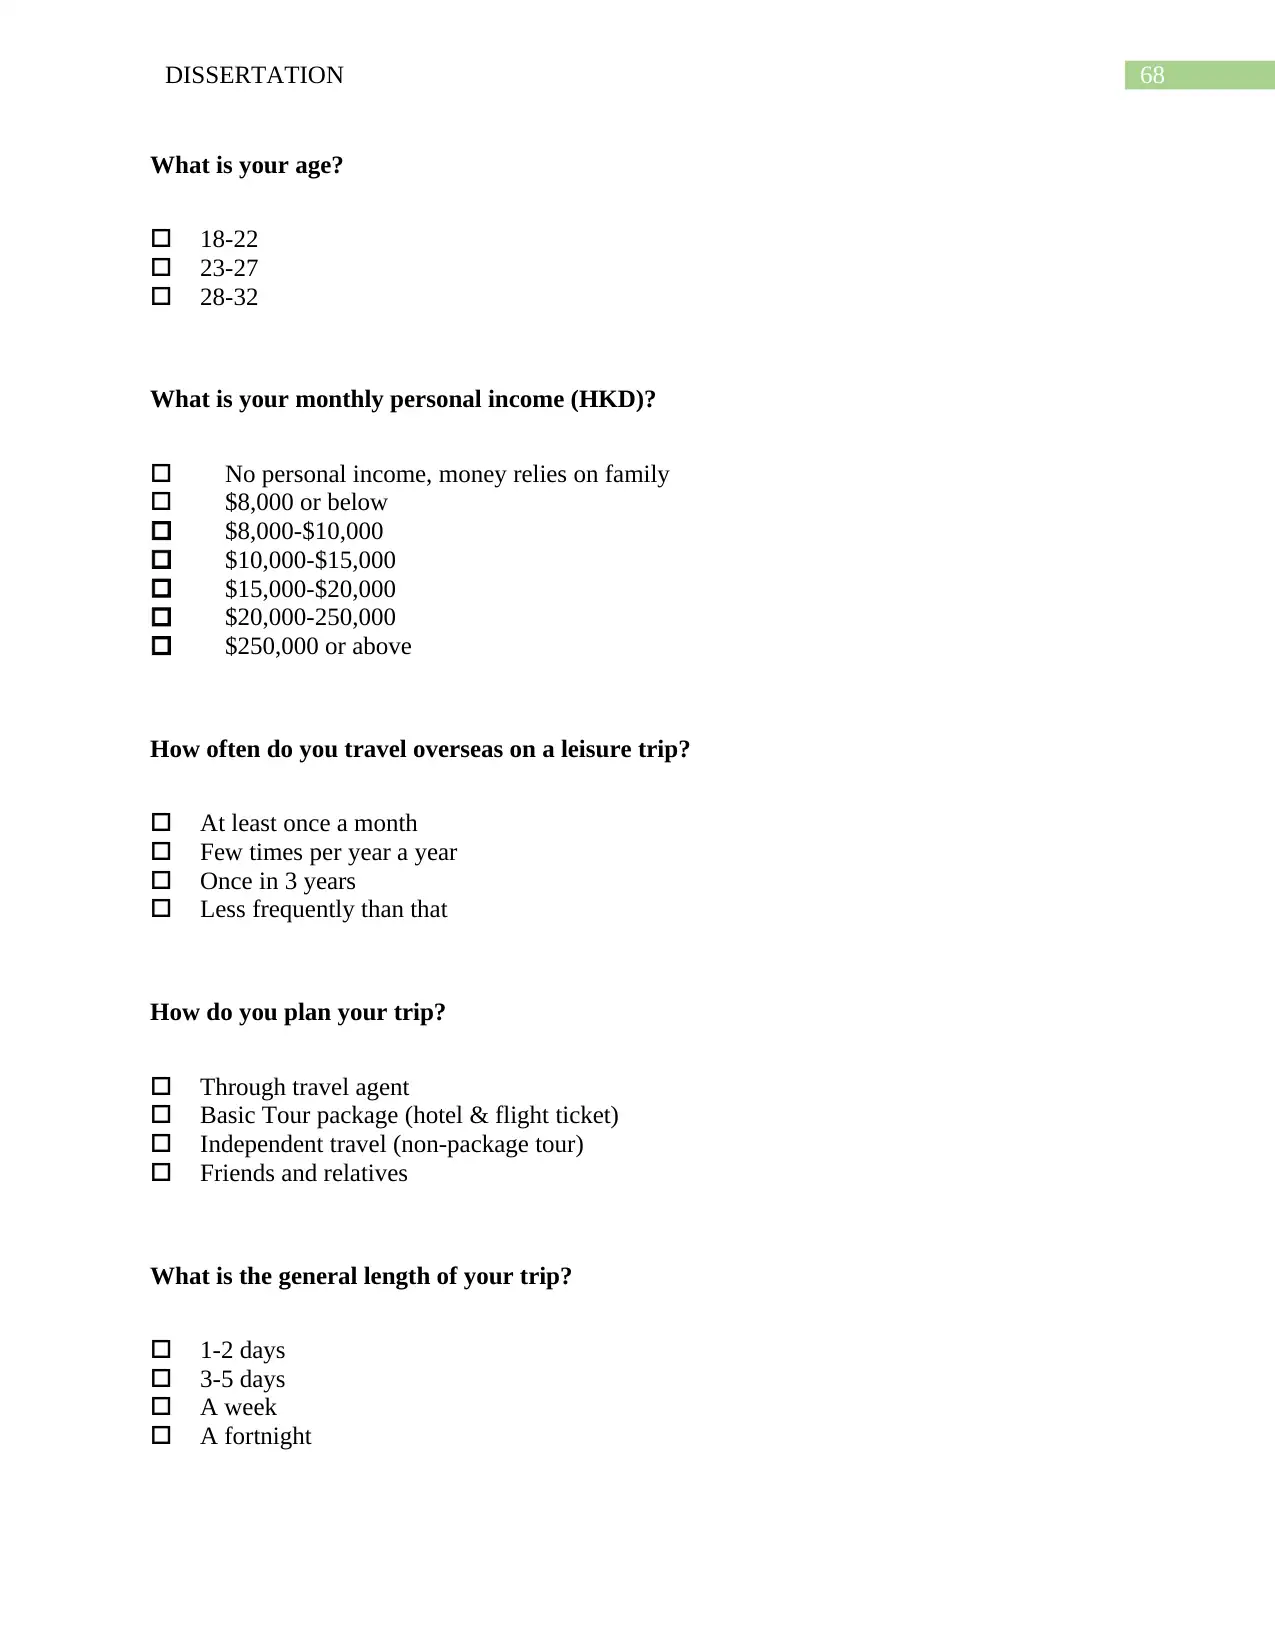
68DISSERTATION
What is your age?
18-22
23-27
28-32
What is your monthly personal income (HKD)?
No personal income, money relies on family
$8,000 or below
$8,000-$10,000
$10,000-$15,000
$15,000-$20,000
$20,000-250,000
$250,000 or above
How often do you travel overseas on a leisure trip?
At least once a month
Few times per year a year
Once in 3 years
Less frequently than that
How do you plan your trip?
Through travel agent
Basic Tour package (hotel & flight ticket)
Independent travel (non-package tour)
Friends and relatives
What is the general length of your trip?
1-2 days
3-5 days
A week
A fortnight
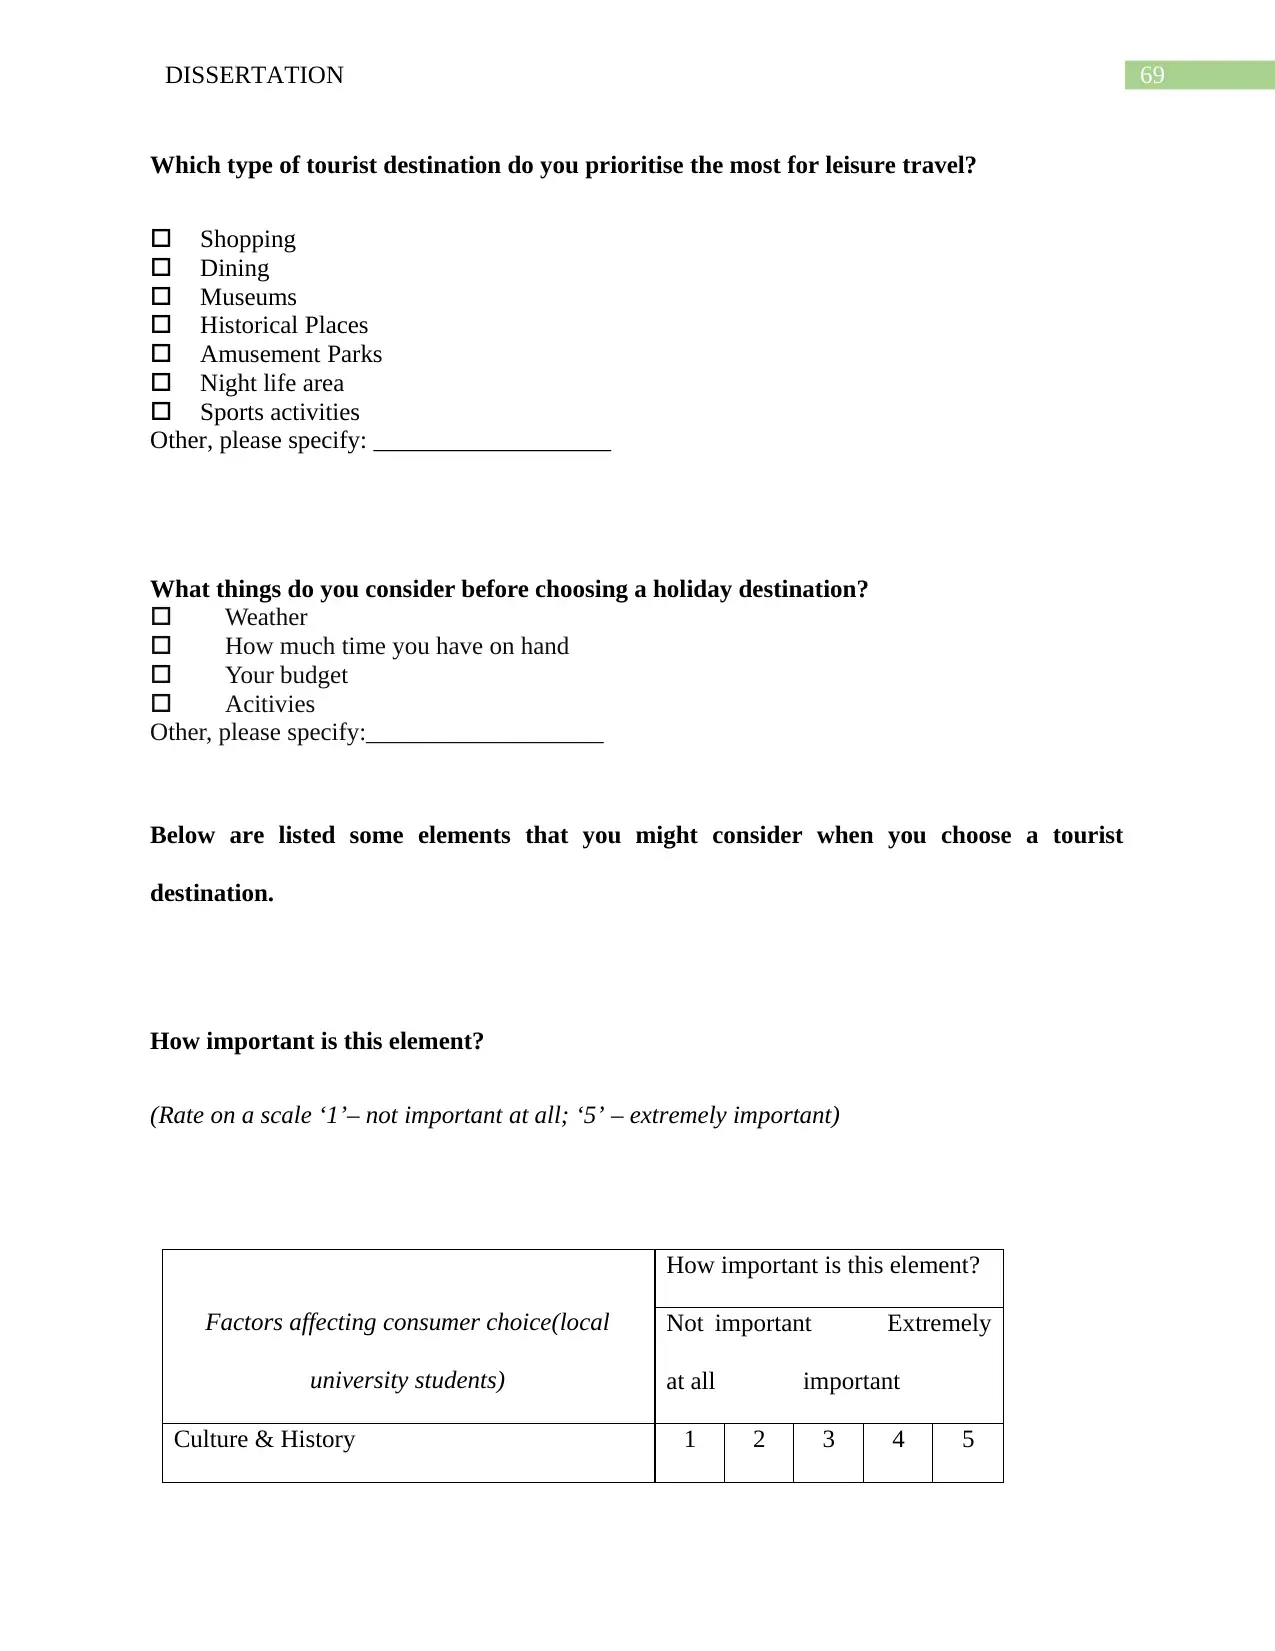
69DISSERTATION
Which type of tourist destination do you prioritise the most for leisure travel?
Shopping
Dining
Museums
Historical Places
Amusement Parks
Night life area
Sports activities
Other, please specify: ___________________
What things do you consider before choosing a holiday destination?
Weather
How much time you have on hand
Your budget
Acitivies
Other, please specify:___________________
Below are listed some elements that you might consider when you choose a tourist
destination.
How important is this element?
(Rate on a scale ‘1’– not important at all; ‘5’ – extremely important)
Factors affecting consumer choice(local
university students)
How important is this element?
Not important Extremely
at all important
Culture & History 1 2 3 4 5
Secure Best Marks with AI Grader
Need help grading? Try our AI Grader for instant feedback on your assignments.
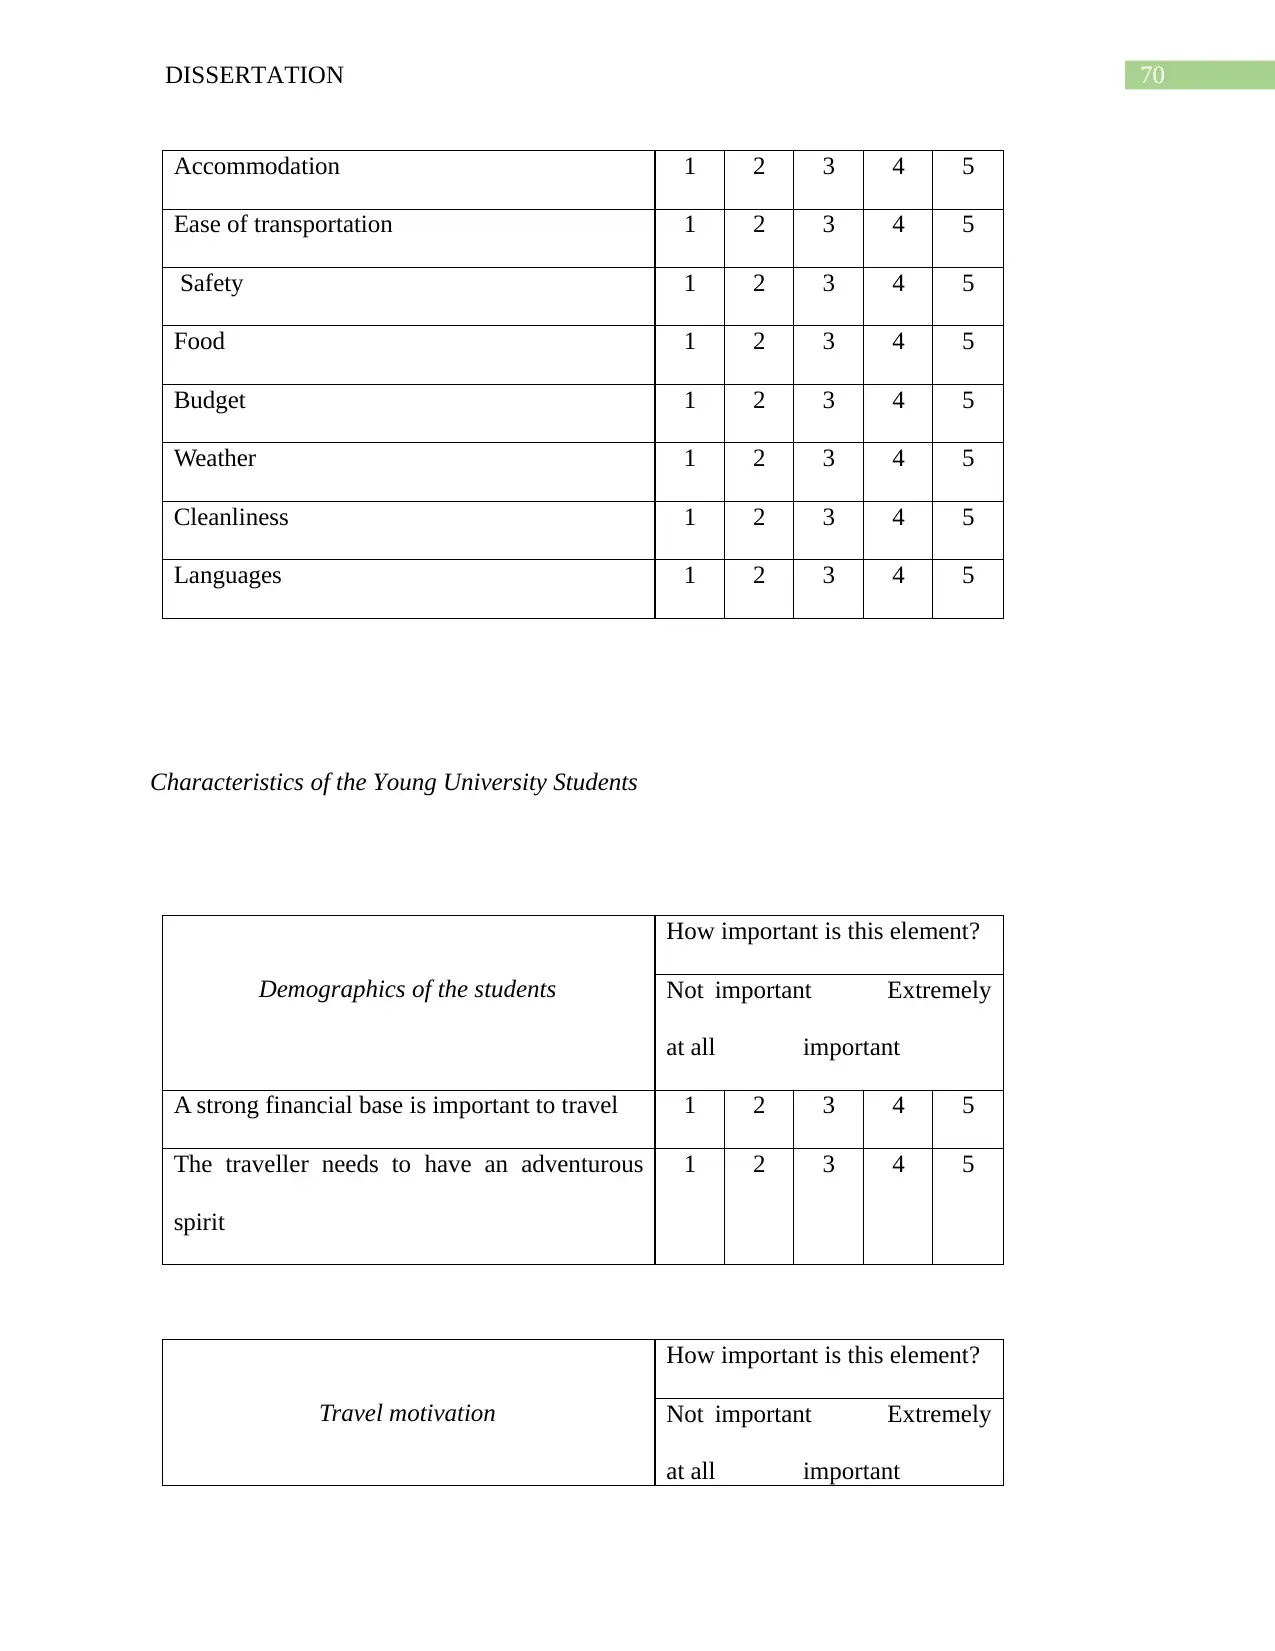
70DISSERTATION
Accommodation 1 2 3 4 5
Ease of transportation 1 2 3 4 5
Safety 1 2 3 4 5
Food 1 2 3 4 5
Budget 1 2 3 4 5
Weather 1 2 3 4 5
Cleanliness 1 2 3 4 5
Languages 1 2 3 4 5
Characteristics of the Young University Students
Demographics of the students
How important is this element?
Not important Extremely
at all important
A strong financial base is important to travel 1 2 3 4 5
The traveller needs to have an adventurous
spirit
1 2 3 4 5
Travel motivation
How important is this element?
Not important Extremely
at all important
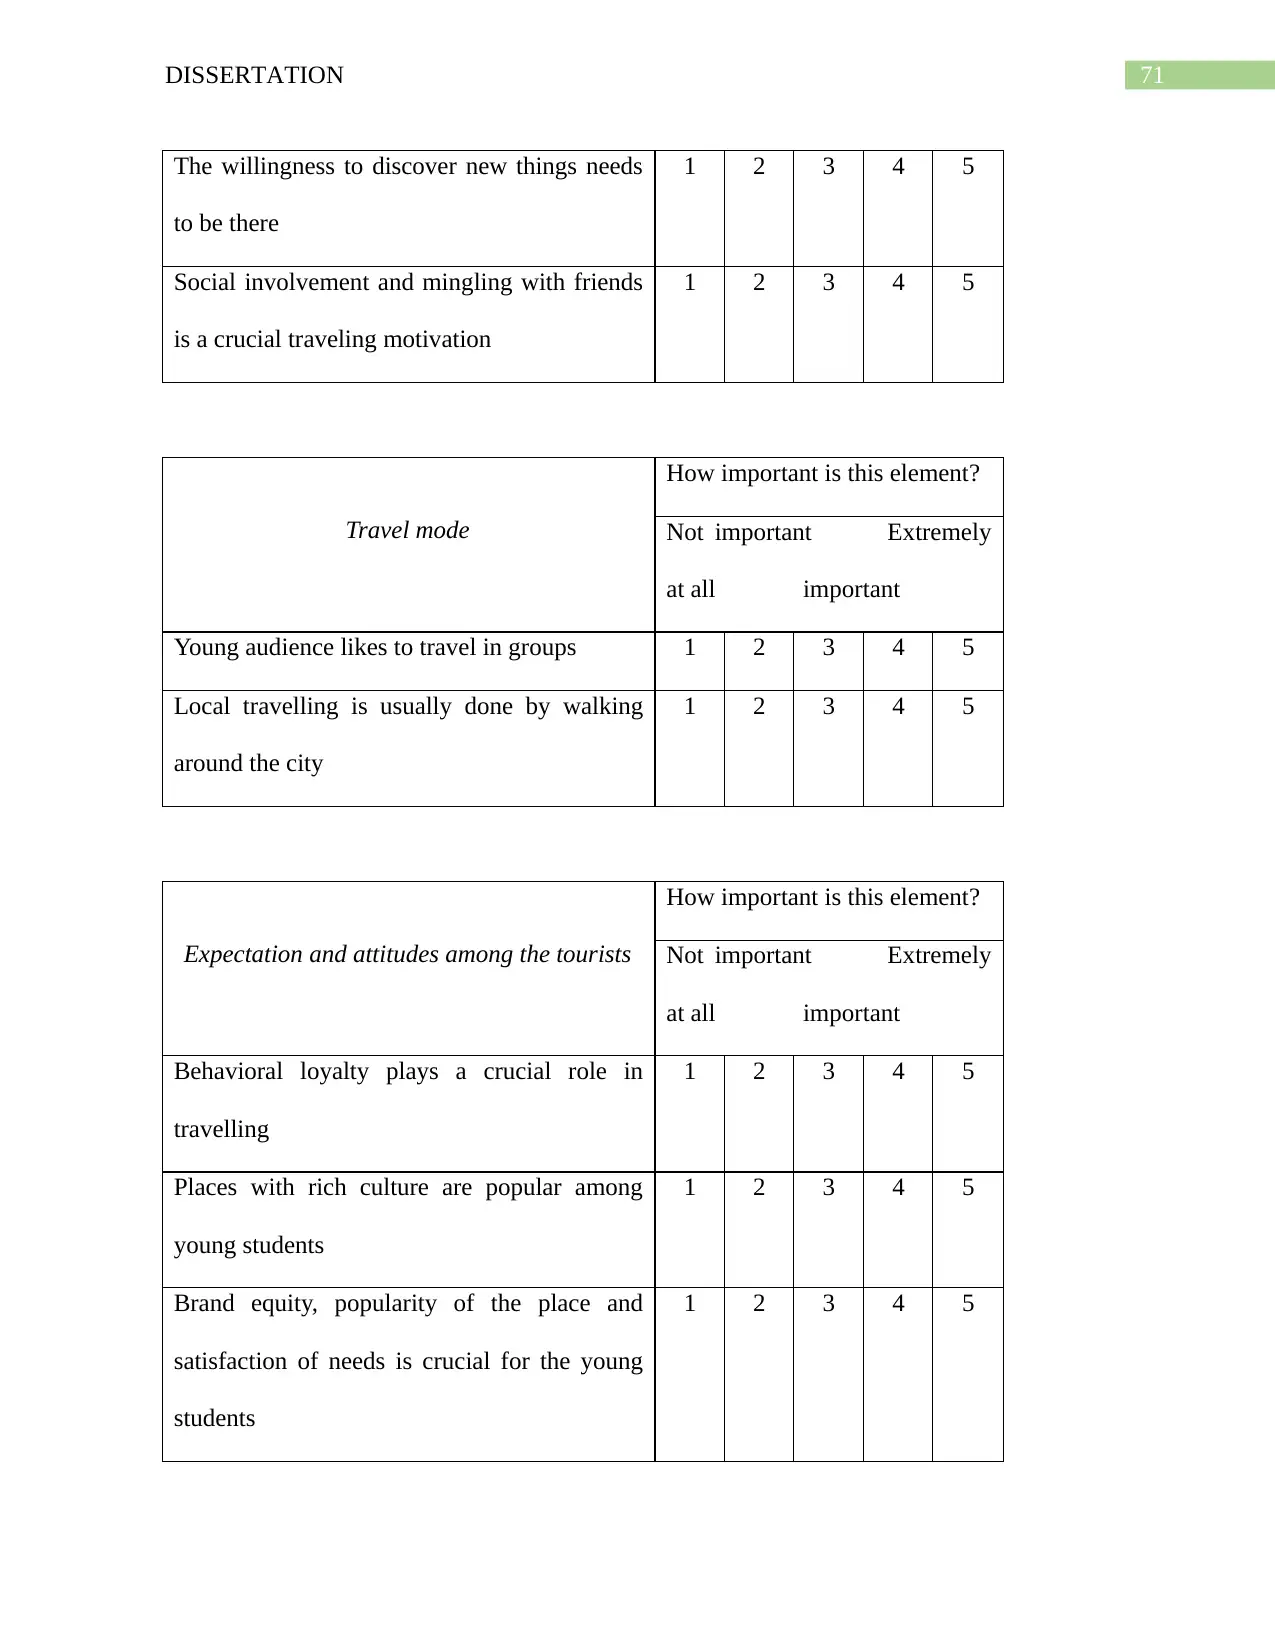
71DISSERTATION
The willingness to discover new things needs
to be there
1 2 3 4 5
Social involvement and mingling with friends
is a crucial traveling motivation
1 2 3 4 5
Travel mode
How important is this element?
Not important Extremely
at all important
Young audience likes to travel in groups 1 2 3 4 5
Local travelling is usually done by walking
around the city
1 2 3 4 5
Expectation and attitudes among the tourists
How important is this element?
Not important Extremely
at all important
Behavioral loyalty plays a crucial role in
travelling
1 2 3 4 5
Places with rich culture are popular among
young students
1 2 3 4 5
Brand equity, popularity of the place and
satisfaction of needs is crucial for the young
students
1 2 3 4 5
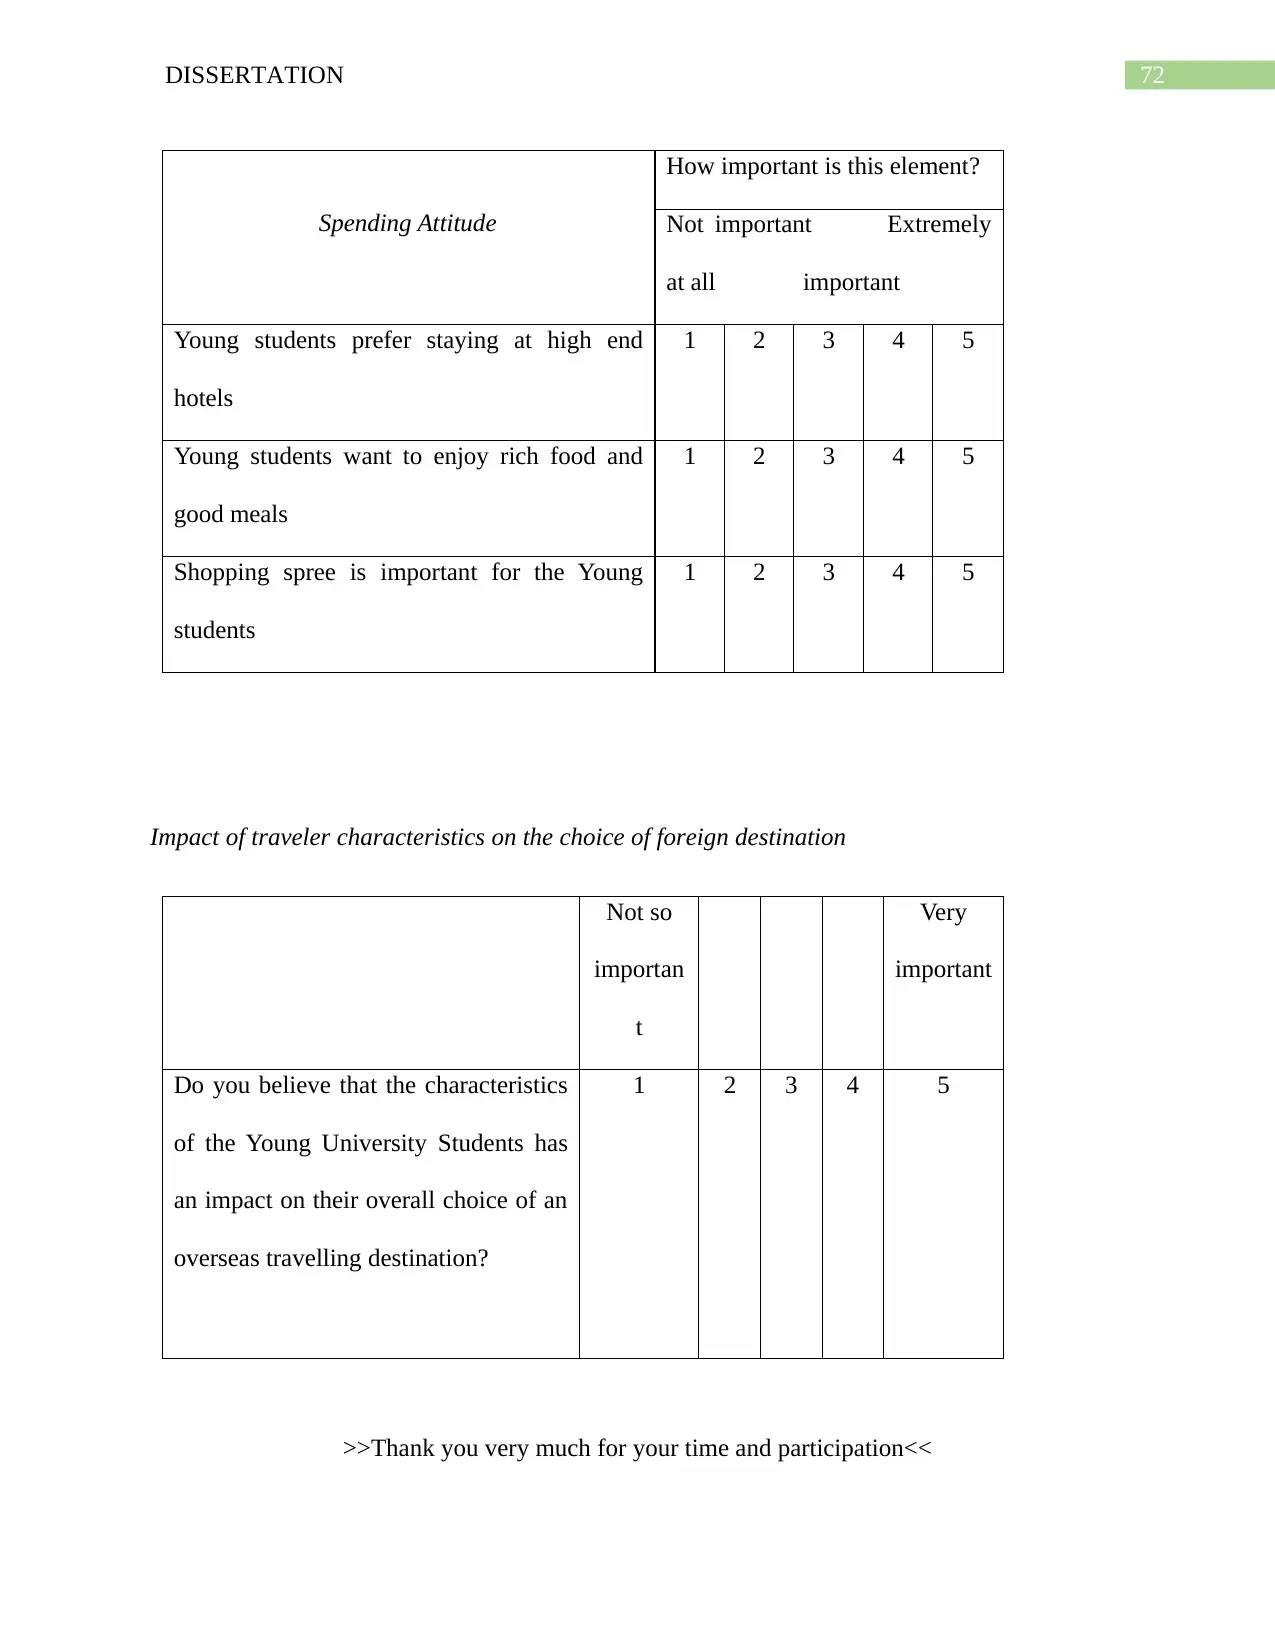
72DISSERTATION
Spending Attitude
How important is this element?
Not important Extremely
at all important
Young students prefer staying at high end
hotels
1 2 3 4 5
Young students want to enjoy rich food and
good meals
1 2 3 4 5
Shopping spree is important for the Young
students
1 2 3 4 5
Impact of traveler characteristics on the choice of foreign destination
Not so
importan
t
Very
important
Do you believe that the characteristics
of the Young University Students has
an impact on their overall choice of an
overseas travelling destination?
1 2 3 4 5
>>Thank you very much for your time and participation<<
Paraphrase This Document
Need a fresh take? Get an instant paraphrase of this document with our AI Paraphraser

73DISSERTATION
1 out of 74
Related Documents


Your All-in-One AI-Powered Toolkit for Academic Success.
+13062052269
info@desklib.com
Available 24*7 on WhatsApp / Email
![[object Object]](/_next/static/media/star-bottom.7253800d.svg)
Unlock your academic potential
© 2024 | Zucol Services PVT LTD | All rights reserved.