logo

Econometrics and Business Statistics

15 Pages2830 Words124 Views
   

Added on  2023-06-12

About This Document

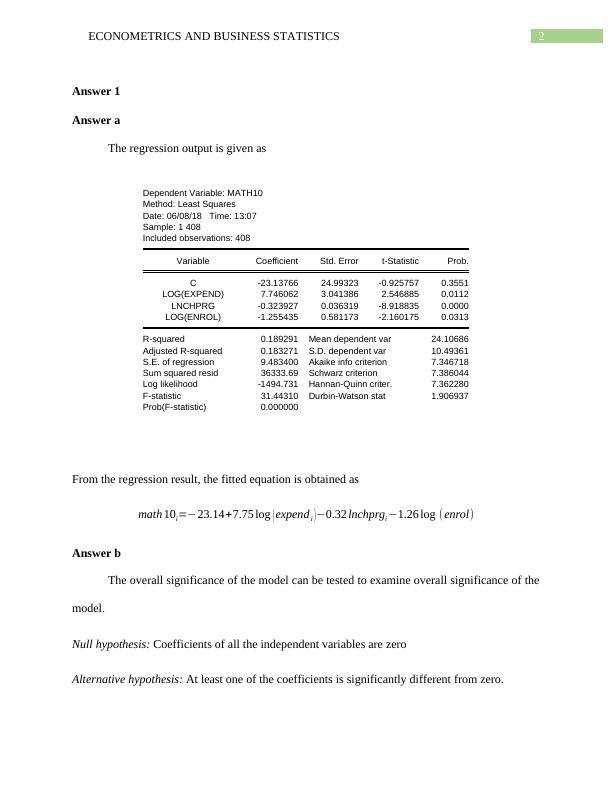
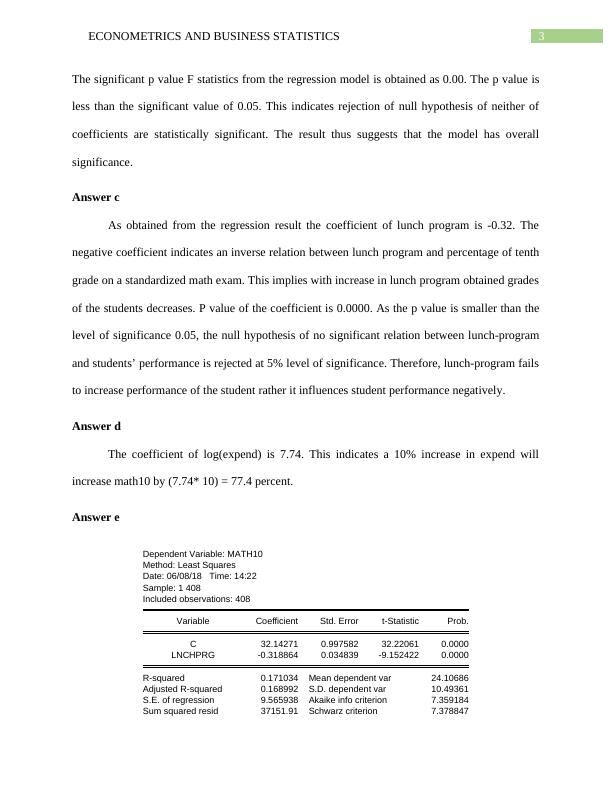
The article discusses regression output, overall significance of the model, relation between lunch program and percentage of tenth grade on a standardized math exam, relation between inflation and 3 months T-bill rate, and test of serial autocorrelation. It also includes a line plot of T-bill rate, inflation rate and federal budget balance, and Newy-West standard error estimation model.

Econometrics and Business Statistics

   Added on 2023-06-12

ShareRelated Documents
Running Head: ECONOMETRICS AND BUSINESS STATISTICS
ECONOMETRICS AND BUSINESS STATISTICS
Name of the Student
Name of the University
Author Note
Econometrics and Business Statistics_1
1ECONOMETRICS AND BUSINESS STATISTICS
Table of Contents
Answer 1..........................................................................................................................................3
Answer a......................................................................................................................................3
Answer b......................................................................................................................................3
Answer c......................................................................................................................................4
Answer d......................................................................................................................................4
Answer e......................................................................................................................................4
Answer 2..........................................................................................................................................5
Answer a......................................................................................................................................5
Answer b......................................................................................................................................6
Answer c......................................................................................................................................6
Answer d......................................................................................................................................7
Answer e......................................................................................................................................7
Part f.............................................................................................................................................9
Part g..........................................................................................................................................10
Answer 3........................................................................................................................................11
Answer a....................................................................................................................................11
Answer b....................................................................................................................................11
Answer c....................................................................................................................................12
Answer d....................................................................................................................................13
Answer e....................................................................................................................................14
Answer f.....................................................................................................................................15
Econometrics and Business Statistics_2
2ECONOMETRICS AND BUSINESS STATISTICS
Answer 1
Answer a
The regression output is given as
Dependent Variable: MATH10
Method: Least Squares
Date: 06/08/18 Time: 13:07
Sample: 1 408
Included observations: 408
Variable Coefficient Std. Error t-Statistic Prob.
C -23.13766 24.99323 -0.925757 0.3551
LOG(EXPEND) 7.746062 3.041386 2.546885 0.0112
LNCHPRG -0.323927 0.036319 -8.918835 0.0000
LOG(ENROL) -1.255435 0.581173 -2.160175 0.0313
R-squared 0.189291 Mean dependent var 24.10686
Adjusted R-squared 0.183271 S.D. dependent var 10.49361
S.E. of regression 9.483400 Akaike info criterion 7.346718
Sum squared resid 36333.69 Schwarz criterion 7.386044
Log likelihood -1494.731 Hannan-Quinn criter. 7.362280
F-statistic 31.44310 Durbin-Watson stat 1.906937
Prob(F-statistic) 0.000000
From the regression result, the fitted equation is obtained as
math 10i=23.14+7.75 log ( expend i )0.32 lnchprgi 1.26 log (enrol)
Answer b
The overall significance of the model can be tested to examine overall significance of the
model.
Null hypothesis: Coefficients of all the independent variables are zero
Alternative hypothesis: At least one of the coefficients is significantly different from zero.
Econometrics and Business Statistics_3
3ECONOMETRICS AND BUSINESS STATISTICS
The significant p value F statistics from the regression model is obtained as 0.00. The p value is
less than the significant value of 0.05. This indicates rejection of null hypothesis of neither of
coefficients are statistically significant. The result thus suggests that the model has overall
significance.
Answer c
As obtained from the regression result the coefficient of lunch program is -0.32. The
negative coefficient indicates an inverse relation between lunch program and percentage of tenth
grade on a standardized math exam. This implies with increase in lunch program obtained grades
of the students decreases. P value of the coefficient is 0.0000. As the p value is smaller than the
level of significance 0.05, the null hypothesis of no significant relation between lunch-program
and students’ performance is rejected at 5% level of significance. Therefore, lunch-program fails
to increase performance of the student rather it influences student performance negatively.
Answer d
The coefficient of log(expend) is 7.74. This indicates a 10% increase in expend will
increase math10 by (7.74* 10) = 77.4 percent.
Answer e
Dependent Variable: MATH10
Method: Least Squares
Date: 06/08/18 Time: 14:22
Sample: 1 408
Included observations: 408
Variable Coefficient Std. Error t-Statistic Prob.
C 32.14271 0.997582 32.22061 0.0000
LNCHPRG -0.318864 0.034839 -9.152422 0.0000
R-squared 0.171034 Mean dependent var 24.10686
Adjusted R-squared 0.168992 S.D. dependent var 10.49361
S.E. of regression 9.565938 Akaike info criterion 7.359184
Sum squared resid 37151.91 Schwarz criterion 7.378847
Econometrics and Business Statistics_4

End of preview

Want to access all the pages? Upload your documents or become a member.

Related Documents
Regression Analysis on Effect of Federally Funded School Lunch Program on Student Performance and Short-term Interest Rate
|15
|2684
|375

Probability of Chi Square Statistics
|17
|3311
|188

Applied Finance with Eviews : Assignment - Desklib
|31
|5859
|216

Total panel observations: Variable Coefficient t-Statistic
|7
|1148
|117

Forecasting Nike Quarterly Revenue with Regression Analysis
|14
|1538
|318

Estimation and Testing of Capital Asset Pricing Model Assignment
|12
|1900
|98