ProductsLogo
LogoStudy Documents
LogoAI Grader
LogoAI Answer
LogoAI Code Checker
LogoPlagiarism Checker
LogoAI Paraphraser
LogoAI Quiz
LogoAI Detector
PricingBlogAbout Us
logo

Comparison of Velocity Profiles using Orifice Plate, Nozzle, and Pitot Tube

Verified

Added on  2019/09/25

|7
|1944
|522
Report
AI Summary
The assignment is to determine the velocity profile of air flow using a Pitot tube, measure and calculate air flow characteristics of a Venturi tube, and measure and record flow characteristics of an iris diaphragm valve. The experiments involve connecting measuring points to manometer inlets, recording differential manometer readings, and calculating pressure drops and velocities. Tables 2-4 are provided for recording measured and calculated values.

Contribute Materials

Your contribution can guide someone’s learning journey. Share your documents today.
Document Page
Experimental procedure
You are provided with two long and one short 84.6 mm nominal bore PVC pipes, an inlet
element and a pipe section with extensions which are flanged at both ends, see fig. 6, a
number of nuts and bolts, fexible hoses, a panel of 16 manometers, and an anemometer.
An electrically driven air blower is fiited at the end of the pipe section with extensions
near to the fan outlet. The flow velocity of air through the pipe assembly varied by
changing the potentiometer setting (0 to maximum of 90) on the electrical air blower. The
air flow velocity has been set to increase linearly with the potentiometer settings.
Tappings at selected positions in the pipe wall allow for connections to water
manometers using the hoses provided, to measure head loss. The anemometer can be
positioned centrally at the front of the inlet element, to determine the velocity of the air
when required. Use only the I and J inlets on the manifold for experiments using the
Pitot tubes.
Figure 6. The pipe section without any valves or fittings. The measurement points are
numbered.
Assembling the pipe sections in the GUNT equipment
The pipe sections will have been assembled as shown in fig. 6. An orifice plate, nozzle,
Venturi tube, two Pitot tubes, an iris diaphragm valve, and three pipe bends are provided
and which can be installed at different positions in the pipe sections for the experiments
discussed in the individual sections below.
Determination of the air flow characteristics of the orifice plate and nozzle
1. Unscrew the two long pipe sections at the position shown by the red arrow on fig. 1,
and slightly push away the intake pipe which is connected through the short pipe
section to the inlet element, giving enough space for the measuring flange which
contains the orifice plate or nozzle. Position the intake pipe bench and the fan bench
next to each other, and make sure that the pins on the fan bench are guided into the
holes on the intake pipe bench. Use the tow clamps to connect the frames to each
other. Lock the rollers on the intake pipe bench and the fan bench to prevent them
rolling away.
2. Install the orifice plate or nozzle into the measuring flange, see fig. 7, by loosening
the four screws on the measuring flange, and carefully pulling the right half of the
measuring flange to the side. Put the 50mm internal diameter orifice plate or nozzle
into the measuring flange until it sits cleanly in the groove (take note of the direction
of flow: airflow should be into the wide end of the nozzle). Put the two halves of the

Secure Best Marks with AI Grader

Need help grading? Try our AI Grader for instant feedback on your assignments.
Document Page
measuring flanges together and bolt them back together.
Figure 7. The measurement flange.
3. Screw the measuring flange between the intake pipe and the pipe section on the fan
bench, as shown in the Figure 8. Remove the pinhole from the fan outlet.
Figure 8. The pipe section with the measurement flange in place.
4. Use the hoses to connect measuring points 15 and 16 to the inlets on the manometer
panel, ensuring that there are no kinks in the hoses.
5. Switch on the fan, with the potentiometer set to zero. Note the level of water in the
manometers before starting the experiment.
6. Orifice plate and nozzle: for five different potentiometer settings record the
differential manometer Δh (mm of water), and measure the corresponding air flow
velocities using the anemometer.
Treatment of results
The velocity of flow of air through is proportional to the square root of the differential
head across the manometer. Tabulate your measured and derived values under the
headings shown in Table 1.
Potentiometer settings h P P Air velocity
Document Page
/mm /N.m-2 /N0.5.m /m.s-1
Table 1. Measured and calculated parameters for air flow through a orifice or nozzle
Calculate P and P between measurement points 15 and 16 for each of the five
potentiometer settings. Plot on one graph the air flow velocities versus P for both
orifice plate and nozzle, and compare your results with the expression for flow through
orifice plate and nozzle: V1 = constant x P.
Determination of the velocity profile of air flow using the Pitot tube.
1. Repeat parts 2 – 6 of the instructions for “Determination of air flow characteristics of
the orifice plate and nozzle” on pages 89 & 90.
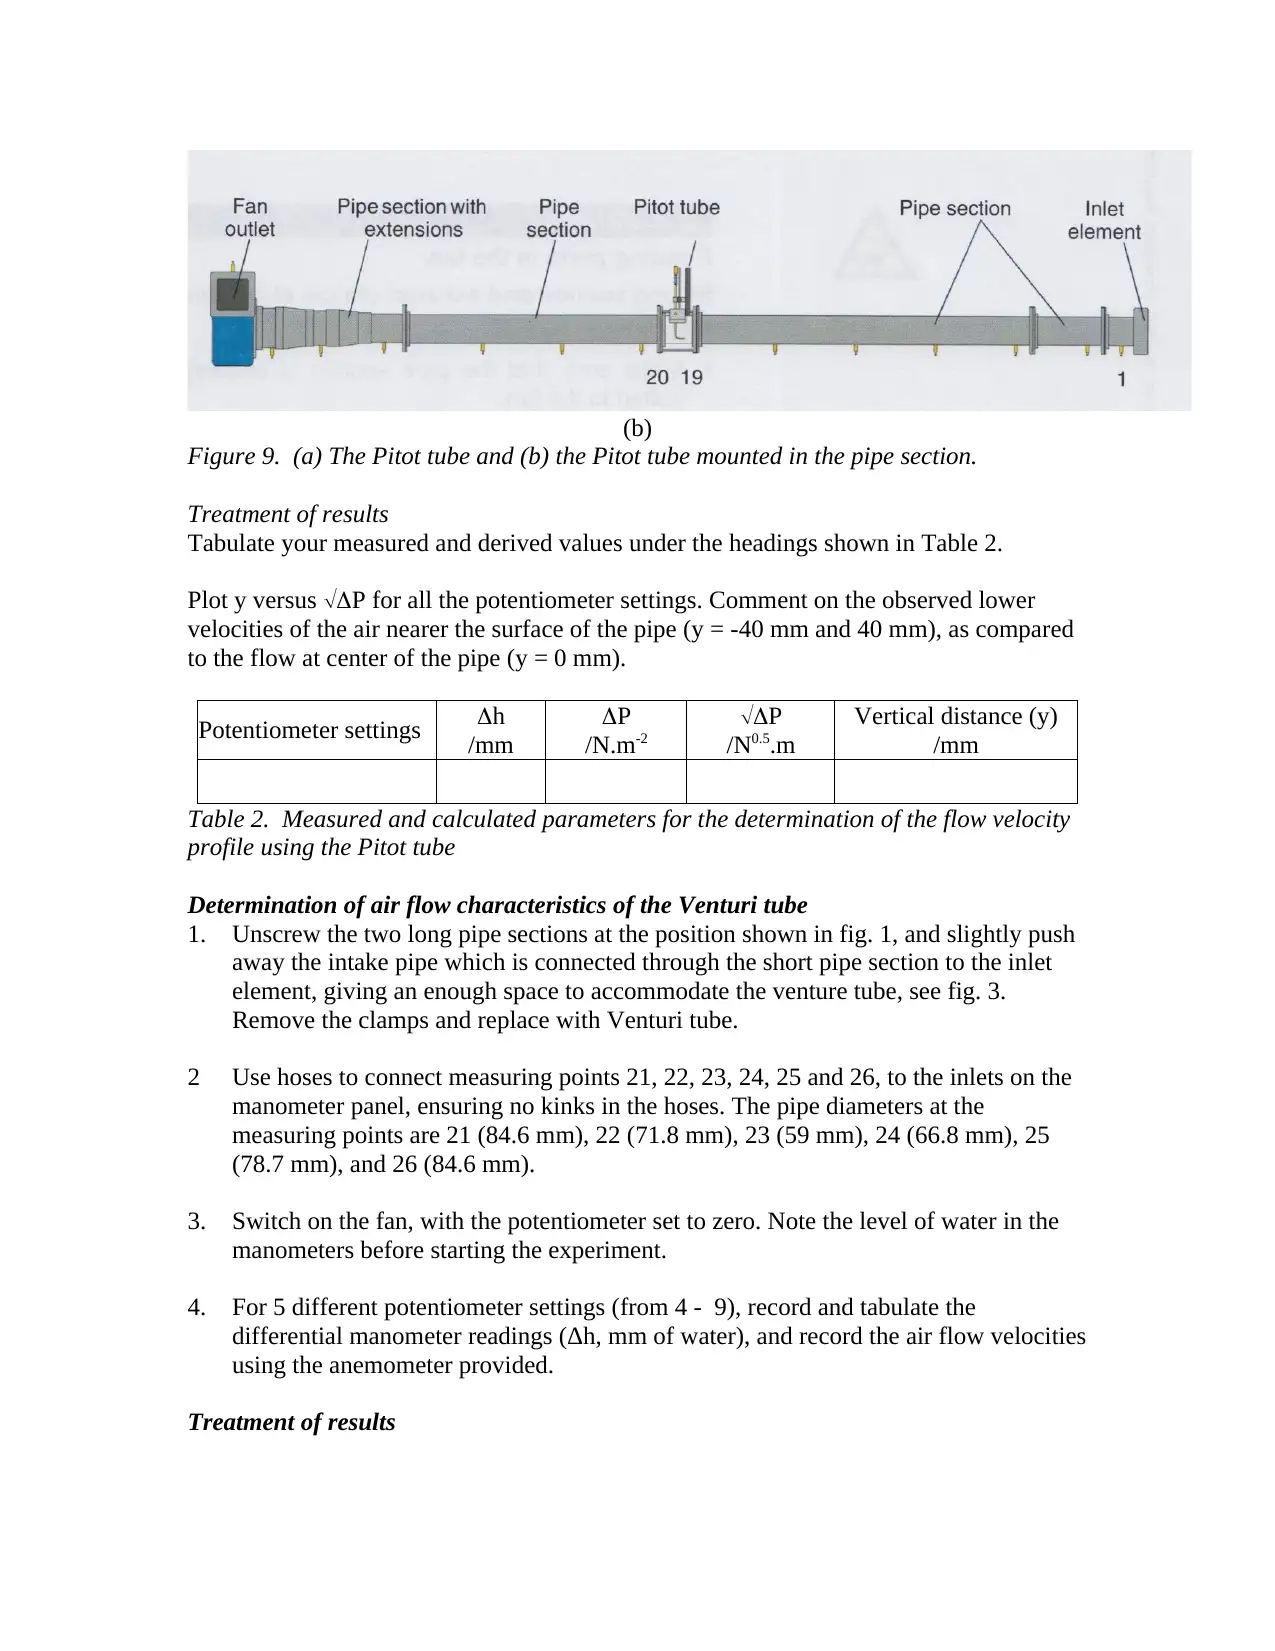
2. Screw the Pitot tube in pipe section between the intake pipe and the pipe section on
the fan bench, as shown in figs. 9(a) & (b). Use hoses to connect measuring points 19
and 20 to manometer inlets I and J (these manometers have smaller internal diameter
to improve the sensitivity of the Pitot tube) to the two inlets on the manometer panel
dedicated to the Pitot tube experiments, ensuring no kinks in the hoses.
3. Switch on the fan, with the potentiometer set to zero. Note the level of water in the
manometers before starting the experiment.
4. Pitot tube: for 3 different potentiometer settings (3 - 9), record and tabulate the
differential manometer readings Δh (mm of water), and the vertical distances (y) of
the Pitot tube from the center of the pipe (-40, -20, 0, 20 and 40mm).
(a)
Document Page
(b)
Figure 9. (a) The Pitot tube and (b) the Pitot tube mounted in the pipe section.
Treatment of results
Tabulate your measured and derived values under the headings shown in Table 2.
Plot y versus P for all the potentiometer settings. Comment on the observed lower
velocities of the air nearer the surface of the pipe (y = -40 mm and 40 mm), as compared
to the flow at center of the pipe (y = 0 mm).
Potentiometer settings h
/mm
P
/N.m-2
P
/N0.5.m
Vertical distance (y)
/mm
Table 2. Measured and calculated parameters for the determination of the flow velocity
profile using the Pitot tube
Determination of air flow characteristics of the Venturi tube
1. Unscrew the two long pipe sections at the position shown in fig. 1, and slightly push
away the intake pipe which is connected through the short pipe section to the inlet
element, giving an enough space to accommodate the venture tube, see fig. 3.
Remove the clamps and replace with Venturi tube.
2 Use hoses to connect measuring points 21, 22, 23, 24, 25 and 26, to the inlets on the
manometer panel, ensuring no kinks in the hoses. The pipe diameters at the
measuring points are 21 (84.6 mm), 22 (71.8 mm), 23 (59 mm), 24 (66.8 mm), 25
(78.7 mm), and 26 (84.6 mm).
3. Switch on the fan, with the potentiometer set to zero. Note the level of water in the
manometers before starting the experiment.
4. For 5 different potentiometer settings (from 4 - 9), record and tabulate the
differential manometer readings (Δh, mm of water), and record the air flow velocities
using the anemometer provided.
Treatment of results

Paraphrase This Document

Need a fresh take? Get an instant paraphrase of this document with our AI Paraphraser
Document Page
Calculate P and P at various measuring points 22 – 26, using measuring point 21 as
your reference point. Tabulate your measured and calculated values under the headings
shown in Table 3.
Potentiometer
settings Measuring points h
/mm
P
/N.m-2
P
/N0.5.m
Air velocity
/m.s-1
Table 3. Measured and calculated parameters for air flow through a Venturi tube.
Plot air flow velocity versus P for the Venturi tube at measuring point 23 (maximum
pressure drop) for all the potentiometer settings. Also, plot P versus measuring points
from 22 to 26 (P = 0 at reference measuring point 21) for all the potentiometer settings.
Give reasons why the pressure drop at the measuring point 26 is different from that at
measuring point 21.
Measurement of flow characteristics of iris diaphragm valve
1. Unscrew the two long pipe sections at the position shown in Figure 1, and slightly
push away the intake pipe which is connected through the short pipe section to the
inlet element, giving a enough space for the iris diaphragm valve in pipe section.
Position the intake pipe bench and the fan bench next to each other, and make sure
that the pins on the fan bench are guided into the holes on the intake pipe bench. Use
the tow clamps to connect the frames to each other. Lock the rollers on the intake
pipe bench and the fan bench to prevent them rolling away.
2. Screw the iris diaphragm valve (see fig. 10(a)) between the intake pipe and the pipe
section on the fan bench as shown in fig.10(b). Remove the pinhole from the fan
outlet.
3. Use the hoses to connect measuring points 17 and 18 to the inlets on the manometer
panel, ensuring no kinks in the hoses.
4. Switch on the fan, with the potentiometer set to zero. Note the level of water in the
manometers before starting the experiment.
Document Page
(a)
(b)
Figure 10. (a) The iris diaphragm valve and (b) the complete pipe assembly.
5. Iris diaphragm valve: for each of the potentiometer settings 2, 3, 4, 5, and 6, measure
and record the differential manometer readings (Δh, mm of water) at the iris valve
opening positions 1 – 6. The diameters of the iris valve at the various opening
positions are No.1 (43 mm), No.2 (47.5 mm), No.3 (55 mm), No.4 (61 mm), No.5
(68 mm), and No.6 (74 mm). The diameter of the valve when fully closed is 38.5 mm
and 80 mm when fully open.
Treatment of results
Calculate P and use the chart in Figure 11 to obtain the air flow rates at various P.
Tabulate your measured and derived values under the headings shown in Table 4.
Potentiometer settings
h
/mm
P
/N.m-2
Air flowrate
/dm3.s-1
% valve opening
diameter
Table 4. Measured and calculated parameters for air flow through the iris diaphragm
valve.
Plot a graph of air flowrate against % valve opening diameters. Comment on the flow
characteristics of the iris diaphragm valve.
Document Page
Figure 11. Chart for calculation of air flow rates from the pressure drop across the iris
diaphragm valve.
P is in Pascals = Nm-2.
1 out of 7
[object Object]

Your All-in-One AI-Powered Toolkit for Academic Success.

Available 24*7 on WhatsApp / Email

[object Object]