Factor Analysis
Added on 2023-01-18
26 Pages1823 Words79 Views
FACTOR ANALYSIS
TABLE OF CONTENTS
Method.............................................................................................................................................1
Results..............................................................................................................................................2
Extraversion.....................................................................................................................................2
Non-rotation................................................................................................................................2
Neuroticism......................................................................................................................................5
Non-rotation................................................................................................................................5
Openness..........................................................................................................................................8
Non-rotation................................................................................................................................8
Rotation.....................................................................................................................................10
Agreeableness................................................................................................................................13
Non-rotation..............................................................................................................................13
Rotation.....................................................................................................................................15
Conscientiousness..........................................................................................................................19
Non-rotation..............................................................................................................................19
REFERENCE.................................................................................................................................22
Method
In the present research study factor analysis method is used. This method is used in social
science and market research. In the questionnaire multiple questions are covered and few of them
need to be select for proper analysis. Selection of variable out of available questions is done on
basis of factor analysis results (Mackey and Gass, 2015). Two approaches of factor analysis are
used to obtain results namely principle component analysis and rotation method. In few cases
rotation method does not generate any sort of result and due to this reason relevant tables are not
added in the file. Sometimes, the initial solution results in strong correlations of a variable with
several factors or in a variable that has no strong correlations with any of the factors (Rahn.,
2019). In order to make the location of the axes fit the actual data points better, the program can
rotate the axes. Ideally, the rotation will make the factors more easily interpretable. In the present
research study sample of 1006 is taken by following stratified random sampling approach. In this
approach from different groups sample units are taken. As in the research children and adults are
taken as sample units. Within children those are also taken that are well familiar with English
and not familiar with the mentioned language.
This, reflect that diverse groups of individuals are taken as sample units in the present
research study. This is done to ensure that data is taken from the reliable sources and to ensure
that it will represent entire population perfectly. There were also options in respect to sampling
methods like simple random sampling method. This method was not picked for research purpose
because under this approach randomly sample units are picked. In this approach there was
probability that specific group of people may not get selected in the sample. Thus, research may
go in wrong direction and it may show results that are far from reality. In order to avoid such
kind of situation stratified sampling method was used instead of simple random sampling
method. In order to collect data questionnaire was distributed among respondents. Through
internet medium and by post data was gathered from the sample units.
After data collection its cleaning was done and under this gathered data was analysed
in proper manner to identify reliability of obtained data (Flick., 2015). Many times, it
happened that respondents provide data but there is absence of consistency in answer. For
example, three questions are interrelated and when respondent’s response will be analysed
1
then answer will be in different direction. If such error is identified then data cleaning is
used to ensure that there is consistency in the answers provided by the respondents. Hence,
data collection and cleaning were important part of the research work. Apart from this,
choice of stratified sampling method also assists in gathering data in better way. Thus, it can
be said that current research study is carried out in proper manner. IPIP big personality
model was selected to prepare entire questionnaire. In questionnaire varied questions are
taken which are based on 5 personality trait models. All questions in the questionnaire are
related to factors openness, conscientiousness, extraversion, agreeableness and neuroticism.
Questions related to these factors are asked to respondents and gathered data is analysed by
using factor analysis method. In this way, entire research work is carried out.
Results
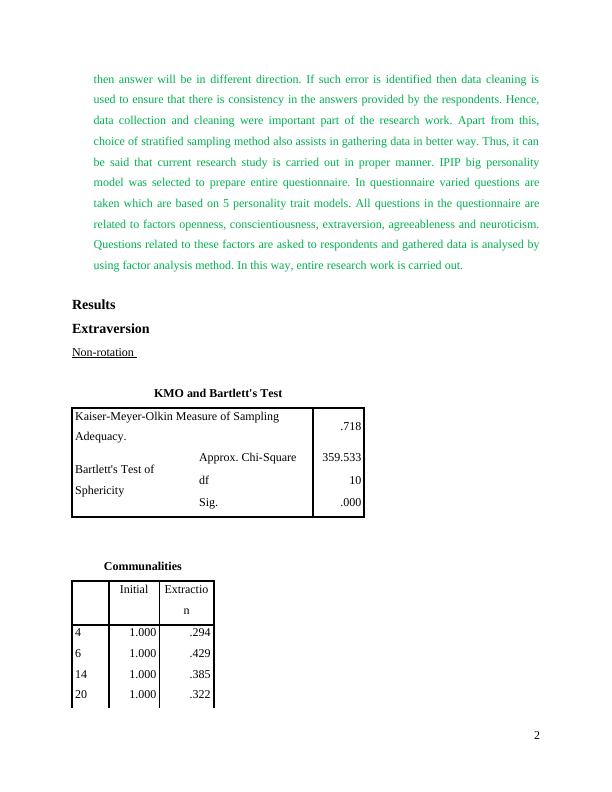
Extraversion
Non-rotation
KMO and Bartlett's Test
Kaiser-Meyer-Olkin Measure of Sampling
Adequacy. .718
Bartlett's Test of
Sphericity
Approx. Chi-Square 359.533
df 10
Sig. .000
Communalities
Initial Extractio
n
4 1.000 .294
6 1.000 .429
14 1.000 .385
20 1.000 .322
2
used to ensure that there is consistency in the answers provided by the respondents. Hence,
data collection and cleaning were important part of the research work. Apart from this,
choice of stratified sampling method also assists in gathering data in better way. Thus, it can
be said that current research study is carried out in proper manner. IPIP big personality
model was selected to prepare entire questionnaire. In questionnaire varied questions are
taken which are based on 5 personality trait models. All questions in the questionnaire are
related to factors openness, conscientiousness, extraversion, agreeableness and neuroticism.
Questions related to these factors are asked to respondents and gathered data is analysed by
using factor analysis method. In this way, entire research work is carried out.
Results
Extraversion
Non-rotation
KMO and Bartlett's Test
Kaiser-Meyer-Olkin Measure of Sampling
Adequacy. .718
Bartlett's Test of
Sphericity
Approx. Chi-Square 359.533
df 10
Sig. .000
Communalities
Initial Extractio
n
4 1.000 .294
6 1.000 .429
14 1.000 .385
20 1.000 .322
2
25 1.000 .428
Extraction Method:
Principal Component
Analysis.
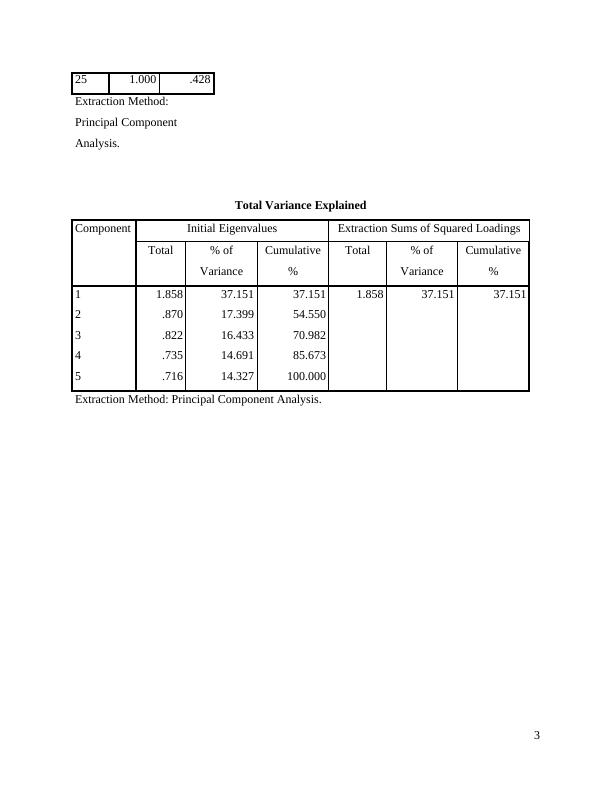
Total Variance Explained
Component Initial Eigenvalues Extraction Sums of Squared Loadings
Total % of
Variance
Cumulative
%
Total % of
Variance
Cumulative
%
1 1.858 37.151 37.151 1.858 37.151 37.151
2 .870 17.399 54.550
3 .822 16.433 70.982
4 .735 14.691 85.673
5 .716 14.327 100.000
Extraction Method: Principal Component Analysis.
3
Extraction Method:
Principal Component
Analysis.
Total Variance Explained
Component Initial Eigenvalues Extraction Sums of Squared Loadings
Total % of
Variance
Cumulative
%
Total % of
Variance
Cumulative
%
1 1.858 37.151 37.151 1.858 37.151 37.151
2 .870 17.399 54.550
3 .822 16.433 70.982
4 .735 14.691 85.673
5 .716 14.327 100.000
Extraction Method: Principal Component Analysis.
3
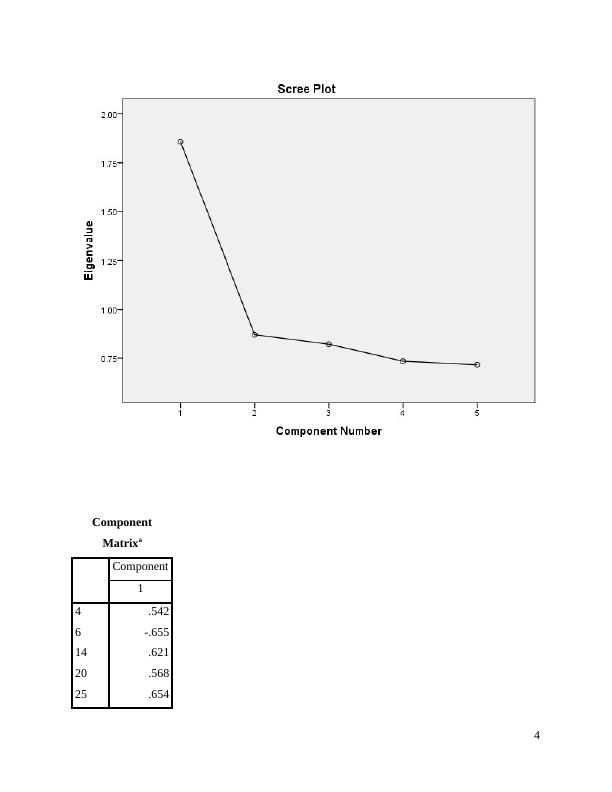
Component
Matrixa
Component
1
4 .542
6 -.655
14 .621
20 .568
25 .654
4
Matrixa
Component
1
4 .542
6 -.655
14 .621
20 .568
25 .654
4
End of preview
Want to access all the pages? Upload your documents or become a member.
Related Documents
Descriptive Analysis Report of Data - Syngentalg...
|18
|3459
|98
Marketing Research Reportlg...
|22
|3211
|360
Statistics Group Project TASK 13 (a) Survey method3 (b) Sampling method3 (c) Sample selection method3 (c) Estimation errors 13 (a) Coefficient of resoluteness for grade of exemlg...
|17
|3134
|119
Impact of Integrated Marketing Communication (IMC) on Brandlg...
|4
|674
|17
Data Collection, Survey Methodology, Statistical Analysis and Sales Graph of Aldi and its Competitorslg...
|47
|3119
|427
COVID-19 and Overseas Travel Restriction Impacts on Domestic Tourism Demandlg...
|11
|2233
|337