Financial Analysis and Management Enterprise Contents
31 Pages3707 Words144 Views
Added on 2021-02-20
About This Document
Financial Analysis and management Enterprise Contents INTRODUCTION 1 MAIN BODY1 Evaluation of the financial performance and financial positionof Sainsbury’s and Tesco1 Evaluation of the Working Capital 19 Evaluation of the Cash Flow 20 CONCLUSION 20 REFERENCES 21 APPENDIX 2 INTRODUCTION Financial analysis is a process of analysing financial statements of an organisation in order to ascertain the financial performance of that company.
Financial Analysis and Management Enterprise Contents
Added on 2021-02-20
ShareRelated Documents
Financial Analysis andmanagement Enterprise
ContentsINTRODUCTION...........................................................................................................................1MAIN BODY..................................................................................................................................1Evaluation of the financial performance and financial position of Sainsbury’s and Tesco........1Evaluation of the Working Capital............................................................................................19Evaluation of the Cash Flow......................................................................................................20CONCLUSION..............................................................................................................................20REFERENCES..............................................................................................................................21APPENDIX......................................................................................................................................2
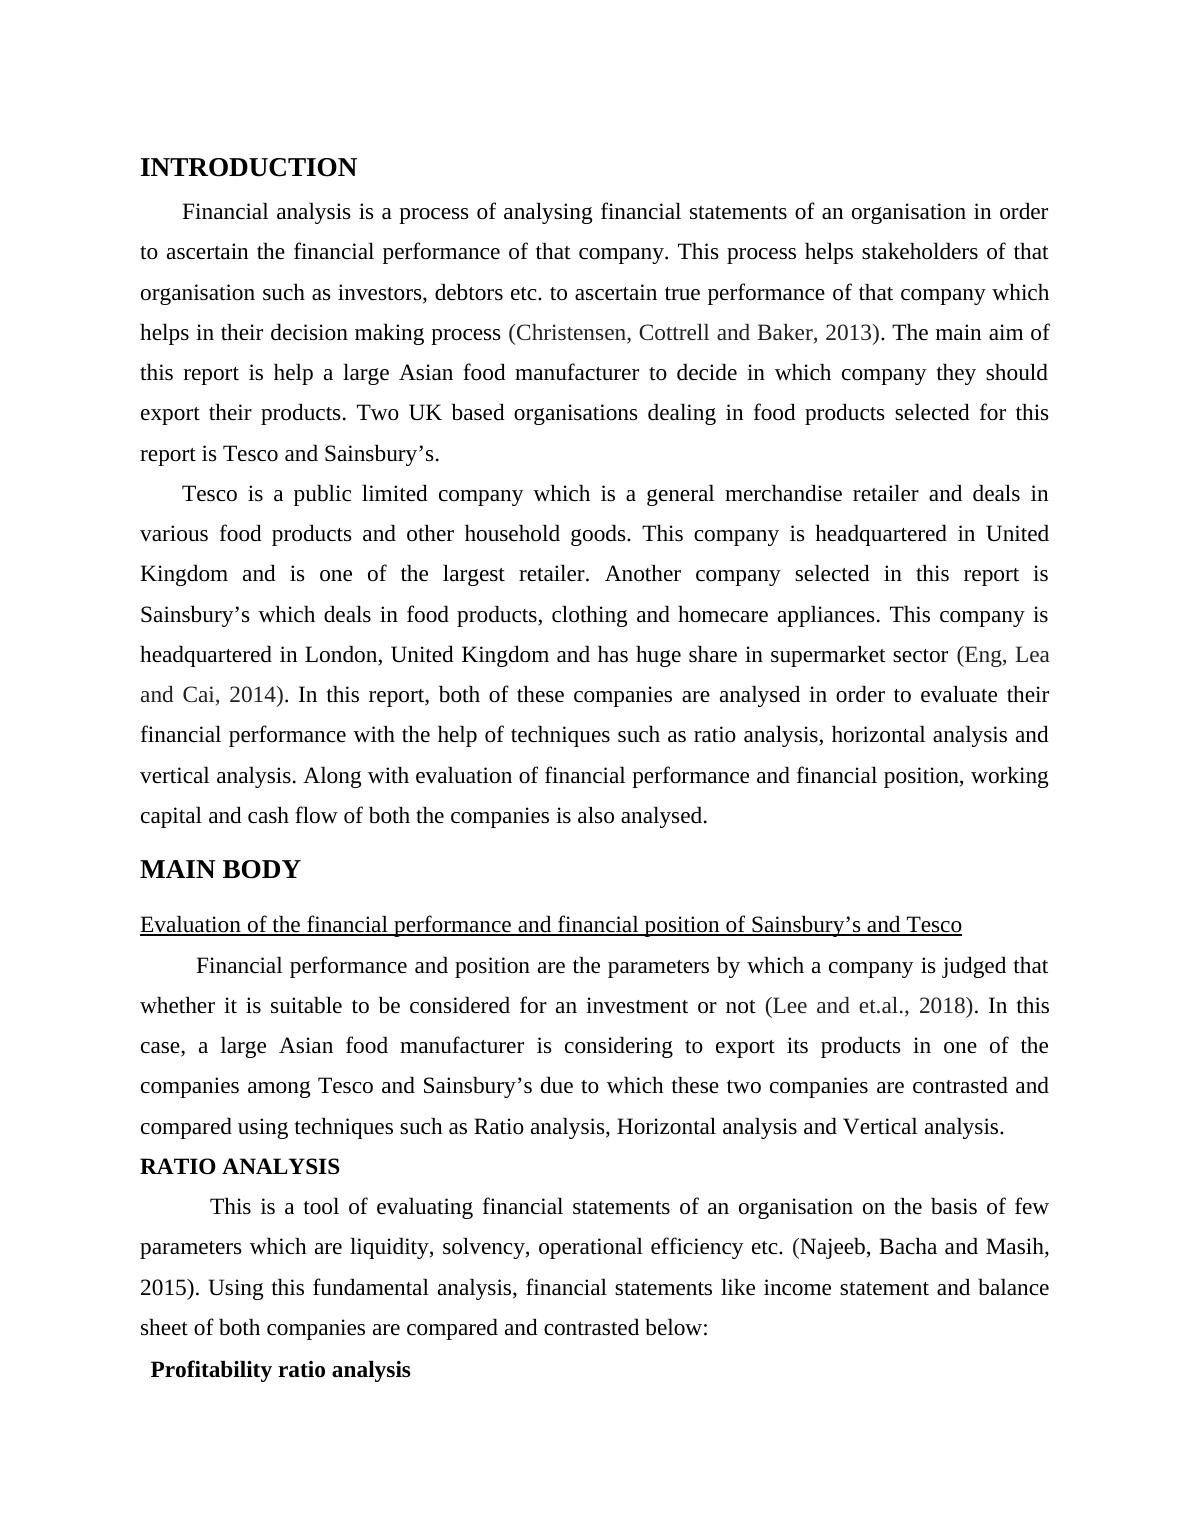
INTRODUCTIONFinancial analysis is a process of analysing financial statements of an organisation in orderto ascertain the financial performance of that company. This process helps stakeholders of thatorganisation such as investors, debtors etc. to ascertain true performance of that company whichhelps in their decision making process (Christensen, Cottrell and Baker, 2013). The main aim ofthis report is help a large Asian food manufacturer to decide in which company they shouldexport their products. Two UK based organisations dealing in food products selected for thisreport is Tesco and Sainsbury’s. Tesco is a public limited company which is a general merchandise retailer and deals invarious food products and other household goods. This company is headquartered in UnitedKingdom and is one of the largest retailer. Another company selected in this report isSainsbury’s which deals in food products, clothing and homecare appliances. This company isheadquartered in London, United Kingdom and has huge share in supermarket sector (Eng, Leaand Cai, 2014). In this report, both of these companies are analysed in order to evaluate theirfinancial performance with the help of techniques such as ratio analysis, horizontal analysis andvertical analysis. Along with evaluation of financial performance and financial position, workingcapital and cash flow of both the companies is also analysed. MAIN BODYEvaluation of the financial performance and financial position of Sainsbury’s and TescoFinancial performance and position are the parameters by which a company is judged thatwhether it is suitable to be considered for an investment or not (Lee and et.al., 2018). In thiscase, a large Asian food manufacturer is considering to export its products in one of thecompanies among Tesco and Sainsbury’s due to which these two companies are contrasted andcompared using techniques such as Ratio analysis, Horizontal analysis and Vertical analysis. RATIO ANALYSISThis is a tool of evaluating financial statements of an organisation on the basis of fewparameters which are liquidity, solvency, operational efficiency etc. (Najeeb, Bacha and Masih,2015). Using this fundamental analysis, financial statements like income statement and balancesheet of both companies are compared and contrasted below:Profitability ratio analysis
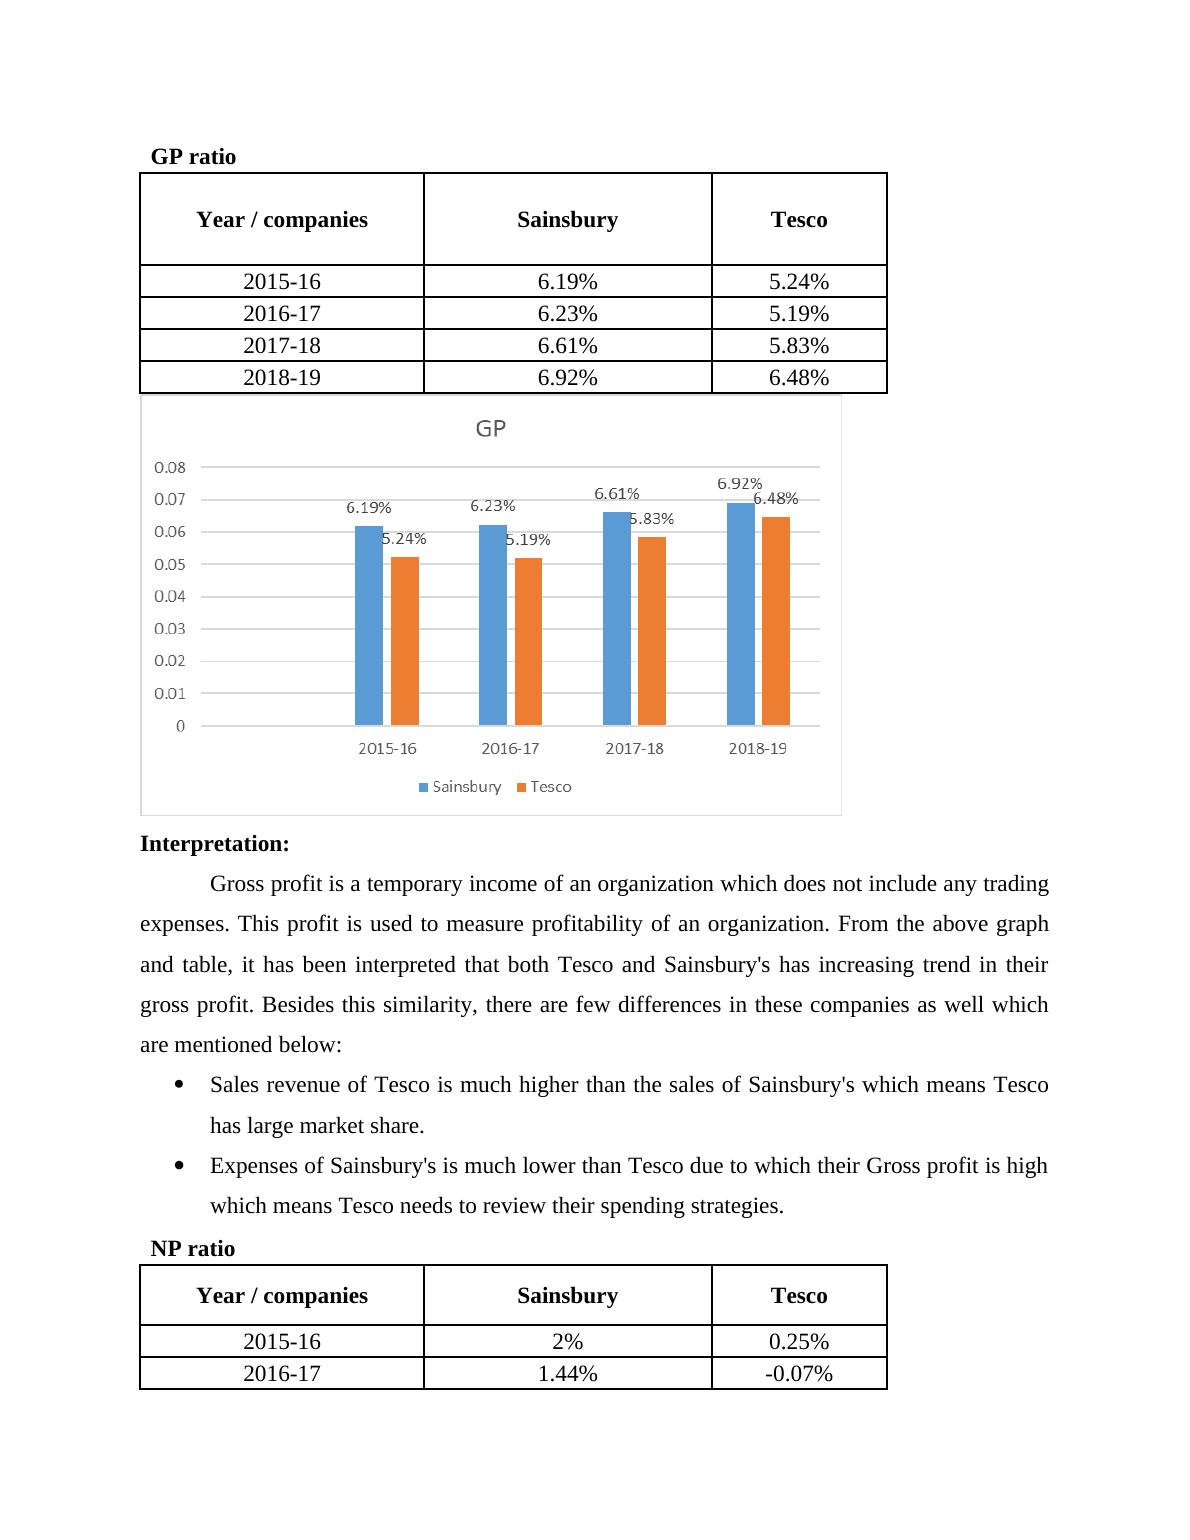
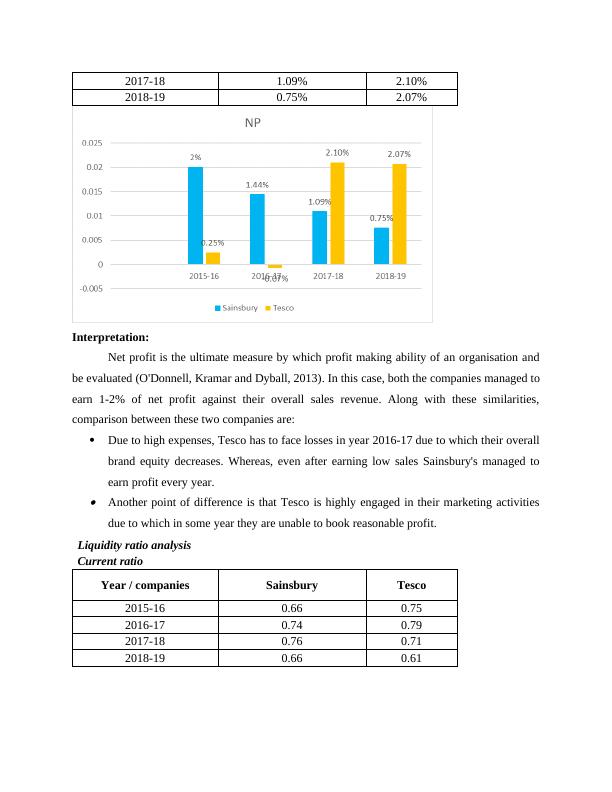
GP ratioYear / companiesSainsburyTesco2015-166.19%5.24%2016-176.23%5.19%2017-186.61%5.83%2018-196.92%6.48%Interpretation:Gross profit is a temporary income of an organization which does not include any tradingexpenses. This profit is used to measure profitability of an organization. From the above graphand table, it has been interpreted that both Tesco and Sainsbury's has increasing trend in theirgross profit. Besides this similarity, there are few differences in these companies as well whichare mentioned below:Sales revenue of Tesco is much higher than the sales of Sainsbury's which means Tescohas large market share. Expenses of Sainsbury's is much lower than Tesco due to which their Gross profit is highwhich means Tesco needs to review their spending strategies. NP ratio Year / companiesSainsburyTesco2015-162%0.25%2016-171.44%-0.07%
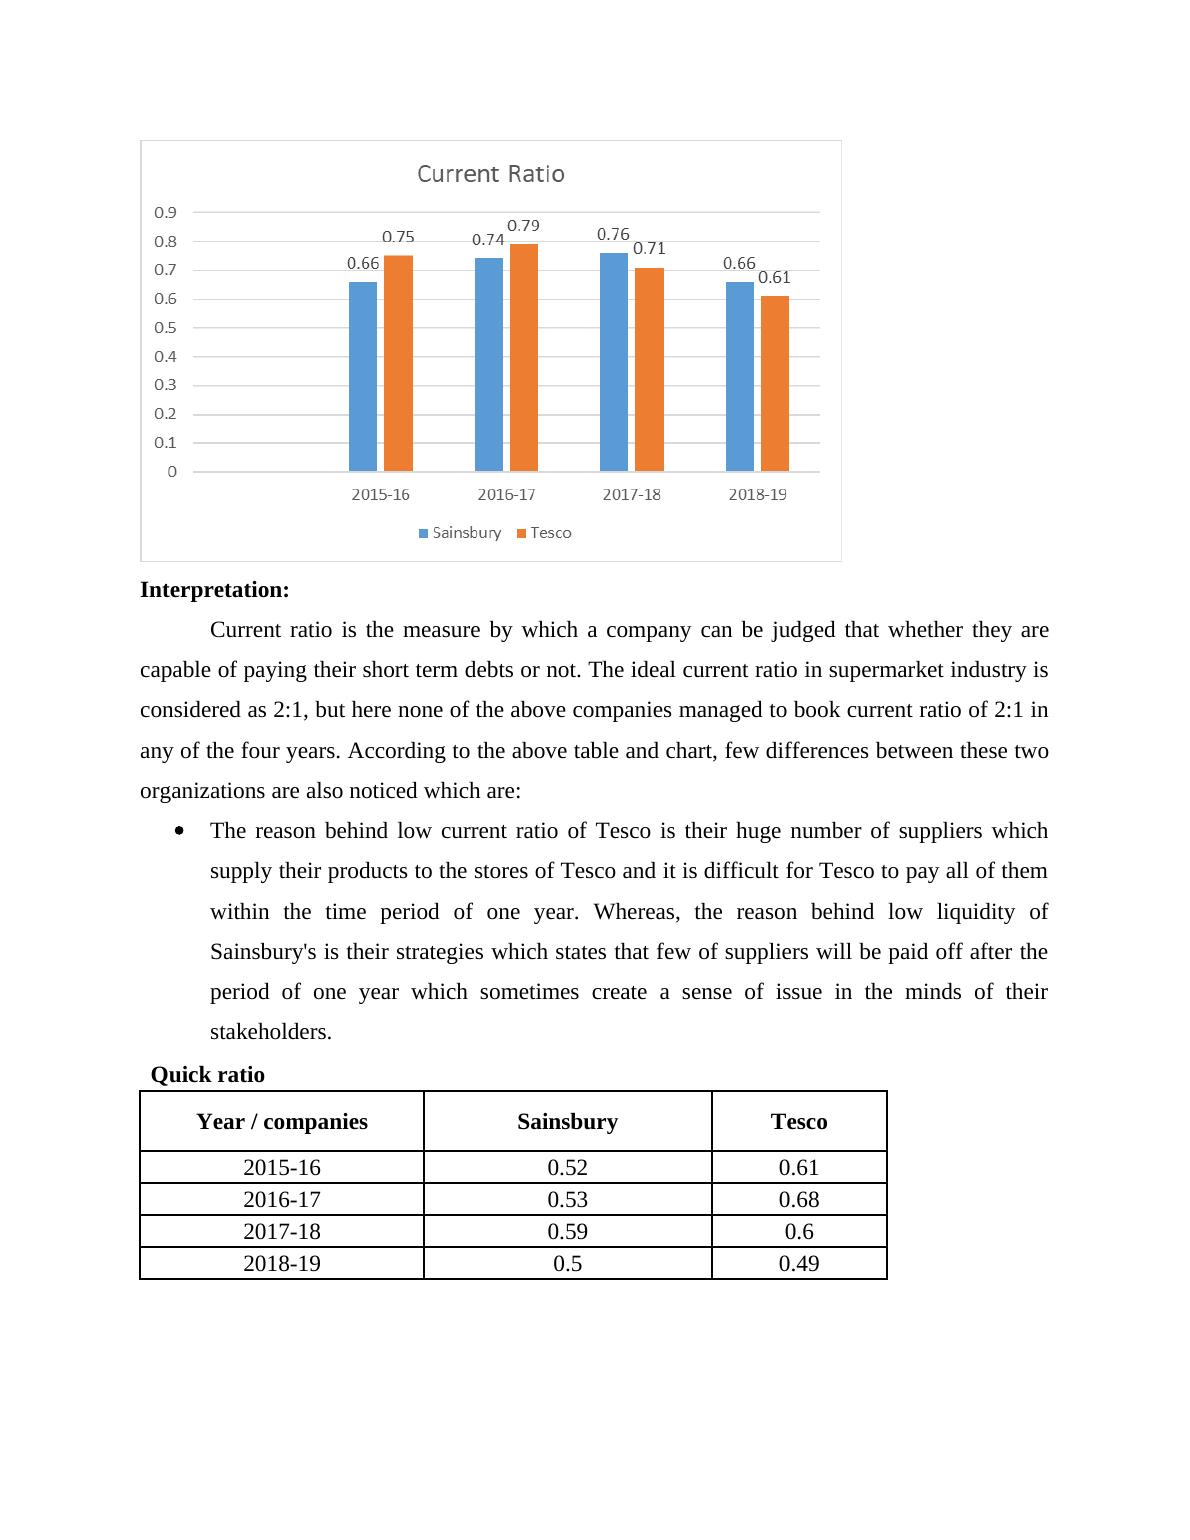
2017-181.09%2.10%2018-190.75%2.07%Interpretation:Net profit is the ultimate measure by which profit making ability of an organisation andbe evaluated (O'Donnell, Kramar and Dyball, 2013). In this case, both the companies managed toearn 1-2% of net profit against their overall sales revenue. Along with these similarities,comparison between these two companies are:Due to high expenses, Tesco has to face losses in year 2016-17 due to which their overallbrand equity decreases. Whereas, even after earning low sales Sainsbury's managed toearn profit every year. Another point of difference is that Tesco is highly engaged in their marketing activitiesdue to which in some year they are unable to book reasonable profit. Liquidity ratio analysisCurrent ratio Year / companiesSainsburyTesco2015-160.660.752016-170.740.792017-180.760.712018-190.660.61
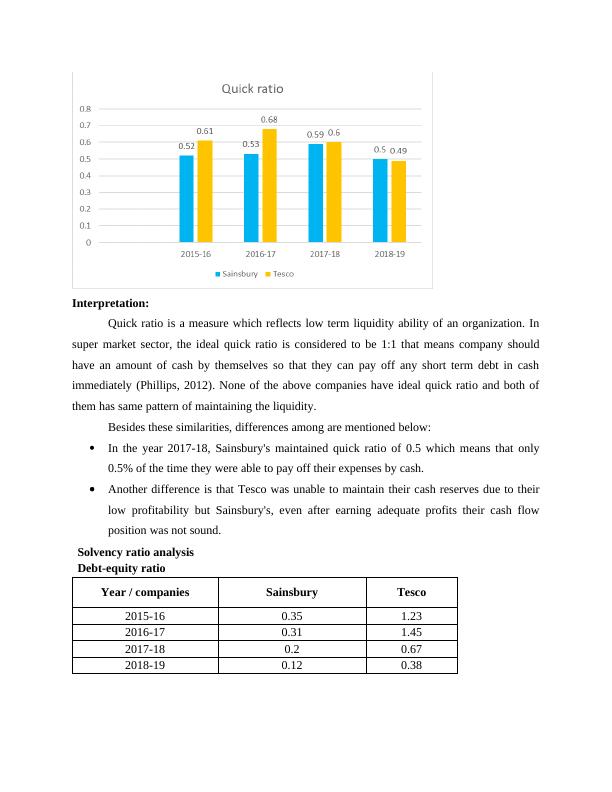
Interpretation:Current ratio is the measure by which a company can be judged that whether they arecapable of paying their short term debts or not. The ideal current ratio in supermarket industry isconsidered as 2:1, but here none of the above companies managed to book current ratio of 2:1 inany of the four years. According to the above table and chart, few differences between these twoorganizations are also noticed which are:The reason behind low current ratio of Tesco is their huge number of suppliers whichsupply their products to the stores of Tesco and it is difficult for Tesco to pay all of themwithin the time period of one year. Whereas, the reason behind low liquidity ofSainsbury's is their strategies which states that few of suppliers will be paid off after theperiod of one year which sometimes create a sense of issue in the minds of theirstakeholders. Quick ratio Year / companiesSainsburyTesco2015-160.520.612016-170.530.682017-180.590.62018-190.50.49
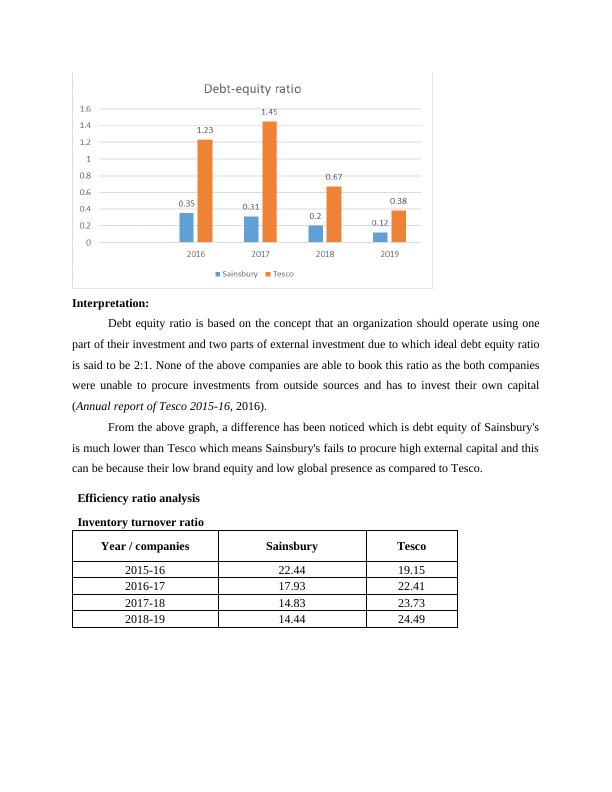
Interpretation:Quick ratio is a measure which reflects low term liquidity ability of an organization. Insuper market sector, the ideal quick ratio is considered to be 1:1 that means company shouldhave an amount of cash by themselves so that they can pay off any short term debt in cashimmediately (Phillips, 2012). None of the above companies have ideal quick ratio and both ofthem has same pattern of maintaining the liquidity. Besides these similarities, differences among are mentioned below:In the year 2017-18, Sainsbury's maintained quick ratio of 0.5 which means that only0.5% of the time they were able to pay off their expenses by cash. Another difference is that Tesco was unable to maintain their cash reserves due to theirlow profitability but Sainsbury's, even after earning adequate profits their cash flowposition was not sound. Solvency ratio analysis Debt-equity ratio Year / companiesSainsburyTesco2015-160.351.232016-170.311.452017-180.20.672018-190.120.38
Interpretation:Debt equity ratio is based on the concept that an organization should operate using onepart of their investment and two parts of external investment due to which ideal debt equity ratiois said to be 2:1. None of the above companies are able to book this ratio as the both companieswere unable to procure investments from outside sources and has to invest their own capital(Annual report of Tesco 2015-16, 2016). From the above graph, a difference has been noticed which is debt equity of Sainsbury'sis much lower than Tesco which means Sainsbury's fails to procure high external capital and thiscan be because their low brand equity and low global presence as compared to Tesco. Efficiency ratio analysis Inventory turnover ratio Year / companiesSainsburyTesco2015-1622.4419.152016-1717.9322.412017-1814.8323.732018-1914.4424.49
End of preview
Want to access all the pages? Upload your documents or become a member.
Related Documents
Financial Analysis Management & Enterprise Solved Assignmentlg...
|32
|5554
|53
Financial Analysis Management & Enterprise Assignment Solutionlg...
|24
|4214
|19
Financial Analysis Management & Enterprise: Assignmentlg...
|31
|7584
|54
Financial Analysis Management And Enterpirse - Assignmentlg...
|25
|3947
|54
Financial analysis and management enterprise (Doc)lg...
|22
|5808
|21
Financial Analysis Assignment Sample (Doc)lg...
|21
|3864
|132